Brunei Catalyst Carriers Market (2025-2031) | Trends, Companies, Value, Outlook, Analysis, Revenue, Size, Growth, Industry, Segmentation, Forecast & Share
Market Forecast By Product Type (Ceramics, Activated Carbon, Zeolites), By Shape/Composition (Sphere, Porous, Ring, Extrudate, Honeycomb), By End Use Industry (Oil & Gas, Chemical Manufacturing, Automotive, Petrochemicals, Pharmaceuticals, Agrochemicals, Others), By Material Type (Alumina, Titania, Zirconia, Silicone Carbide, Silica, Others), By Surface Area (Low, Intermediate, High) And Competitive Landscape
| Product Code: ETC5649964 | Publication Date: Nov 2023 | Updated Date: Dec 2025 | Product Type: Market Research Report | |
| Publisher: 6Wresearch | Author: Sumit Sagar | No. of Pages: 60 | No. of Figures: 30 | No. of Tables: 5 |
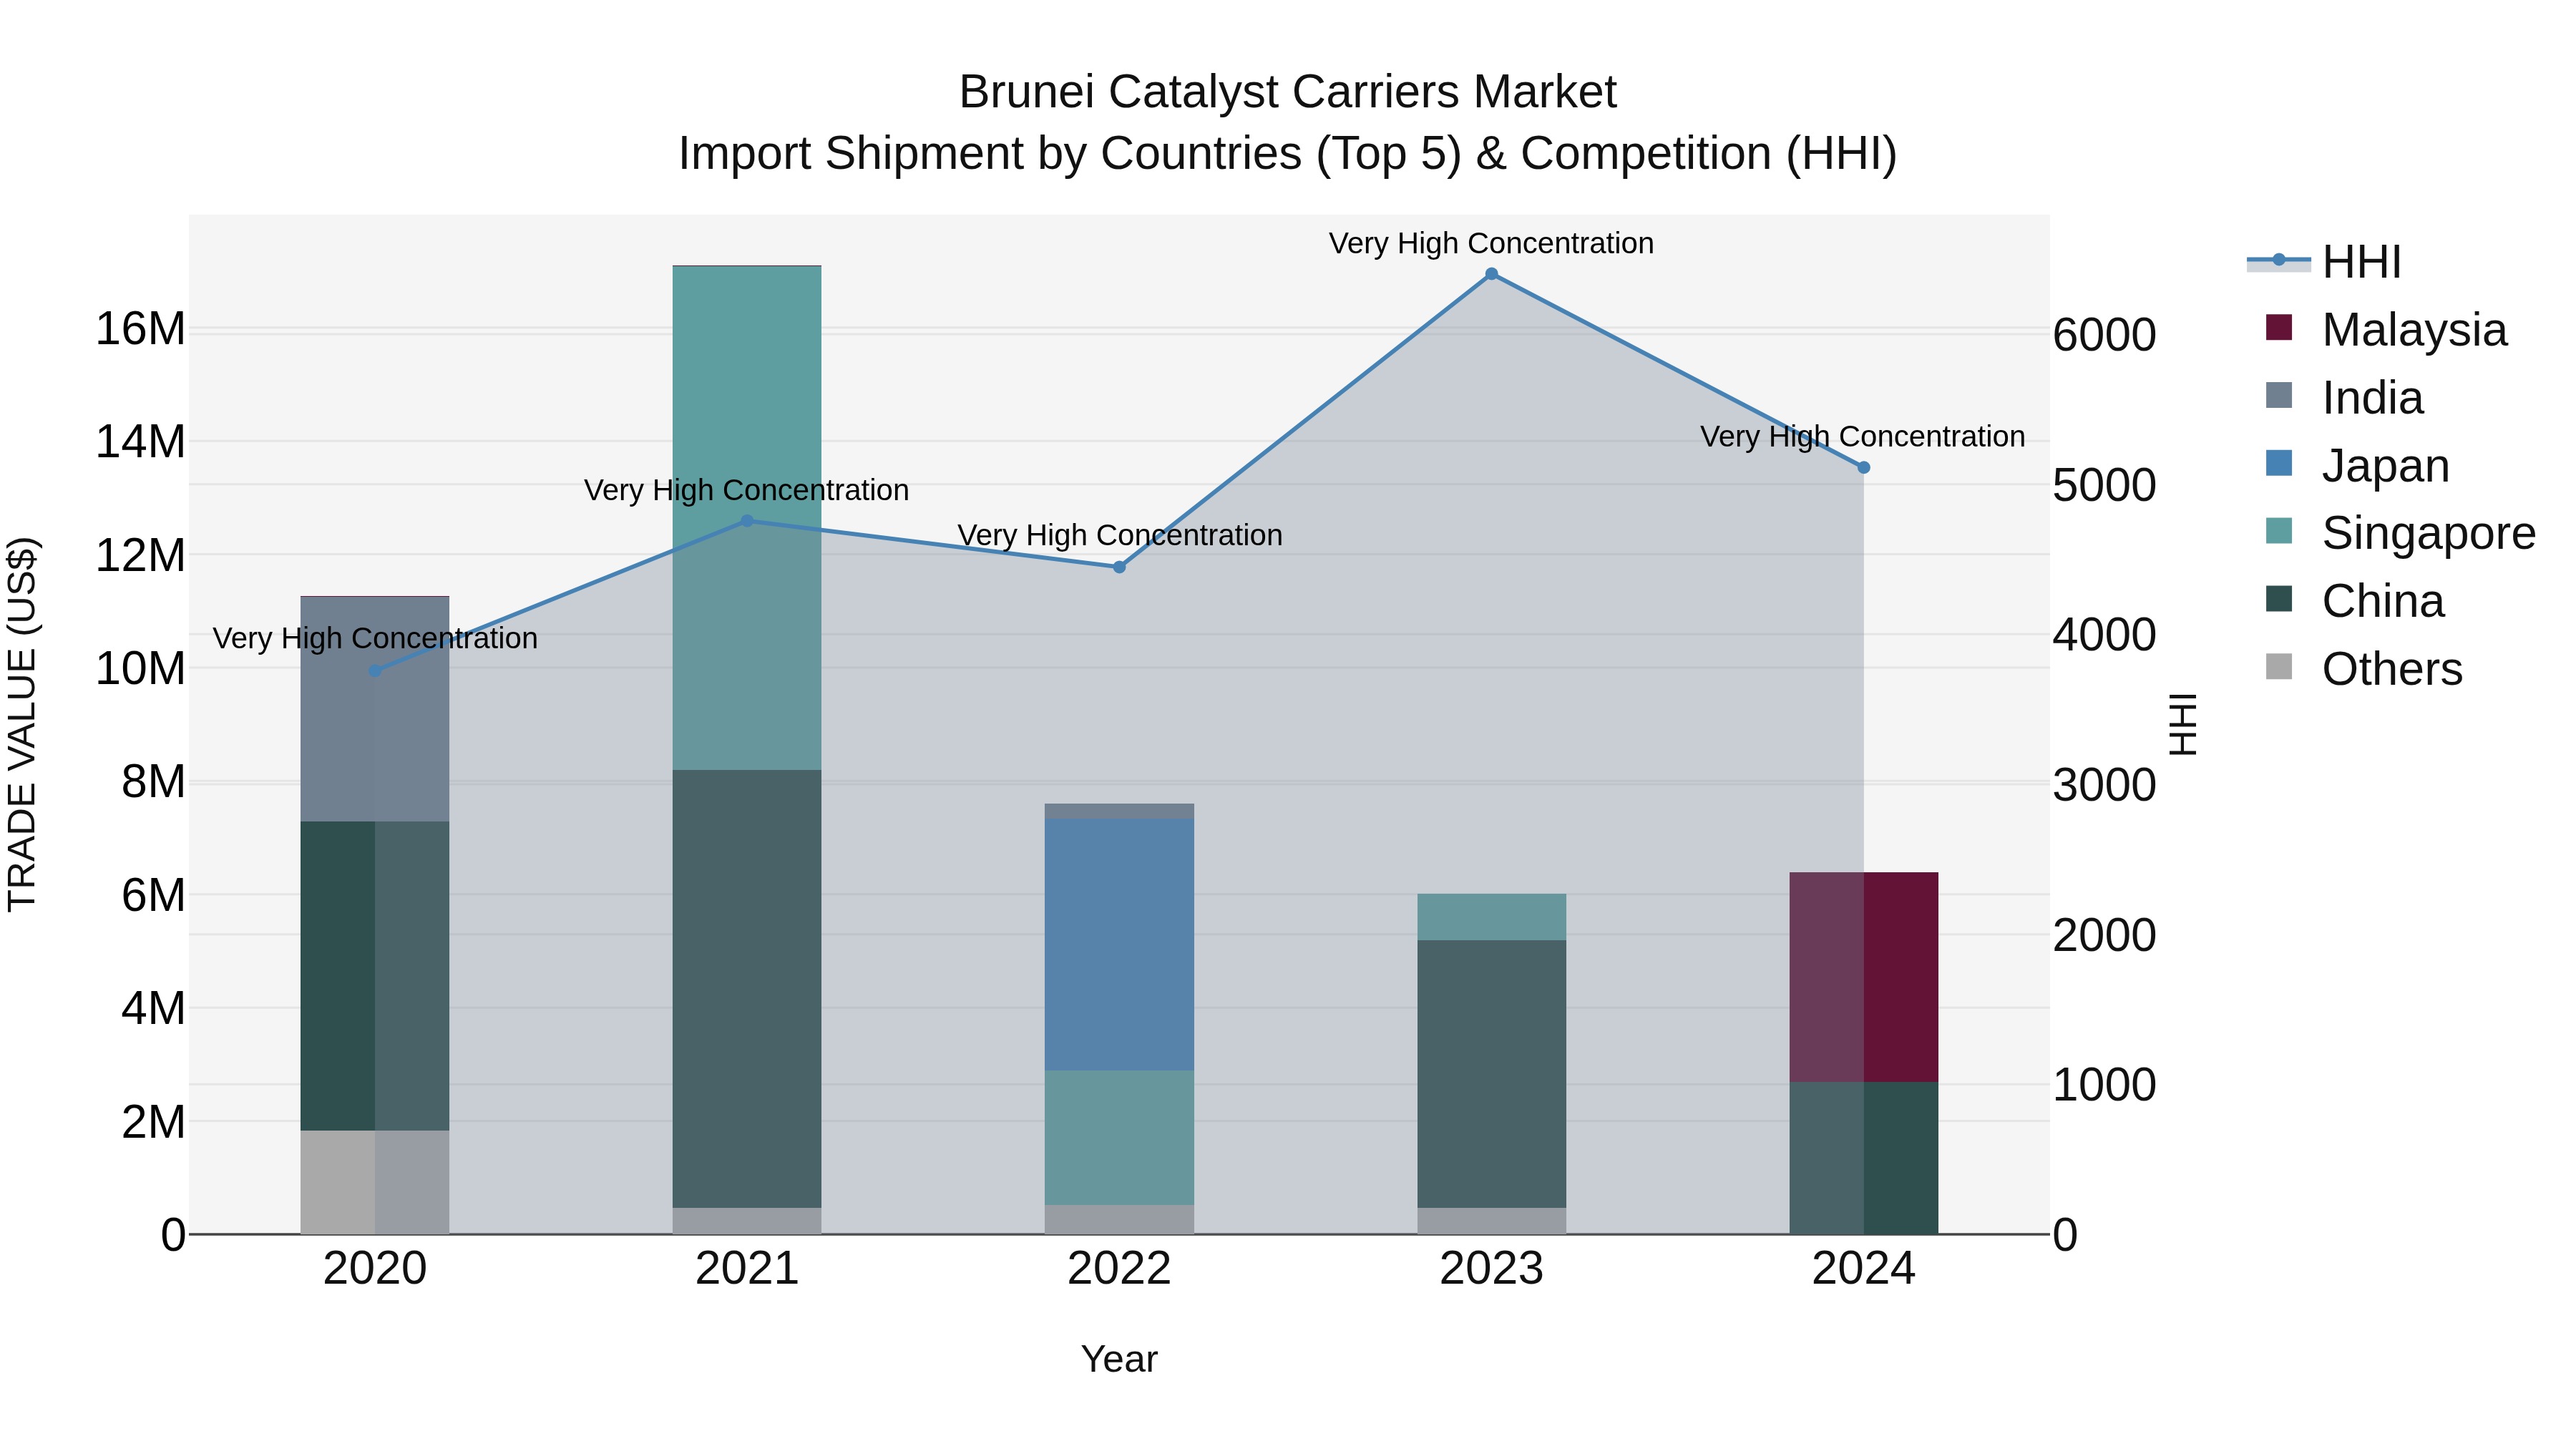
Brunei Catalyst Carriers Market: Top 5 Importing Countries and Market Competition (HHI) Analysis
The import shipments of catalyst carriers to Brunei in 2024 were primarily sourced from key countries such as Malaysia, China, USA, Singapore, and Germany. The market continued to exhibit high concentration levels, as indicated by the high Herfindahl-Hirschman Index (HHI). Despite a negative compound annual growth rate (CAGR) over the period of 2020-2024, there was a notable growth uptick in 2024 with a growth rate of 6.33%. The consistent flow of catalyst carriers into Brunei from these top exporting countries underscores the country`s reliance on external sources for this essential product.
Brunei Catalyst Carriers Market Overview
The catalyst carriers market in Brunei is closely linked to the petrochemical and chemical industries, where catalyst carriers are used to support and enhance catalytic processes. The market is driven by the demand for efficient and cost-effective catalysts that improve production yields and reduce operational costs in these industries.
Drivers of the market
The Brunei Catalyst Carriers Market is driven by the growing demand for catalysts in the petrochemical and chemical industries, where they play a crucial role in accelerating chemical reactions. The market is supported by the increasing industrial activities in Brunei, particularly in the oil and gas sector. The need for efficient and durable catalyst carriers that enhance the performance of catalysts is also propelling market growth.
Challenges of the market
The catalyst carriers market in Brunei is challenged by the high cost of raw materials and the specialized nature of the products, which limits market size. Additionally, competition from alternative materials and technologies presents further obstacles.
Government Policy of the market
The Brunei government plays a significant role in the catalyst carriers market through policies that promote the use of advanced materials in industrial processes. These policies may include tax incentives for manufacturers, support for research and development in catalyst technology, and regulations that ensure the safety and efficacy of catalyst carriers used in chemical reactions and environmental applications.
Key Highlights of the Report:
- Brunei Catalyst Carriers Market Outlook
- Market Size of Brunei Catalyst Carriers Market, 2024
- Forecast of Brunei Catalyst Carriers Market, 2031
- Historical Data and Forecast of Brunei Catalyst Carriers Revenues & Volume for the Period 2021-2031
- Brunei Catalyst Carriers Market Trend Evolution
- Brunei Catalyst Carriers Market Drivers and Challenges
- Brunei Catalyst Carriers Price Trends
- Brunei Catalyst Carriers Porter`s Five Forces
- Brunei Catalyst Carriers Industry Life Cycle
- Historical Data and Forecast of Brunei Catalyst Carriers Market Revenues & Volume By Product Type for the Period 2021-2031
- Historical Data and Forecast of Brunei Catalyst Carriers Market Revenues & Volume By Ceramics for the Period 2021-2031
- Historical Data and Forecast of Brunei Catalyst Carriers Market Revenues & Volume By Activated Carbon for the Period 2021-2031
- Historical Data and Forecast of Brunei Catalyst Carriers Market Revenues & Volume By Zeolites for the Period 2021-2031
- Historical Data and Forecast of Brunei Catalyst Carriers Market Revenues & Volume By Shape/Composition for the Period 2021-2031
- Historical Data and Forecast of Brunei Catalyst Carriers Market Revenues & Volume By Sphere for the Period 2021-2031
- Historical Data and Forecast of Brunei Catalyst Carriers Market Revenues & Volume By Porous for the Period 2021-2031
- Historical Data and Forecast of Brunei Catalyst Carriers Market Revenues & Volume By Ring for the Period 2021-2031
- Historical Data and Forecast of Brunei Catalyst Carriers Market Revenues & Volume By Extrudate for the Period 2021-2031
- Historical Data and Forecast of Brunei Catalyst Carriers Market Revenues & Volume By Honeycomb for the Period 2021-2031
- Historical Data and Forecast of Brunei Catalyst Carriers Market Revenues & Volume By End Use Industry for the Period 2021-2031
- Historical Data and Forecast of Brunei Catalyst Carriers Market Revenues & Volume By Oil & Gas for the Period 2021-2031
- Historical Data and Forecast of Brunei Catalyst Carriers Market Revenues & Volume By Chemical Manufacturing for the Period 2021-2031
- Historical Data and Forecast of Brunei Catalyst Carriers Market Revenues & Volume By Automotive for the Period 2021-2031
- Historical Data and Forecast of Brunei Catalyst Carriers Market Revenues & Volume By Petrochemicals for the Period 2021-2031
- Historical Data and Forecast of Brunei Catalyst Carriers Market Revenues & Volume By Pharmaceuticals for the Period 2021-2031
- Historical Data and Forecast of Brunei Catalyst Carriers Market Revenues & Volume By Agrochemicals for the Period 2021-2031
- Historical Data and Forecast of Brunei Catalyst Carriers Market Revenues & Volume By Others for the Period 2021-2031
- Historical Data and Forecast of Brunei Catalyst Carriers Market Revenues & Volume By Material Type for the Period 2021-2031
- Historical Data and Forecast of Brunei Catalyst Carriers Market Revenues & Volume By Alumina for the Period 2021-2031
- Historical Data and Forecast of Brunei Catalyst Carriers Market Revenues & Volume By Titania for the Period 2021-2031
- Historical Data and Forecast of Brunei Catalyst Carriers Market Revenues & Volume By Zirconia for the Period 2021-2031
- Historical Data and Forecast of Brunei Catalyst Carriers Market Revenues & Volume By Silicone Carbide for the Period 2021-2031
- Historical Data and Forecast of Brunei Catalyst Carriers Market Revenues & Volume By Silica for the Period 2021-2031
- Historical Data and Forecast of Brunei Catalyst Carriers Market Revenues & Volume By Others for the Period 2021-2031
- Historical Data and Forecast of Brunei Catalyst Carriers Market Revenues & Volume By Surface Area for the Period 2021-2031
- Historical Data and Forecast of Brunei Catalyst Carriers Market Revenues & Volume By Low for the Period 2021-2031
- Historical Data and Forecast of Brunei Catalyst Carriers Market Revenues & Volume By Intermediate for the Period 2021-2031
- Historical Data and Forecast of Brunei Catalyst Carriers Market Revenues & Volume By High for the Period 2021-2031
- Brunei Catalyst Carriers Import Export Trade Statistics
- Market Opportunity Assessment By Product Type
- Market Opportunity Assessment By Shape/Composition
- Market Opportunity Assessment By End Use Industry
- Market Opportunity Assessment By Material Type
- Market Opportunity Assessment By Surface Area
- Brunei Catalyst Carriers Top Companies Market Share
- Brunei Catalyst Carriers Competitive Benchmarking By Technical and Operational Parameters
- Brunei Catalyst Carriers Company Profiles
- Brunei Catalyst Carriers Key Strategic Recommendations
Frequently Asked Questions About the Market Study (FAQs):
6Wresearch actively monitors the Brunei Catalyst Carriers Market and publishes its comprehensive annual report, highlighting emerging trends, growth drivers, revenue analysis, and forecast outlook. Our insights help businesses to make data-backed strategic decisions with ongoing market dynamics. Our analysts track relevent industries related to the Brunei Catalyst Carriers Market, allowing our clients with actionable intelligence and reliable forecasts tailored to emerging regional needs.
Yes, we provide customisation as per your requirements. To learn more, feel free to contact us on sales@6wresearch.com
1 Executive Summary |
2 Introduction |
2.1 Key Highlights of the Report |
2.2 Report Description |
2.3 Market Scope & Segmentation |
2.4 Research Methodology |
2.5 Assumptions |
3 Brunei Catalyst Carriers Market Overview |
3.1 Brunei Country Macro Economic Indicators |
3.2 Brunei Catalyst Carriers Market Revenues & Volume, 2021 & 2031F |
3.3 Brunei Catalyst Carriers Market - Industry Life Cycle |
3.4 Brunei Catalyst Carriers Market - Porter's Five Forces |
3.5 Brunei Catalyst Carriers Market Revenues & Volume Share, By Product Type, 2021 & 2031F |
3.6 Brunei Catalyst Carriers Market Revenues & Volume Share, By Shape/Composition, 2021 & 2031F |
3.7 Brunei Catalyst Carriers Market Revenues & Volume Share, By End Use Industry, 2021 & 2031F |
3.8 Brunei Catalyst Carriers Market Revenues & Volume Share, By Material Type, 2021 & 2031F |
3.9 Brunei Catalyst Carriers Market Revenues & Volume Share, By Surface Area, 2021 & 2031F |
4 Brunei Catalyst Carriers Market Dynamics |
4.1 Impact Analysis |
4.2 Market Drivers |
4.2.1 Increasing demand for environmentally friendly catalyst carriers in Brunei |
4.2.2 Growth in the chemical and petrochemical industries in Brunei |
4.2.3 Technological advancements in catalyst carrier materials and manufacturing processes |
4.3 Market Restraints |
4.3.1 Fluctuations in raw material prices affecting production costs |
4.3.2 Stringent environmental regulations impacting the adoption of catalyst carriers |
4.3.3 Competition from alternative technologies and products |
5 Brunei Catalyst Carriers Market Trends |
6 Brunei Catalyst Carriers Market Segmentations |
6.1 Brunei Catalyst Carriers Market, By Product Type |
6.1.1 Overview and Analysis |
6.1.2 Brunei Catalyst Carriers Market Revenues & Volume, By Ceramics, 2021-2031F |
6.1.3 Brunei Catalyst Carriers Market Revenues & Volume, By Activated Carbon, 2021-2031F |
6.1.4 Brunei Catalyst Carriers Market Revenues & Volume, By Zeolites, 2021-2031F |
6.2 Brunei Catalyst Carriers Market, By Shape/Composition |
6.2.1 Overview and Analysis |
6.2.2 Brunei Catalyst Carriers Market Revenues & Volume, By Sphere, 2021-2031F |
6.2.3 Brunei Catalyst Carriers Market Revenues & Volume, By Porous, 2021-2031F |
6.2.4 Brunei Catalyst Carriers Market Revenues & Volume, By Ring, 2021-2031F |
6.2.5 Brunei Catalyst Carriers Market Revenues & Volume, By Extrudate, 2021-2031F |
6.2.6 Brunei Catalyst Carriers Market Revenues & Volume, By Honeycomb, 2021-2031F |
6.3 Brunei Catalyst Carriers Market, By End Use Industry |
6.3.1 Overview and Analysis |
6.3.2 Brunei Catalyst Carriers Market Revenues & Volume, By Oil & Gas, 2021-2031F |
6.3.3 Brunei Catalyst Carriers Market Revenues & Volume, By Chemical Manufacturing, 2021-2031F |
6.3.4 Brunei Catalyst Carriers Market Revenues & Volume, By Automotive, 2021-2031F |
6.3.5 Brunei Catalyst Carriers Market Revenues & Volume, By Petrochemicals, 2021-2031F |
6.3.6 Brunei Catalyst Carriers Market Revenues & Volume, By Pharmaceuticals, 2021-2031F |
6.3.7 Brunei Catalyst Carriers Market Revenues & Volume, By Agrochemicals, 2021-2031F |
6.4 Brunei Catalyst Carriers Market, By Material Type |
6.4.1 Overview and Analysis |
6.4.2 Brunei Catalyst Carriers Market Revenues & Volume, By Alumina, 2021-2031F |
6.4.3 Brunei Catalyst Carriers Market Revenues & Volume, By Titania, 2021-2031F |
6.4.4 Brunei Catalyst Carriers Market Revenues & Volume, By Zirconia, 2021-2031F |
6.4.5 Brunei Catalyst Carriers Market Revenues & Volume, By Silicone Carbide, 2021-2031F |
6.4.6 Brunei Catalyst Carriers Market Revenues & Volume, By Silica, 2021-2031F |
6.4.7 Brunei Catalyst Carriers Market Revenues & Volume, By Others, 2021-2031F |
6.5 Brunei Catalyst Carriers Market, By Surface Area |
6.5.1 Overview and Analysis |
6.5.2 Brunei Catalyst Carriers Market Revenues & Volume, By Low, 2021-2031F |
6.5.3 Brunei Catalyst Carriers Market Revenues & Volume, By Intermediate, 2021-2031F |
6.5.4 Brunei Catalyst Carriers Market Revenues & Volume, By High, 2021-2031F |
7 Brunei Catalyst Carriers Market Import-Export Trade Statistics |
7.1 Brunei Catalyst Carriers Market Export to Major Countries |
7.2 Brunei Catalyst Carriers Market Imports from Major Countries |
8 Brunei Catalyst Carriers Market Key Performance Indicators |
8.1 Research and development investment in catalyst carrier technologies |
8.2 Adoption rate of catalyst carriers in key industries in Brunei |
8.3 Number of patents filed for catalyst carrier innovations |
8.4 Environmental impact assessment of catalyst carrier usage in Brunei |
8.5 Rate of new product introductions in the catalyst carrier market |
9 Brunei Catalyst Carriers Market - Opportunity Assessment |
9.1 Brunei Catalyst Carriers Market Opportunity Assessment, By Product Type, 2021 & 2031F |
9.2 Brunei Catalyst Carriers Market Opportunity Assessment, By Shape/Composition, 2021 & 2031F |
9.3 Brunei Catalyst Carriers Market Opportunity Assessment, By End Use Industry, 2021 & 2031F |
9.4 Brunei Catalyst Carriers Market Opportunity Assessment, By Material Type, 2021 & 2031F |
9.5 Brunei Catalyst Carriers Market Opportunity Assessment, By Surface Area, 2021 & 2031F |
10 Brunei Catalyst Carriers Market - Competitive Landscape |
10.1 Brunei Catalyst Carriers Market Revenue Share, By Companies, 2024 |
10.2 Brunei Catalyst Carriers Market Competitive Benchmarking, By Operating and Technical Parameters |
11 Company Profiles |
12 Recommendations | 13 Disclaimer |
Export potential assessment - trade Analytics for 2030
Export potential enables firms to identify high-growth global markets with greater confidence by combining advanced trade intelligence with a structured quantitative methodology. The framework analyzes emerging demand trends and country-level import patterns while integrating macroeconomic and trade datasets such as GDP and population forecasts, bilateral import–export flows, tariff structures, elasticity differentials between developed and developing economies, geographic distance, and import demand projections. Using weighted trade values from 2020–2024 as the base period to project country-to-country export potential for 2030, these inputs are operationalized through calculated drivers such as gravity model parameters, tariff impact factors, and projected GDP per-capita growth. Through an analysis of hidden potentials, demand hotspots, and market conditions that are most favorable to success, this method enables firms to focus on target countries, maximize returns, and global expansion with data, backed by accuracy.
By factoring in the projected importer demand gap that is currently unmet and could be potential opportunity, it identifies the potential for the Exporter (Country) among 190 countries, against the general trade analysis, which identifies the biggest importer or exporter.
To discover high-growth global markets and optimize your business strategy:
Click Here
Pricing
- Single User License$ 1,995
- Department License$ 2,400
- Site License$ 3,120
- Global License$ 3,795

Search
Thought Leadership and Analyst Meet


Our Clients
Latest Reports
- Philippines Polyhydroxybutyrate-co-Hydroxyvalerate Market (2026-2032) | Trends, Insights, Challenges, Restraints, Competition, Size, Value, Forecast, Pricing, Share, Outlook, Revenue, Investment Opportunities, Strategy, Drivers, Demand, Growth, segmentation, Analysis, Companies
- Peru Polyhydroxybutyrate-co-Hydroxyvalerate Market (2026-2032) | Growth, Demand, Challenges, Share, Trends, Analysis, Pricing, Investment Opportunities, Drivers, Value, Forecast, Competition, Size, Companies, Insights, Outlook, Restraints, segmentation, Revenue, Strategy
- Pakistan Polyhydroxybutyrate-co-Hydroxyvalerate Market (2026-2032) | Restraints, segmentation, Pricing, Forecast, Share, Strategy, Competition, Trends, Insights, Drivers, Challenges, Growth, Revenue, Outlook, Value, Investment Opportunities, Companies, Size, Analysis, Demand
- Oman Polyhydroxybutyrate-co-Hydroxyvalerate Market (2026-2032) | Drivers, segmentation, Insights, Competition, Pricing, Outlook, Size, Revenue, Challenges, Forecast, Analysis, Growth, Value, Share, Trends, Investment Opportunities, Strategy, Restraints, Companies, Demand
- Nigeria Polyhydroxybutyrate-co-Hydroxyvalerate Market (2026-2032) | Value, Investment Opportunities, Analysis, Revenue, Restraints, Pricing, Outlook, Competition, Demand, Growth, Forecast, Companies, Trends, Challenges, segmentation, Drivers, Insights, Share, Size, Strategy
- Nepal Polyhydroxybutyrate-co-Hydroxyvalerate Market (2026-2032) | Insights, Analysis, Drivers, Share, Revenue, Demand, segmentation, Investment Opportunities, Competition, Forecast, Growth, Pricing, Companies, Strategy, Trends, Restraints, Challenges, Outlook, Size, Value
- Myanmar Polyhydroxybutyrate-co-Hydroxyvalerate Market (2026-2032) | Outlook, Revenue, Strategy, Restraints, Drivers, segmentation, Share, Forecast, Competition, Insights, Growth, Pricing, Size, Demand, Value, Companies, Trends, Challenges, Investment Opportunities, Analysis
- Morocco Polyhydroxybutyrate-co-Hydroxyvalerate Market (2026-2032) | Outlook, Investment Opportunities, Restraints, Strategy, Forecast, Challenges, Drivers, Growth, Companies, segmentation, Trends, Size, Competition, Revenue, Demand, Insights, Share, Analysis, Value, Pricing
- Mexico Polyhydroxybutyrate-co-Hydroxyvalerate Market (2026-2032) | Size, Drivers, Outlook, Share, Strategy, Growth, Pricing, Challenges, Companies, Demand, Value, Investment Opportunities, Restraints, Trends, Forecast, segmentation, Analysis, Insights, Competition, Revenue
- Malaysia Polyhydroxybutyrate-co-Hydroxyvalerate Market (2026-2032) | Share, segmentation, Size, Companies, Analysis, Insights, Forecast, Value, Revenue, Drivers, Restraints, Challenges, Investment Opportunities, Trends, Competition, Strategy, Demand, Growth, Outlook, Pricing
Industry Events and Analyst Meet

HIMTEX 2026

India Refining Summit 2026

India EV Show 2026

EV tech India Expo 2026

Auto Tech Asia 2026
Whitepaper
- Middle East & Africa Commercial Security Market Click here to view more.
- Middle East & Africa Fire Safety Systems & Equipment Market Click here to view more.
- GCC Drone Market Click here to view more.
- Middle East Lighting Fixture Market Click here to view more.
- GCC Physical & Perimeter Security Market Click here to view more.
6WResearch In News
- Doha a strategic location for EV manufacturing hub: IPA Qatar
- Demand for luxury TVs surging in the GCC, says Samsung
- Empowering Growth: The Thriving Journey of Bangladesh’s Cable Industry
- Demand for luxury TVs surging in the GCC, says Samsung
- Video call with a traditional healer? Once unthinkable, it’s now common in South Africa
- Intelligent Buildings To Smooth GCC’s Path To Net Zero