Brunei Coaster Market (2026-2032) | Competitive Landscape, Segmentation, Trends, Value, Companies, Analysis, Industry, Share, Outlook, Growth, Forecast, Size & Revenue
Market Forecast By Type (Absorbent Coasters, Non-absorbent Coasters), By Category (Reusable Coasters, Disposable Coasters), By Material (Plastic, Ceramic, Cotton, Rubber, Bamboo, Leather, Others), By Shape (Square, Round, Rectangle, Others), By Price (Low, Medium, High), By End-user (Residential, Commercial, HoReCa, Pubs and Lounges, Offices, Households, Others), By Distribution Channel (Online, Company-owned Websites, E-commerce Portals, Offline, Hypermarkets & Supermarkets, Specialty Stores, Others) And Competitive Landscape
| Product Code: ETC6523546 | Publication Date: Sep 2024 | Updated Date: Apr 2026 | Product Type: Market Research Report | |
| Publisher: 6Wresearch | Author: Sumit Sagar | No. of Pages: 75 | No. of Figures: 35 | No. of Tables: 20 |
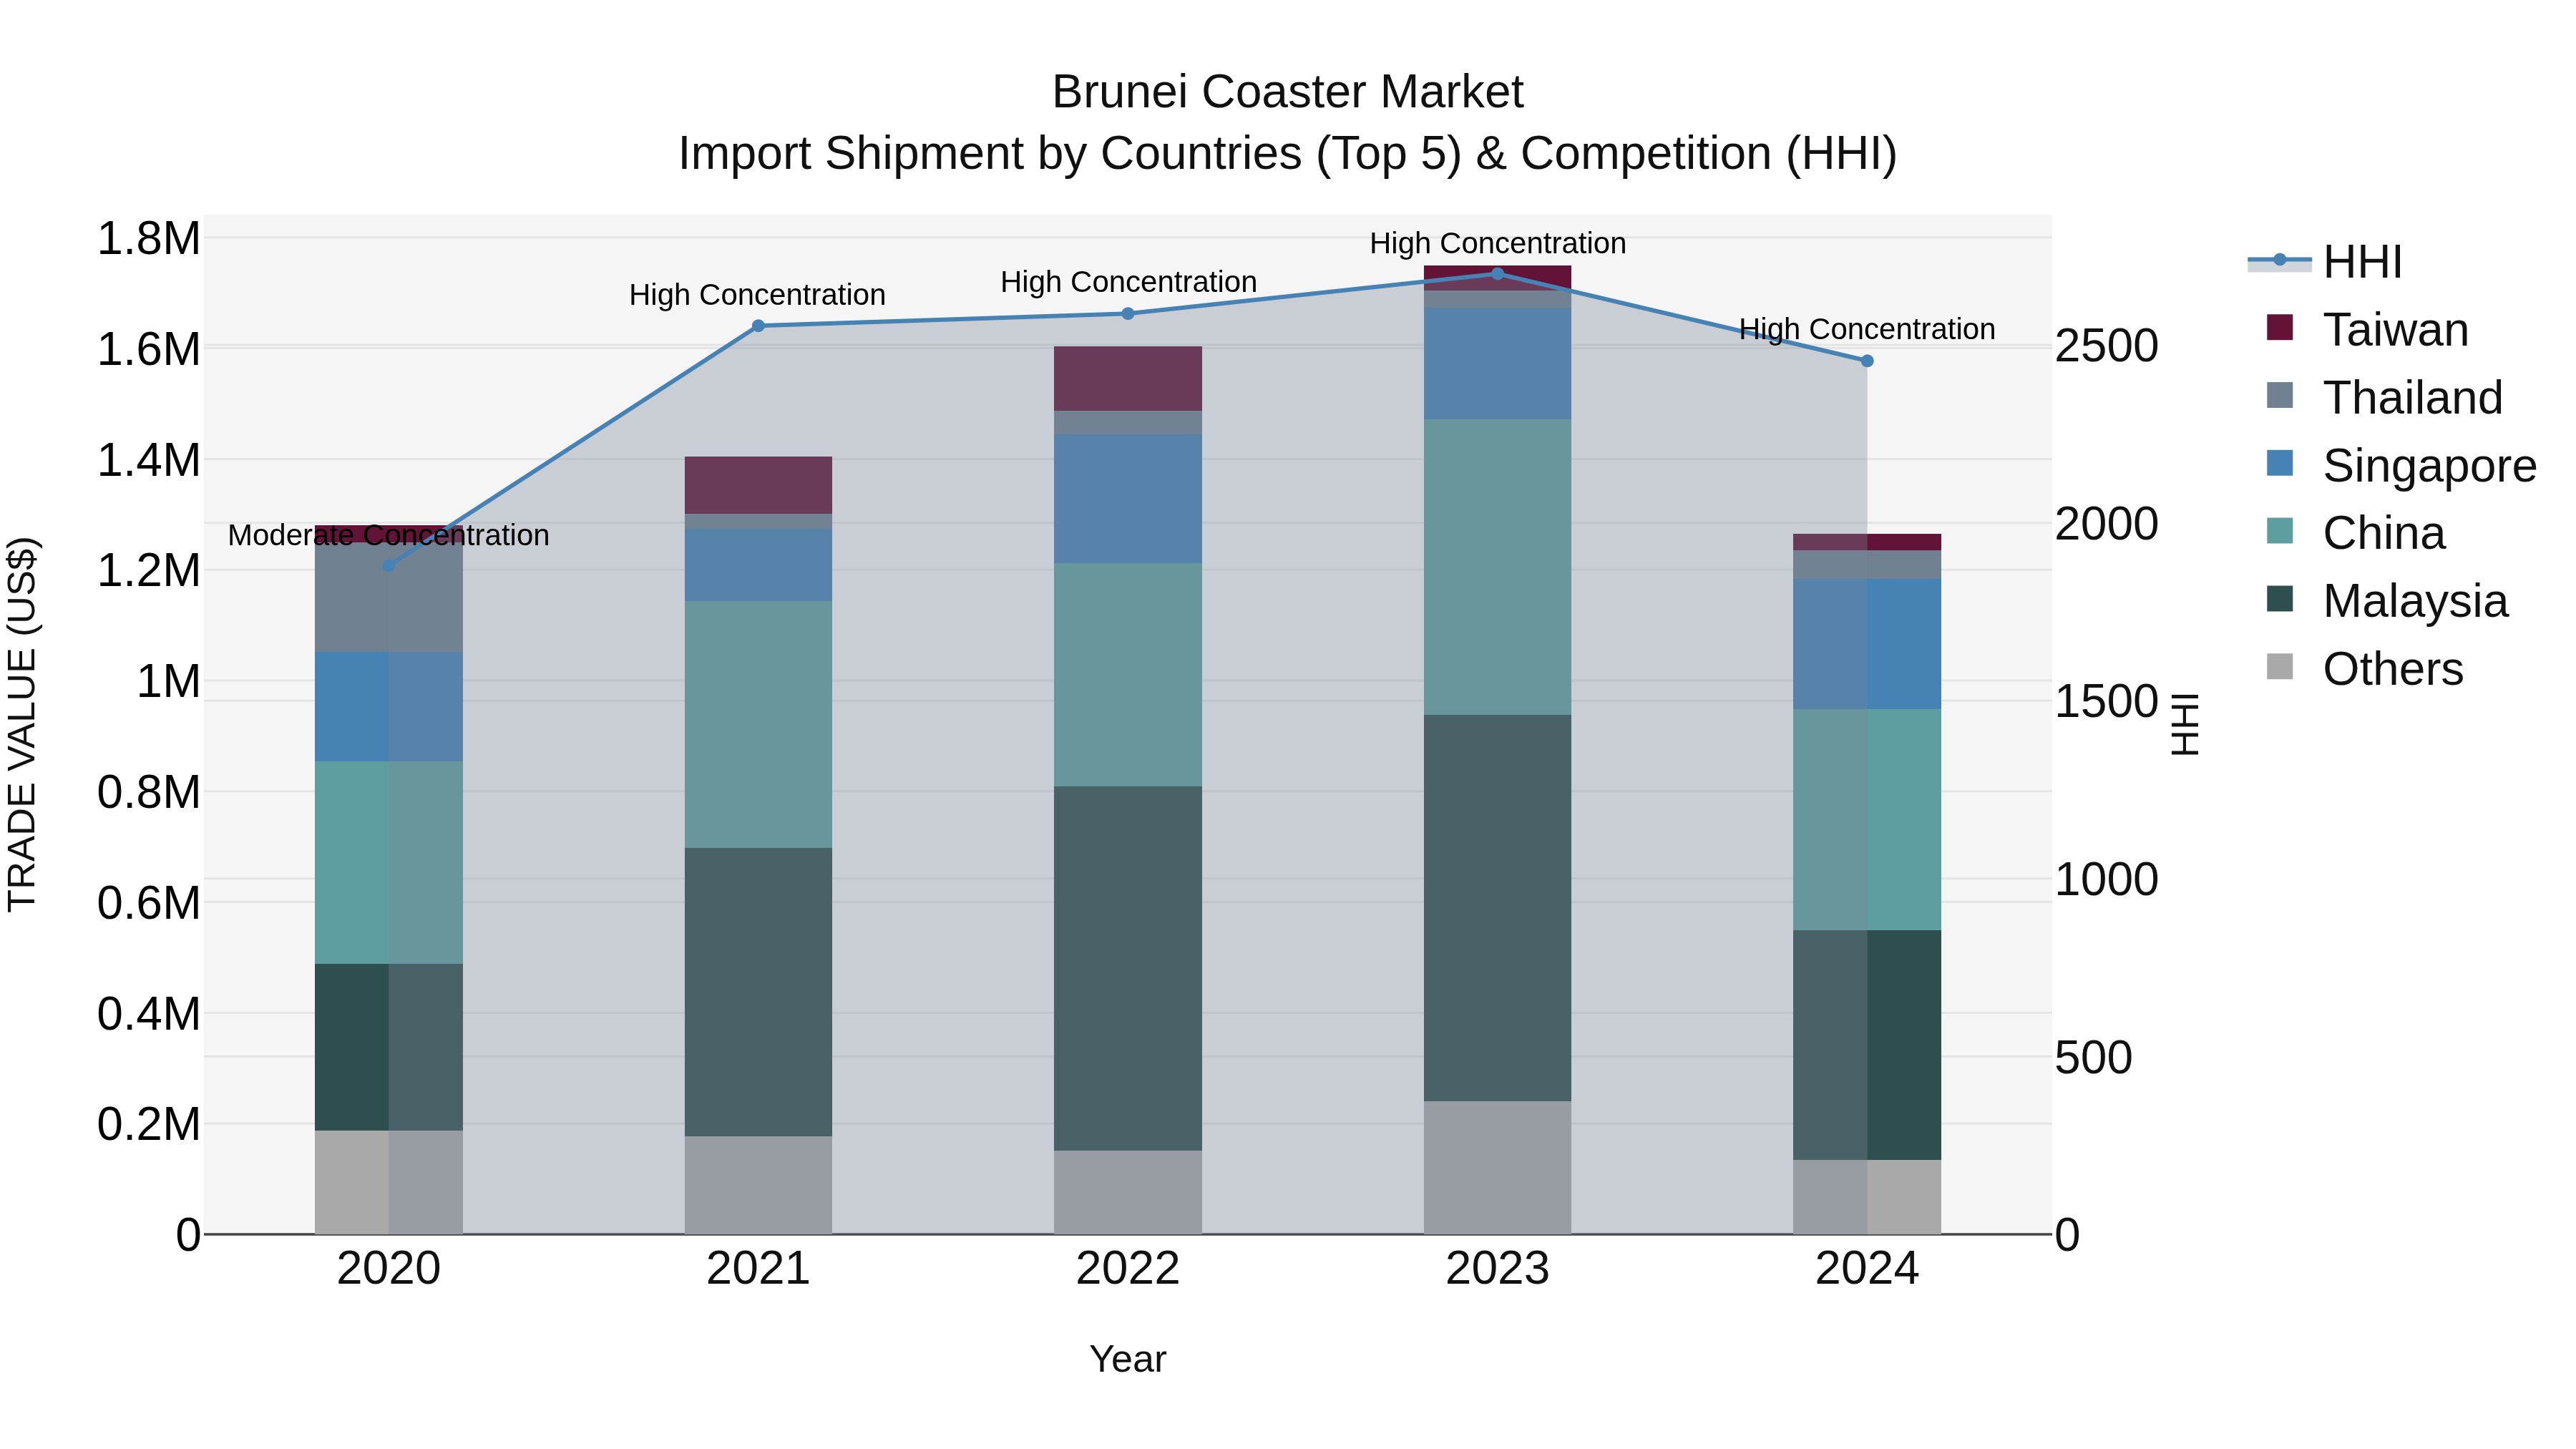
Brunei Coaster Market: Top 5 Importing Countries and Market Competition (HHI) Analysis
Despite a decline in the growth rate in 2024, Brunei coaster import market continues to be dominated by neighboring countries such as Malaysia, China, and Singapore. The high concentration of the Herfindahl-Hirschman Index (HHI) indicates a competitive market environment. The negative compound annual growth rate (CAGR) over the past four years suggests a challenging landscape, while the significant drop in growth rate from 2023 to 2024 highlights potential market fluctuations. Brunei coaster import industry may benefit from strategies to enhance competitiveness and foster sustainable growth amidst these dynamics.
Key Highlights of the Report:
- Brunei Coaster Market Outlook
- Market Size of Brunei Coaster Market, 2025
- Forecast of Brunei Coaster Market, 2032
- Historical Data and Forecast of Brunei Coaster Revenues & Volume for the Period 2022 - 2032
- Brunei Coaster Market Trend Evolution
- Brunei Coaster Market Drivers and Challenges
- Brunei Coaster Price Trends
- Brunei Coaster Porter's Five Forces
- Brunei Coaster Industry Life Cycle
- Historical Data and Forecast of Brunei Coaster Market Revenues & Volume By Type for the Period 2022 - 2032
- Historical Data and Forecast of Brunei Coaster Market Revenues & Volume By Absorbent Coasters for the Period 2022 - 2032
- Historical Data and Forecast of Brunei Coaster Market Revenues & Volume By Non-absorbent Coasters for the Period 2022 - 2032
- Historical Data and Forecast of Brunei Coaster Market Revenues & Volume By Category for the Period 2022 - 2032
- Historical Data and Forecast of Brunei Coaster Market Revenues & Volume By Reusable Coasters for the Period 2022 - 2032
- Historical Data and Forecast of Brunei Coaster Market Revenues & Volume By Disposable Coasters for the Period 2022 - 2032
- Historical Data and Forecast of Brunei Coaster Market Revenues & Volume By Material for the Period 2022 - 2032
- Historical Data and Forecast of Brunei Coaster Market Revenues & Volume By Plastic for the Period 2022 - 2032
- Historical Data and Forecast of Brunei Coaster Market Revenues & Volume By Ceramic for the Period 2022 - 2032
- Historical Data and Forecast of Brunei Coaster Market Revenues & Volume By Cotton for the Period 2022 - 2032
- Historical Data and Forecast of Brunei Coaster Market Revenues & Volume By Rubber for the Period 2022 - 2032
- Historical Data and Forecast of Brunei Coaster Market Revenues & Volume By Bamboo for the Period 2022 - 2032
- Historical Data and Forecast of Brunei Coaster Market Revenues & Volume By Leather for the Period 2022 - 2032
- Historical Data and Forecast of Brunei Coaster Market Revenues & Volume By Others for the Period 2022 - 2032
- Historical Data and Forecast of Brunei Coaster Market Revenues & Volume By Shape for the Period 2022 - 2032
- Historical Data and Forecast of Brunei Coaster Market Revenues & Volume By Square for the Period 2022 - 2032
- Historical Data and Forecast of Brunei Coaster Market Revenues & Volume By Round for the Period 2022 - 2032
- Historical Data and Forecast of Brunei Coaster Market Revenues & Volume By Rectangle for the Period 2022 - 2032
- Historical Data and Forecast of Brunei Coaster Market Revenues & Volume By Others for the Period 2022 - 2032
- Historical Data and Forecast of Brunei Coaster Market Revenues & Volume By Price for the Period 2022 - 2032
- Historical Data and Forecast of Brunei Coaster Market Revenues & Volume By Low for the Period 2022 - 2032
- Historical Data and Forecast of Brunei Coaster Market Revenues & Volume By Medium for the Period 2022 - 2032
- Historical Data and Forecast of Brunei Coaster Market Revenues & Volume By High for the Period 2022 - 2032
- Historical Data and Forecast of Brunei Coaster Market Revenues & Volume By End-user for the Period 2022 - 2032
- Historical Data and Forecast of Brunei Coaster Market Revenues & Volume By Residential for the Period 2022 - 2032
- Historical Data and Forecast of Brunei Coaster Market Revenues & Volume By Commercial for the Period 2022 - 2032
- Historical Data and Forecast of Brunei Coaster Market Revenues & Volume By HoReCa for the Period 2022 - 2032
- Historical Data and Forecast of Brunei Coaster Market Revenues & Volume By Pubs and Lounges for the Period 2022 - 2032
- Historical Data and Forecast of Brunei Coaster Market Revenues & Volume By Offices for the Period 2022 - 2032
- Historical Data and Forecast of Brunei Coaster Market Revenues & Volume By Households for the Period 2022 - 2032
- Historical Data and Forecast of Brunei Coaster Market Revenues & Volume By Others for the Period 2022 - 2032
- Historical Data and Forecast of Brunei Coaster Market Revenues & Volume By Distribution Channel for the Period 2022 - 2032
- Historical Data and Forecast of Brunei Coaster Market Revenues & Volume By Online for the Period 2022 - 2032
- Historical Data and Forecast of Brunei Coaster Market Revenues & Volume By Company-owned Websites for the Period 2022 - 2032
- Historical Data and Forecast of Brunei Coaster Market Revenues & Volume By E-commerce Portals for the Period 2022 - 2032
- Historical Data and Forecast of Brunei Coaster Market Revenues & Volume By Offline for the Period 2022 - 2032
- Historical Data and Forecast of Brunei Coaster Market Revenues & Volume By Hypermarkets & Supermarkets for the Period 2022 - 2032
- Historical Data and Forecast of Brunei Coaster Market Revenues & Volume By Specialty Stores for the Period 2022 - 2032
- Historical Data and Forecast of Brunei Coaster Market Revenues & Volume By Others for the Period 2022 - 2032
- Brunei Coaster Import Export Trade Statistics
- Market Opportunity Assessment By Type
- Market Opportunity Assessment By Category
- Market Opportunity Assessment By Material
- Market Opportunity Assessment By Shape
- Market Opportunity Assessment By Price
- Market Opportunity Assessment By End-user
- Market Opportunity Assessment By Distribution Channel
- Brunei Coaster Top Companies Market Share
- Brunei Coaster Competitive Benchmarking By Technical and Operational Parameters
- Brunei Coaster Company Profiles
- Brunei Coaster Key Strategic Recommendations
Frequently Asked Questions About the Market Study (FAQs):
6Wresearch actively monitors the Brunei Coaster Market and publishes its comprehensive annual report, highlighting emerging trends, growth drivers, revenue analysis, and forecast outlook. Our insights help businesses to make data-backed strategic decisions with ongoing market dynamics. Our analysts track relevent industries related to the Brunei Coaster Market, allowing our clients with actionable intelligence and reliable forecasts tailored to emerging regional needs.
Yes, we provide customisation as per your requirements. To learn more, feel free to contact us on sales@6wresearch.com
1 Executive Summary |
2 Introduction |
2.1 Key Highlights of the Report |
2.2 Report Description |
2.3 Market Scope & Segmentation |
2.4 Research Methodology |
2.5 Assumptions |
3 Brunei Coaster Market Overview |
3.1 Brunei Country Macro Economic Indicators |
3.2 Brunei Coaster Market Revenues & Volume, 2022 & 2032F |
3.3 Brunei Coaster Market - Industry Life Cycle |
3.4 Brunei Coaster Market - Porter's Five Forces |
3.5 Brunei Coaster Market Revenues & Volume Share, By Type, 2022 & 2032F |
3.6 Brunei Coaster Market Revenues & Volume Share, By Category, 2022 & 2032F |
3.7 Brunei Coaster Market Revenues & Volume Share, By Material, 2022 & 2032F |
3.8 Brunei Coaster Market Revenues & Volume Share, By Shape, 2022 & 2032F |
3.9 Brunei Coaster Market Revenues & Volume Share, By Price, 2022 & 2032F |
3.10 Brunei Coaster Market Revenues & Volume Share, By End-user, 2022 & 2032F |
3.11 Brunei Coaster Market Revenues & Volume Share, By Distribution Channel, 2022 & 2032F |
4 Brunei Coaster Market Dynamics |
4.1 Impact Analysis |
4.2 Market Drivers |
4.2.1 Increasing tourism in Brunei driving demand for attractions and leisure activities, including coasters. |
4.2.2 Rising disposable income of the population leading to higher spending on entertainment and recreation. |
4.2.3 Government initiatives to promote tourism and develop the leisure industry, including theme parks. |
4.3 Market Restraints |
4.3.1 Limited land availability for expanding or building new coaster attractions. |
4.3.2 Seasonal fluctuations in tourist arrivals affecting coaster market demand. |
4.3.3 High initial investment and operational costs for developing and maintaining coaster facilities. |
5 Brunei Coaster Market Trends |
6 Brunei Coaster Market, By Types |
6.1 Brunei Coaster Market, By Type |
6.1.1 Overview and Analysis |
6.1.2 Brunei Coaster Market Revenues & Volume, By Type, 2022 - 2032F |
6.1.3 Brunei Coaster Market Revenues & Volume, By Absorbent Coasters, 2022 - 2032F |
6.1.4 Brunei Coaster Market Revenues & Volume, By Non-absorbent Coasters, 2022 - 2032F |
6.2 Brunei Coaster Market, By Category |
6.2.1 Overview and Analysis |
6.2.2 Brunei Coaster Market Revenues & Volume, By Reusable Coasters, 2022 - 2032F |
6.2.3 Brunei Coaster Market Revenues & Volume, By Disposable Coasters, 2022 - 2032F |
6.3 Brunei Coaster Market, By Material |
6.3.1 Overview and Analysis |
6.3.2 Brunei Coaster Market Revenues & Volume, By Plastic, 2022 - 2032F |
6.3.3 Brunei Coaster Market Revenues & Volume, By Ceramic, 2022 - 2032F |
6.3.4 Brunei Coaster Market Revenues & Volume, By Cotton, 2022 - 2032F |
6.3.5 Brunei Coaster Market Revenues & Volume, By Rubber, 2022 - 2032F |
6.3.6 Brunei Coaster Market Revenues & Volume, By Bamboo, 2022 - 2032F |
6.3.7 Brunei Coaster Market Revenues & Volume, By Leather, 2022 - 2032F |
6.4 Brunei Coaster Market, By Shape |
6.4.1 Overview and Analysis |
6.4.2 Brunei Coaster Market Revenues & Volume, By Square, 2022 - 2032F |
6.4.3 Brunei Coaster Market Revenues & Volume, By Round, 2022 - 2032F |
6.4.4 Brunei Coaster Market Revenues & Volume, By Rectangle, 2022 - 2032F |
6.4.5 Brunei Coaster Market Revenues & Volume, By Others, 2022 - 2032F |
6.5 Brunei Coaster Market, By Price |
6.5.1 Overview and Analysis |
6.5.2 Brunei Coaster Market Revenues & Volume, By Low, 2022 - 2032F |
6.5.3 Brunei Coaster Market Revenues & Volume, By Medium, 2022 - 2032F |
6.5.4 Brunei Coaster Market Revenues & Volume, By High, 2022 - 2032F |
6.6 Brunei Coaster Market, By End-user |
6.6.1 Overview and Analysis |
6.6.2 Brunei Coaster Market Revenues & Volume, By Residential, 2022 - 2032F |
6.6.3 Brunei Coaster Market Revenues & Volume, By Commercial, 2022 - 2032F |
6.6.4 Brunei Coaster Market Revenues & Volume, By HoReCa, 2022 - 2032F |
6.6.5 Brunei Coaster Market Revenues & Volume, By Pubs and Lounges, 2022 - 2032F |
6.6.6 Brunei Coaster Market Revenues & Volume, By Offices, 2022 - 2032F |
6.6.7 Brunei Coaster Market Revenues & Volume, By Households, 2022 - 2032F |
6.7 Brunei Coaster Market, By Distribution Channel |
6.7.1 Overview and Analysis |
6.7.2 Brunei Coaster Market Revenues & Volume, By Online, 2022 - 2032F |
6.7.3 Brunei Coaster Market Revenues & Volume, By Company-owned Websites, 2022 - 2032F |
6.7.4 Brunei Coaster Market Revenues & Volume, By Offline, 2022 - 2032F |
6.7.5 Brunei Coaster Market Revenues & Volume, By Offline, 2022 - 2032F |
6.7.6 Brunei Coaster Market Revenues & Volume, By Hypermarkets & Supermarkets, 2022 - 2032F |
6.7.7 Brunei Coaster Market Revenues & Volume, By Specialty Stores, 2022 - 2032F |
7 Brunei Coaster Market Import-Export Trade Statistics |
7.1 Brunei Coaster Market Export to Major Countries |
7.2 Brunei Coaster Market Imports from Major Countries |
8 Brunei Coaster Market Key Performance Indicators |
8.1 Visitor satisfaction scores at coaster attractions. |
8.2 Average waiting times for coaster rides. |
8.3 Percentage of repeat visitors to coaster parks. |
8.4 Average spending per visitor on coaster-related activities. |
8.5 Number of new coaster designs or installations in the market. |
9 Brunei Coaster Market - Opportunity Assessment |
9.1 Brunei Coaster Market Opportunity Assessment, By Type, 2022 & 2032F |
9.2 Brunei Coaster Market Opportunity Assessment, By Category, 2022 & 2032F |
9.3 Brunei Coaster Market Opportunity Assessment, By Material, 2022 & 2032F |
9.4 Brunei Coaster Market Opportunity Assessment, By Shape, 2022 & 2032F |
9.5 Brunei Coaster Market Opportunity Assessment, By Price, 2022 & 2032F |
9.6 Brunei Coaster Market Opportunity Assessment, By End-user, 2022 & 2032F |
9.7 Brunei Coaster Market Opportunity Assessment, By Distribution Channel, 2022 & 2032F |
10 Brunei Coaster Market - Competitive Landscape |
10.1 Brunei Coaster Market Revenue Share, By Companies, 2025 |
10.2 Brunei Coaster Market Competitive Benchmarking, By Operating and Technical Parameters |
11 Company Profiles |
12 Recommendations |
13 Disclaimer |
Global Go To Market Strategy - 2030
Export potential enables firms to identify high-growth global markets with greater confidence by combining advanced trade intelligence with a structured quantitative methodology. The framework analyzes emerging demand trends and country-level import patterns while integrating macroeconomic and trade datasets such as GDP and population forecasts, bilateral import–export flows, tariff structures, elasticity differentials between developed and developing economies, geographic distance, and import demand projections. Using weighted trade values from 2020–2024 as the base period to project country-to-country export potential for 2030, these inputs are operationalized through calculated drivers such as gravity model parameters, tariff impact factors, and projected GDP per-capita growth. Through an analysis of hidden potentials, demand hotspots, and market conditions that are most favorable to success, this method enables firms to focus on target countries, maximize returns, and global expansion with data, backed by accuracy.
By factoring in the projected importer demand gap that is currently unmet and could be potential opportunity, it identifies the potential for the Exporter (Country) among 190 countries, against the general trade analysis, which identifies the biggest importer or exporter.
To discover high-growth global markets and optimize your business strategy:
Click Here
Pricing
- Single User License$ 1,995
- Department License$ 2,400
- Site License$ 3,120
- Global License$ 3,795

Leadership Perspectives from Industry Events
Search
Thought Leadership and Analyst Meet


Our Clients
6WResearch In News
- Doha a strategic location for EV manufacturing hub: IPA Qatar
- Demand for luxury TVs surging in the GCC, says Samsung
- Empowering Growth: The Thriving Journey of Bangladesh’s Cable Industry
- Demand for luxury TVs surging in the GCC, says Samsung
- Video call with a traditional healer? Once unthinkable, it’s now common in South Africa
- Intelligent Buildings To Smooth GCC’s Path To Net Zero
Latest Reports
- Taiwan Airport Wireless Infrastructure Market (2026-2032)
- Vietnam Airport Wireless Infrastructure Market (2026-2032)
- Thailand Airport Wireless Infrastructure Market (2026-2032)
- South Korea Airport Wireless Infrastructure Market (2026-2032)
- Romania Airport Wireless Infrastructure Market (2026-2032)
- Qatar Airport Wireless Infrastructure Market (2026-2032)
- Philippines Airport Wireless Infrastructure Market (2026-2032)
- Japan Airport Wireless Infrastructure Market (2026-2032)
- Taiwan Airport Winter Services Market (2026-2032)
- Vietnam Airport Winter Services Market (2026-2032)
Industry Events and Analyst Meet

HIMTEX 2026

India Refining Summit 2026

India EV Show 2026

EV tech India Expo 2026

Auto Tech Asia 2026
Whitepaper
- Middle East & Africa Commercial Security Market Click here to view more.
- Middle East & Africa Fire Safety Systems & Equipment Market Click here to view more.
- GCC Drone Market Click here to view more.
- Middle East Lighting Fixture Market Click here to view more.
- GCC Physical & Perimeter Security Market Click here to view more.