Brunei Eco-Friendly Straws Market (2026-2032) | Companies, Segmentation, Outlook, Industry, Share, Analysis, Growth, Forecast, Competitive Landscape, Size & Revenue, Trends, Value
Market Forecast By Product Type (Straight Straw, Printed, Non-printed, Flexible Straw), By Material (Paper, Virgin Craft Paper, Recycled Paper, Pasta, Glass, Bamboo, Polylactic Acid (PLA)), By Straw Width/Diameter (< 7 mm, 7-10 mm, 10-15 mm, > 15 mm), By End-Use (Food Service, Hotels & Logistics, Bars & Lounges, Cafes & Fast Food Outlets, Cinemas, Airline & Railway Catering, Institutional, Educational), By Distribution Channel (Manufacturers (Direct Sales), Distributors, Retailers, Hypermarkets, Supermarkets, Convenience Stores, Specialty Stores) And Competitive Landscape
| Product Code: ETC6525670 | Publication Date: Sep 2024 | Updated Date: Apr 2026 | Product Type: Market Research Report | |
| Publisher: 6Wresearch | Author: Vasudha | No. of Pages: 75 | No. of Figures: 35 | No. of Tables: 20 |
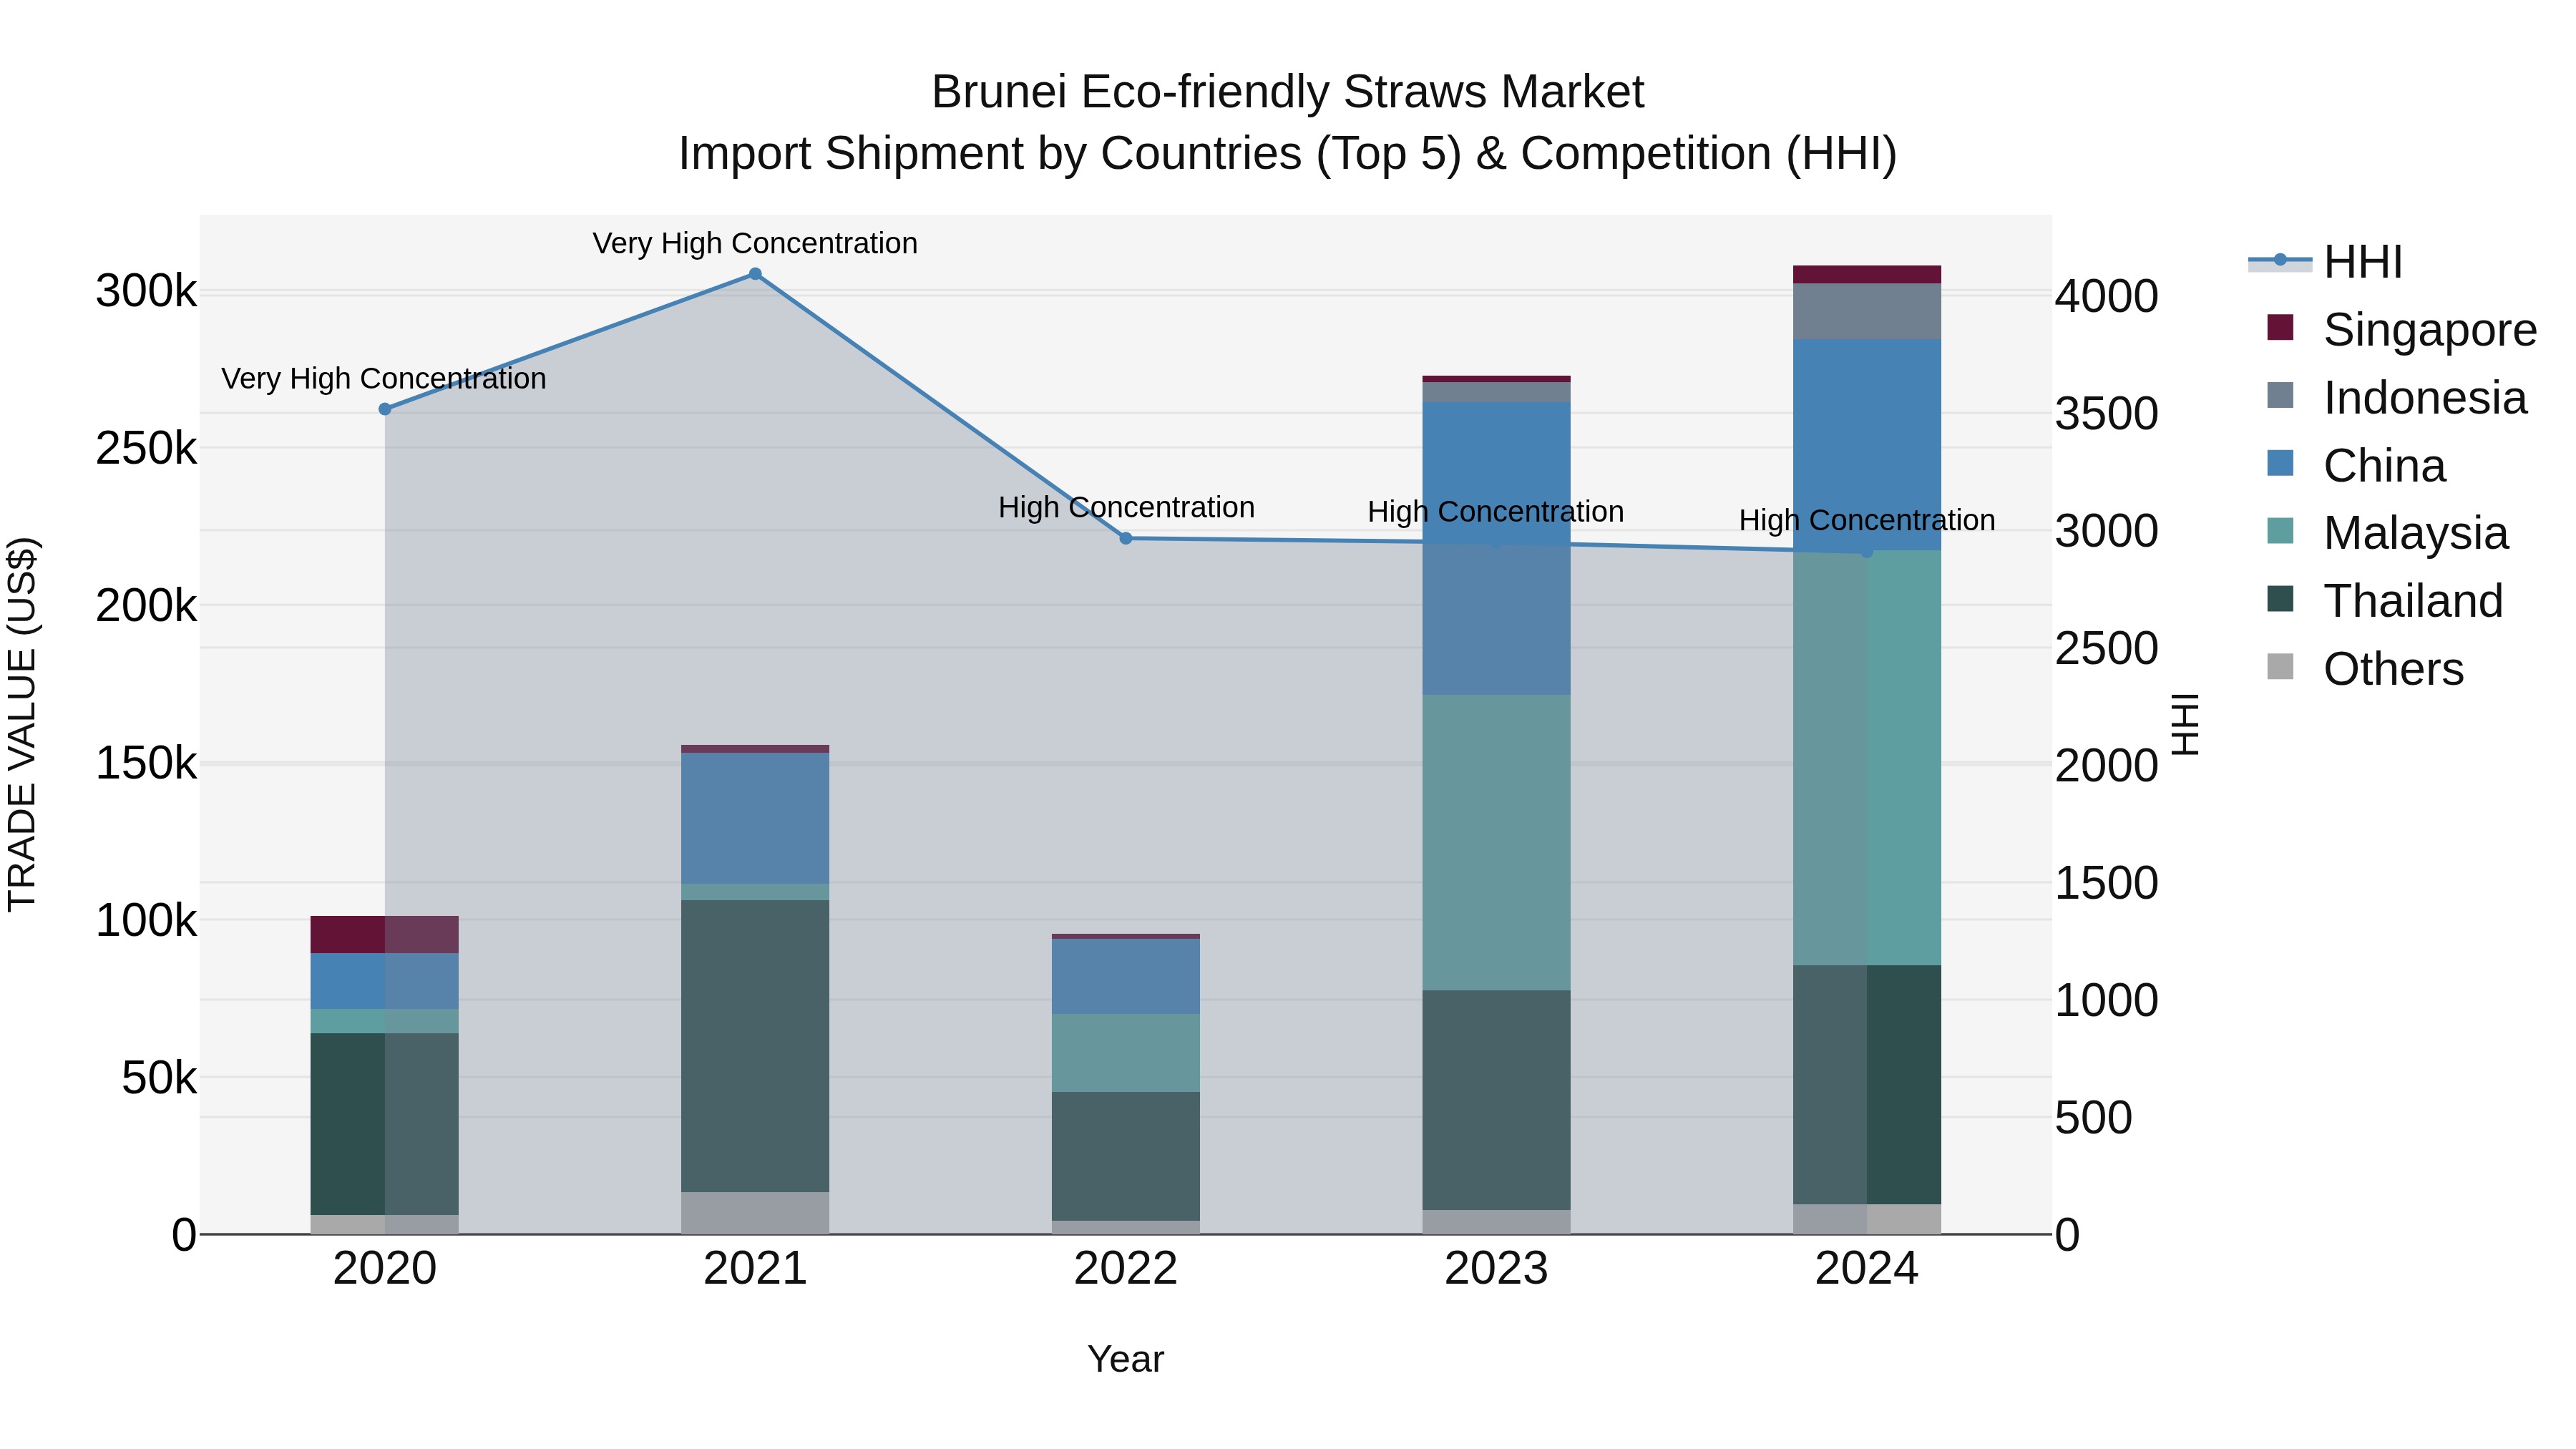
Brunei Eco-friendly Straws Market: Top 5 Importing Countries and Market Competition (HHI) Analysis
The import shipments of eco-friendly straws to Brunei have seen significant growth, with Malaysia, Thailand, China, Indonesia, and Hong Kong emerging as the top exporting countries in 2024. The high Herfindahl-Hirschman Index (HHI) concentration in 2023 has continued into 2024, indicating a competitive market landscape. The impressive compound annual growth rate (CAGR) of 32.09% from 2020 to 2024 highlights the increasing demand for eco-friendly alternatives. Moreover, the growth rate of 12.84% from 2023 to 2024 signifies a sustained momentum in the market, pointing towards a promising future for eco-friendly products in Brunei.
Key Highlights of the Report:
- Brunei Eco-Friendly Straws Market Outlook
- Market Size of Brunei Eco-Friendly Straws Market, 2025
- Forecast of Brunei Eco-Friendly Straws Market, 2032
- Historical Data and Forecast of Brunei Eco-Friendly Straws Revenues & Volume for the Period 2022 - 2032
- Brunei Eco-Friendly Straws Market Trend Evolution
- Brunei Eco-Friendly Straws Market Drivers and Challenges
- Brunei Eco-Friendly Straws Price Trends
- Brunei Eco-Friendly Straws Porter's Five Forces
- Brunei Eco-Friendly Straws Industry Life Cycle
- Historical Data and Forecast of Brunei Eco-Friendly Straws Market Revenues & Volume By Product Type for the Period 2022 - 2032
- Historical Data and Forecast of Brunei Eco-Friendly Straws Market Revenues & Volume By Straight Straw for the Period 2022 - 2032
- Historical Data and Forecast of Brunei Eco-Friendly Straws Market Revenues & Volume By Printed for the Period 2022 - 2032
- Historical Data and Forecast of Brunei Eco-Friendly Straws Market Revenues & Volume By Non-printed for the Period 2022 - 2032
- Historical Data and Forecast of Brunei Eco-Friendly Straws Market Revenues & Volume By Flexible Straw for the Period 2022 - 2032
- Historical Data and Forecast of Brunei Eco-Friendly Straws Market Revenues & Volume By Material for the Period 2022 - 2032
- Historical Data and Forecast of Brunei Eco-Friendly Straws Market Revenues & Volume By Paper for the Period 2022 - 2032
- Historical Data and Forecast of Brunei Eco-Friendly Straws Market Revenues & Volume By Virgin Craft Paper for the Period 2022 - 2032
- Historical Data and Forecast of Brunei Eco-Friendly Straws Market Revenues & Volume By Recycled Paper for the Period 2022 - 2032
- Historical Data and Forecast of Brunei Eco-Friendly Straws Market Revenues & Volume By Pasta for the Period 2022 - 2032
- Historical Data and Forecast of Brunei Eco-Friendly Straws Market Revenues & Volume By Glass for the Period 2022 - 2032
- Historical Data and Forecast of Brunei Eco-Friendly Straws Market Revenues & Volume By Bamboo for the Period 2022 - 2032
- Historical Data and Forecast of Brunei Eco-Friendly Straws Market Revenues & Volume By Polylactic Acid (PLA) for the Period 2022 - 2032
- Historical Data and Forecast of Brunei Eco-Friendly Straws Market Revenues & Volume By Straw Width/Diameter for the Period 2022 - 2032
- Historical Data and Forecast of Brunei Eco-Friendly Straws Market Revenues & Volume By < 7 mm for the Period 2022 - 2032
- Historical Data and Forecast of Brunei Eco-Friendly Straws Market Revenues & Volume By 7-10 mm for the Period 2022 - 2032
- Historical Data and Forecast of Brunei Eco-Friendly Straws Market Revenues & Volume By 10-15 mm for the Period 2022 - 2032
- Historical Data and Forecast of Brunei Eco-Friendly Straws Market Revenues & Volume By > 15 mm for the Period 2022 - 2032
- Historical Data and Forecast of Brunei Eco-Friendly Straws Market Revenues & Volume By End-Use for the Period 2022 - 2032
- Historical Data and Forecast of Brunei Eco-Friendly Straws Market Revenues & Volume By Food Service for the Period 2022 - 2032
- Historical Data and Forecast of Brunei Eco-Friendly Straws Market Revenues & Volume By Hotels & Logistics for the Period 2022 - 2032
- Historical Data and Forecast of Brunei Eco-Friendly Straws Market Revenues & Volume By Bars & Lounges for the Period 2022 - 2032
- Historical Data and Forecast of Brunei Eco-Friendly Straws Market Revenues & Volume By Cafes & Fast Food Outlets for the Period 2022 - 2032
- Historical Data and Forecast of Brunei Eco-Friendly Straws Market Revenues & Volume By Cinemas for the Period 2022 - 2032
- Historical Data and Forecast of Brunei Eco-Friendly Straws Market Revenues & Volume By Airline & Railway Catering for the Period 2022 - 2032
- Historical Data and Forecast of Brunei Eco-Friendly Straws Market Revenues & Volume By Institutional for the Period 2022 - 2032
- Historical Data and Forecast of Brunei Eco-Friendly Straws Market Revenues & Volume By Educational for the Period 2022 - 2032
- Historical Data and Forecast of Brunei Eco-Friendly Straws Market Revenues & Volume By Distribution Channel for the Period 2022 - 2032
- Historical Data and Forecast of Brunei Eco-Friendly Straws Market Revenues & Volume By Manufacturers (Direct Sales) for the Period 2022 - 2032
- Historical Data and Forecast of Brunei Eco-Friendly Straws Market Revenues & Volume By Distributors for the Period 2022 - 2032
- Historical Data and Forecast of Brunei Eco-Friendly Straws Market Revenues & Volume By Retailers for the Period 2022 - 2032
- Historical Data and Forecast of Brunei Eco-Friendly Straws Market Revenues & Volume By Hypermarkets for the Period 2022 - 2032
- Historical Data and Forecast of Brunei Eco-Friendly Straws Market Revenues & Volume By Supermarkets for the Period 2022 - 2032
- Historical Data and Forecast of Brunei Eco-Friendly Straws Market Revenues & Volume By Convenience Stores for the Period 2022 - 2032
- Historical Data and Forecast of Brunei Eco-Friendly Straws Market Revenues & Volume By Specialty Stores for the Period 2022 - 2032
- Brunei Eco-Friendly Straws Import Export Trade Statistics
- Market Opportunity Assessment By Product Type
- Market Opportunity Assessment By Material
- Market Opportunity Assessment By Straw Width/Diameter
- Market Opportunity Assessment By End-Use
- Market Opportunity Assessment By Distribution Channel
- Brunei Eco-Friendly Straws Top Companies Market Share
- Brunei Eco-Friendly Straws Competitive Benchmarking By Technical and Operational Parameters
- Brunei Eco-Friendly Straws Company Profiles
- Brunei Eco-Friendly Straws Key Strategic Recommendations
Frequently Asked Questions About the Market Study (FAQs):
6Wresearch actively monitors the Brunei Eco-Friendly Straws Market and publishes its comprehensive annual report, highlighting emerging trends, growth drivers, revenue analysis, and forecast outlook. Our insights help businesses to make data-backed strategic decisions with ongoing market dynamics. Our analysts track relevent industries related to the Brunei Eco-Friendly Straws Market, allowing our clients with actionable intelligence and reliable forecasts tailored to emerging regional needs.
Yes, we provide customisation as per your requirements. To learn more, feel free to contact us on sales@6wresearch.com
1 Executive Summary |
2 Introduction |
2.1 Key Highlights of the Report |
2.2 Report Description |
2.3 Market Scope & Segmentation |
2.4 Research Methodology |
2.5 Assumptions |
3 Brunei Eco-Friendly Straws Market Overview |
3.1 Brunei Country Macro Economic Indicators |
3.2 Brunei Eco-Friendly Straws Market Revenues & Volume, 2022 & 2032F |
3.3 Brunei Eco-Friendly Straws Market - Industry Life Cycle |
3.4 Brunei Eco-Friendly Straws Market - Porter's Five Forces |
3.5 Brunei Eco-Friendly Straws Market Revenues & Volume Share, By Product Type, 2022 & 2032F |
3.6 Brunei Eco-Friendly Straws Market Revenues & Volume Share, By Material, 2022 & 2032F |
3.7 Brunei Eco-Friendly Straws Market Revenues & Volume Share, By Straw Width/Diameter, 2022 & 2032F |
3.8 Brunei Eco-Friendly Straws Market Revenues & Volume Share, By End-Use, 2022 & 2032F |
3.9 Brunei Eco-Friendly Straws Market Revenues & Volume Share, By Distribution Channel, 2022 & 2032F |
4 Brunei Eco-Friendly Straws Market Dynamics |
4.1 Impact Analysis |
4.2 Market Drivers |
4.2.1 Increasing awareness about environmental issues and the harmful effects of plastic straws |
4.2.2 Government regulations promoting the use of eco-friendly alternatives |
4.2.3 Growing trend of sustainable living and eco-conscious consumer behavior |
4.3 Market Restraints |
4.3.1 Higher initial cost of eco-friendly straws compared to traditional plastic straws |
4.3.2 Limited availability and accessibility of eco-friendly straw options in the market |
4.3.3 Lack of awareness among consumers about the availability and benefits of eco-friendly straws |
5 Brunei Eco-Friendly Straws Market Trends |
6 Brunei Eco-Friendly Straws Market, By Types |
6.1 Brunei Eco-Friendly Straws Market, By Product Type |
6.1.1 Overview and Analysis |
6.1.2 Brunei Eco-Friendly Straws Market Revenues & Volume, By Product Type, 2022 - 2032F |
6.1.3 Brunei Eco-Friendly Straws Market Revenues & Volume, By Straight Straw, 2022 - 2032F |
6.1.4 Brunei Eco-Friendly Straws Market Revenues & Volume, By Printed, 2022 - 2032F |
6.1.5 Brunei Eco-Friendly Straws Market Revenues & Volume, By Non-printed, 2022 - 2032F |
6.1.6 Brunei Eco-Friendly Straws Market Revenues & Volume, By Flexible Straw, 2022 - 2032F |
6.2 Brunei Eco-Friendly Straws Market, By Material |
6.2.1 Overview and Analysis |
6.2.2 Brunei Eco-Friendly Straws Market Revenues & Volume, By Paper, 2022 - 2032F |
6.2.3 Brunei Eco-Friendly Straws Market Revenues & Volume, By Virgin Craft Paper, 2022 - 2032F |
6.2.4 Brunei Eco-Friendly Straws Market Revenues & Volume, By Recycled Paper, 2022 - 2032F |
6.2.5 Brunei Eco-Friendly Straws Market Revenues & Volume, By Pasta, 2022 - 2032F |
6.2.6 Brunei Eco-Friendly Straws Market Revenues & Volume, By Glass, 2022 - 2032F |
6.2.7 Brunei Eco-Friendly Straws Market Revenues & Volume, By Bamboo, 2022 - 2032F |
6.3 Brunei Eco-Friendly Straws Market, By Straw Width/Diameter |
6.3.1 Overview and Analysis |
6.3.2 Brunei Eco-Friendly Straws Market Revenues & Volume, By |
6.3.3 Brunei Eco-Friendly Straws Market Revenues & Volume, By 7-10 mm, 2022 - 2032F |
6.3.4 Brunei Eco-Friendly Straws Market Revenues & Volume, By 10-15 mm, 2022 - 2032F |
6.3.5 Brunei Eco-Friendly Straws Market Revenues & Volume, By > 15 mm, 2022 - 2032F |
6.4 Brunei Eco-Friendly Straws Market, By End-Use |
6.4.1 Overview and Analysis |
6.4.2 Brunei Eco-Friendly Straws Market Revenues & Volume, By Food Service, 2022 - 2032F |
6.4.3 Brunei Eco-Friendly Straws Market Revenues & Volume, By Hotels & Logistics, 2022 - 2032F |
6.4.4 Brunei Eco-Friendly Straws Market Revenues & Volume, By Bars & Lounges, 2022 - 2032F |
6.4.5 Brunei Eco-Friendly Straws Market Revenues & Volume, By Cafes & Fast Food Outlets, 2022 - 2032F |
6.4.6 Brunei Eco-Friendly Straws Market Revenues & Volume, By Cinemas, 2022 - 2032F |
6.4.7 Brunei Eco-Friendly Straws Market Revenues & Volume, By Airline & Railway Catering, 2022 - 2032F |
6.4.8 Brunei Eco-Friendly Straws Market Revenues & Volume, By Educational, 2022 - 2032F |
6.4.9 Brunei Eco-Friendly Straws Market Revenues & Volume, By Educational, 2022 - 2032F |
6.5 Brunei Eco-Friendly Straws Market, By Distribution Channel |
6.5.1 Overview and Analysis |
6.5.2 Brunei Eco-Friendly Straws Market Revenues & Volume, By Manufacturers (Direct Sales), 2022 - 2032F |
6.5.3 Brunei Eco-Friendly Straws Market Revenues & Volume, By Distributors, 2022 - 2032F |
6.5.4 Brunei Eco-Friendly Straws Market Revenues & Volume, By Retailers, 2022 - 2032F |
6.5.5 Brunei Eco-Friendly Straws Market Revenues & Volume, By Hypermarkets, 2022 - 2032F |
6.5.6 Brunei Eco-Friendly Straws Market Revenues & Volume, By Supermarkets, 2022 - 2032F |
6.5.7 Brunei Eco-Friendly Straws Market Revenues & Volume, By Convenience Stores, 2022 - 2032F |
7 Brunei Eco-Friendly Straws Market Import-Export Trade Statistics |
7.1 Brunei Eco-Friendly Straws Market Export to Major Countries |
7.2 Brunei Eco-Friendly Straws Market Imports from Major Countries |
8 Brunei Eco-Friendly Straws Market Key Performance Indicators |
8.1 Percentage increase in the use of eco-friendly straws in Brunei over time |
8.2 Number of businesses and restaurants adopting eco-friendly straw options |
8.3 Consumer awareness levels regarding the environmental impact of plastic straws and the benefits of using eco-friendly alternatives |
9 Brunei Eco-Friendly Straws Market - Opportunity Assessment |
9.1 Brunei Eco-Friendly Straws Market Opportunity Assessment, By Product Type, 2022 & 2032F |
9.2 Brunei Eco-Friendly Straws Market Opportunity Assessment, By Material, 2022 & 2032F |
9.3 Brunei Eco-Friendly Straws Market Opportunity Assessment, By Straw Width/Diameter, 2022 & 2032F |
9.4 Brunei Eco-Friendly Straws Market Opportunity Assessment, By End-Use, 2022 & 2032F |
9.5 Brunei Eco-Friendly Straws Market Opportunity Assessment, By Distribution Channel, 2022 & 2032F |
10 Brunei Eco-Friendly Straws Market - Competitive Landscape |
10.1 Brunei Eco-Friendly Straws Market Revenue Share, By Companies, 2025 |
10.2 Brunei Eco-Friendly Straws Market Competitive Benchmarking, By Operating and Technical Parameters |
11 Company Profiles |
12 Recommendations |
13 Disclaimer |
Global Go To Market Strategy - 2030
Export potential enables firms to identify high-growth global markets with greater confidence by combining advanced trade intelligence with a structured quantitative methodology. The framework analyzes emerging demand trends and country-level import patterns while integrating macroeconomic and trade datasets such as GDP and population forecasts, bilateral import–export flows, tariff structures, elasticity differentials between developed and developing economies, geographic distance, and import demand projections. Using weighted trade values from 2020–2024 as the base period to project country-to-country export potential for 2030, these inputs are operationalized through calculated drivers such as gravity model parameters, tariff impact factors, and projected GDP per-capita growth. Through an analysis of hidden potentials, demand hotspots, and market conditions that are most favorable to success, this method enables firms to focus on target countries, maximize returns, and global expansion with data, backed by accuracy.
By factoring in the projected importer demand gap that is currently unmet and could be potential opportunity, it identifies the potential for the Exporter (Country) among 190 countries, against the general trade analysis, which identifies the biggest importer or exporter.
To discover high-growth global markets and optimize your business strategy:
Click Here
Pricing
- Single User License$ 1,995
- Department License$ 2,400
- Site License$ 3,120
- Global License$ 3,795

Leadership Perspectives from Industry Events
Search
Thought Leadership and Analyst Meet


Our Clients
6WResearch In News
- Doha a strategic location for EV manufacturing hub: IPA Qatar
- Demand for luxury TVs surging in the GCC, says Samsung
- Empowering Growth: The Thriving Journey of Bangladesh’s Cable Industry
- Demand for luxury TVs surging in the GCC, says Samsung
- Video call with a traditional healer? Once unthinkable, it’s now common in South Africa
- Intelligent Buildings To Smooth GCC’s Path To Net Zero
Latest Reports
- New Zealand Aseptic Manufacturing Market (2026-2032)
- Netherlands Aseptic Manufacturing Market (2026-2032)
- Nauru Aseptic Manufacturing Market (2026-2032)
- Namibia Aseptic Manufacturing Market (2026-2032)
- Mozambique Aseptic Manufacturing Market (2026-2032)
- Montenegro Aseptic Manufacturing Market (2026-2032)
- Mongolia Aseptic Manufacturing Market (2026-2032)
- Monaco Aseptic Manufacturing Market (2026-2032)
- Micronesia Aseptic Manufacturing Market (2026-2032)
- Mauritius Aseptic Manufacturing Market (2026-2032)
Industry Events and Analyst Meet

HIMTEX 2026

India Refining Summit 2026

India EV Show 2026

EV tech India Expo 2026

Auto Tech Asia 2026
Whitepaper
- Middle East & Africa Commercial Security Market Click here to view more.
- Middle East & Africa Fire Safety Systems & Equipment Market Click here to view more.
- GCC Drone Market Click here to view more.
- Middle East Lighting Fixture Market Click here to view more.
- GCC Physical & Perimeter Security Market Click here to view more.