Bulgaria Candy Market (2025-2031) | Growth, Share, Trends, Value, Companies, Revenue, Analysis, Size, Segmentation, Industry, Outlook & Forecast
Market Forecast By Product Type (Chocolate Candy, Non-Chocolate Candy), By Distribution (Supermarkets and Hypermarkets, Convenience Stores, Specialist Retailers, Online Retail, Others) And Competitive Landscape
| Product Code: ETC5378265 | Publication Date: Nov 2023 | Updated Date: Oct 2025 | Product Type: Market Research Report | |
| Publisher: 6Wresearch | Author: Bhawna Singh | No. of Pages: 60 | No. of Figures: 30 | No. of Tables: 5 |
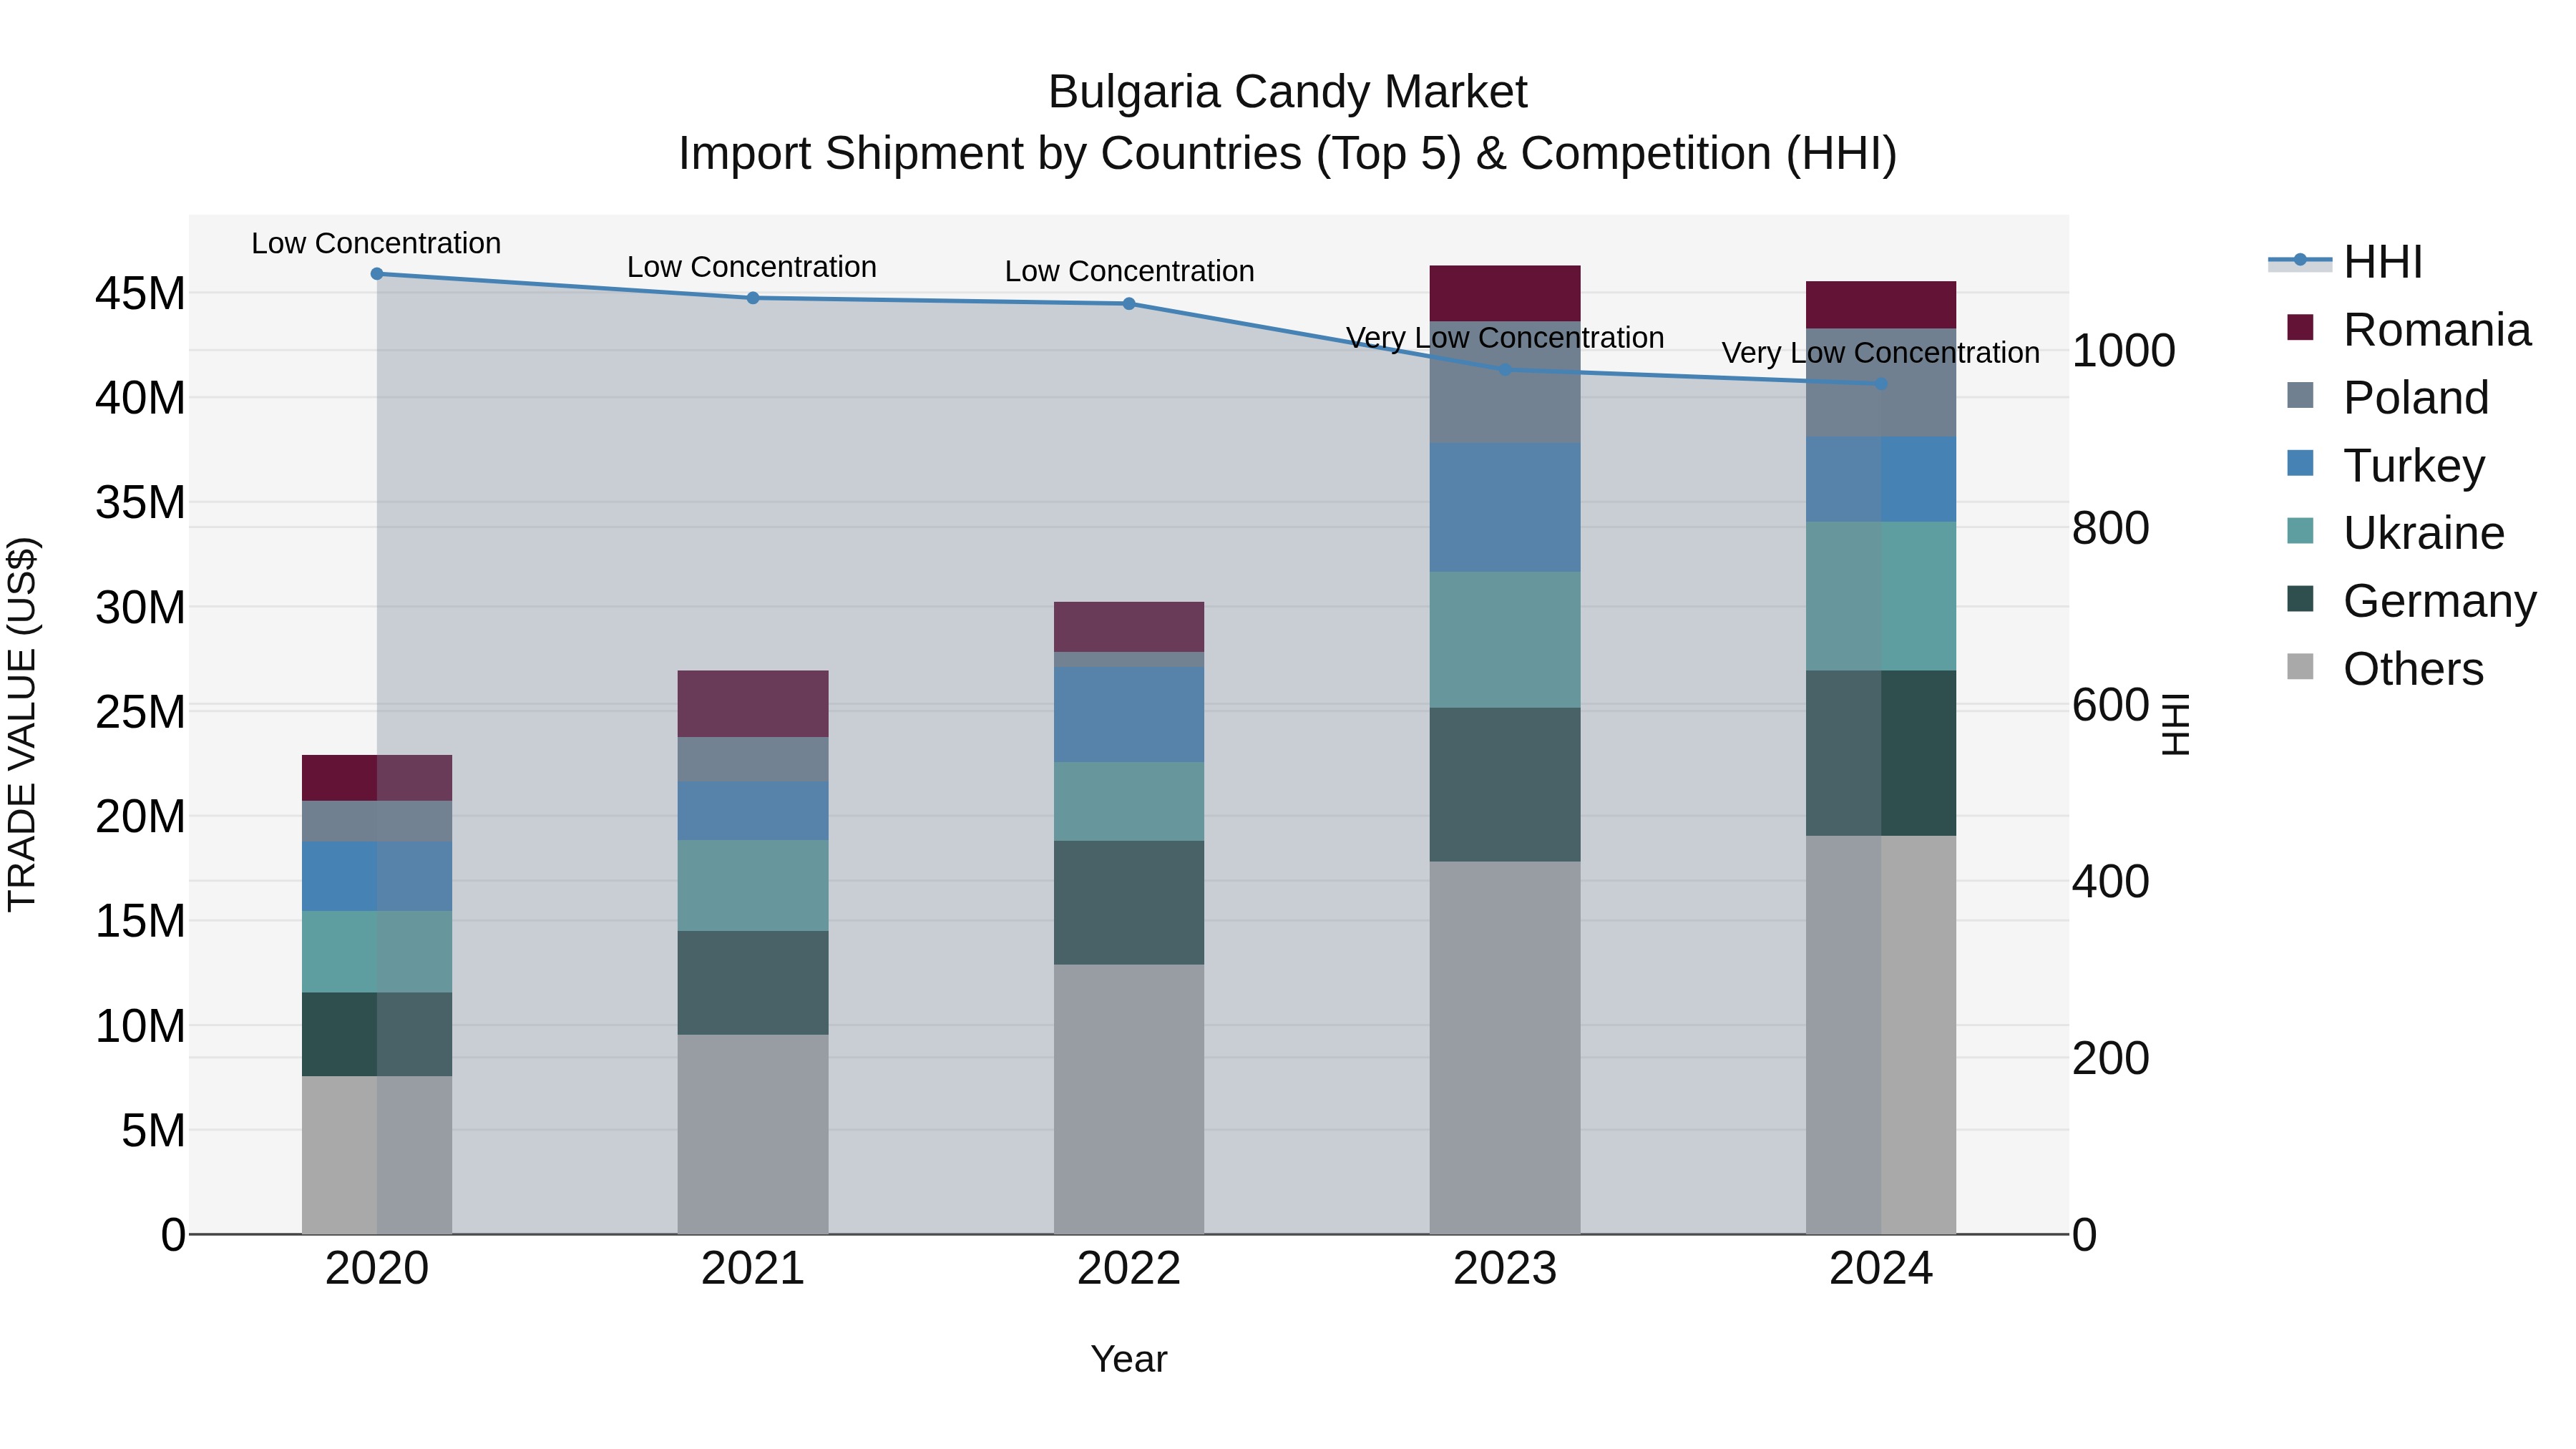
Bulgaria Candy Market Top 5 Importing Countries and Market Competition (HHI) Analysis
In 2024, Bulgaria continued to see a healthy growth in candy import shipments, with a notable CAGR of 18.74% from 2020 to 2024. Despite a slight decrease in growth rate from 2023 to 2024 at -1.64%, the Market Top 5 Importing Countries and Market Competition (HHI) Analysis remained stable. Top exporting countries like Germany, Ukraine, Poland, Turkey, and Hungary played a significant role in supplying candies to Bulgaria. With a low concentration level indicated by the Herfindahl-Hirschman Index (HHI), the Market Top 5 Importing Countries and Market Competition (HHI) Analysis appears to be diversified and open to various players, fostering competition and potentially benefiting consumers with a wide range of candy options.
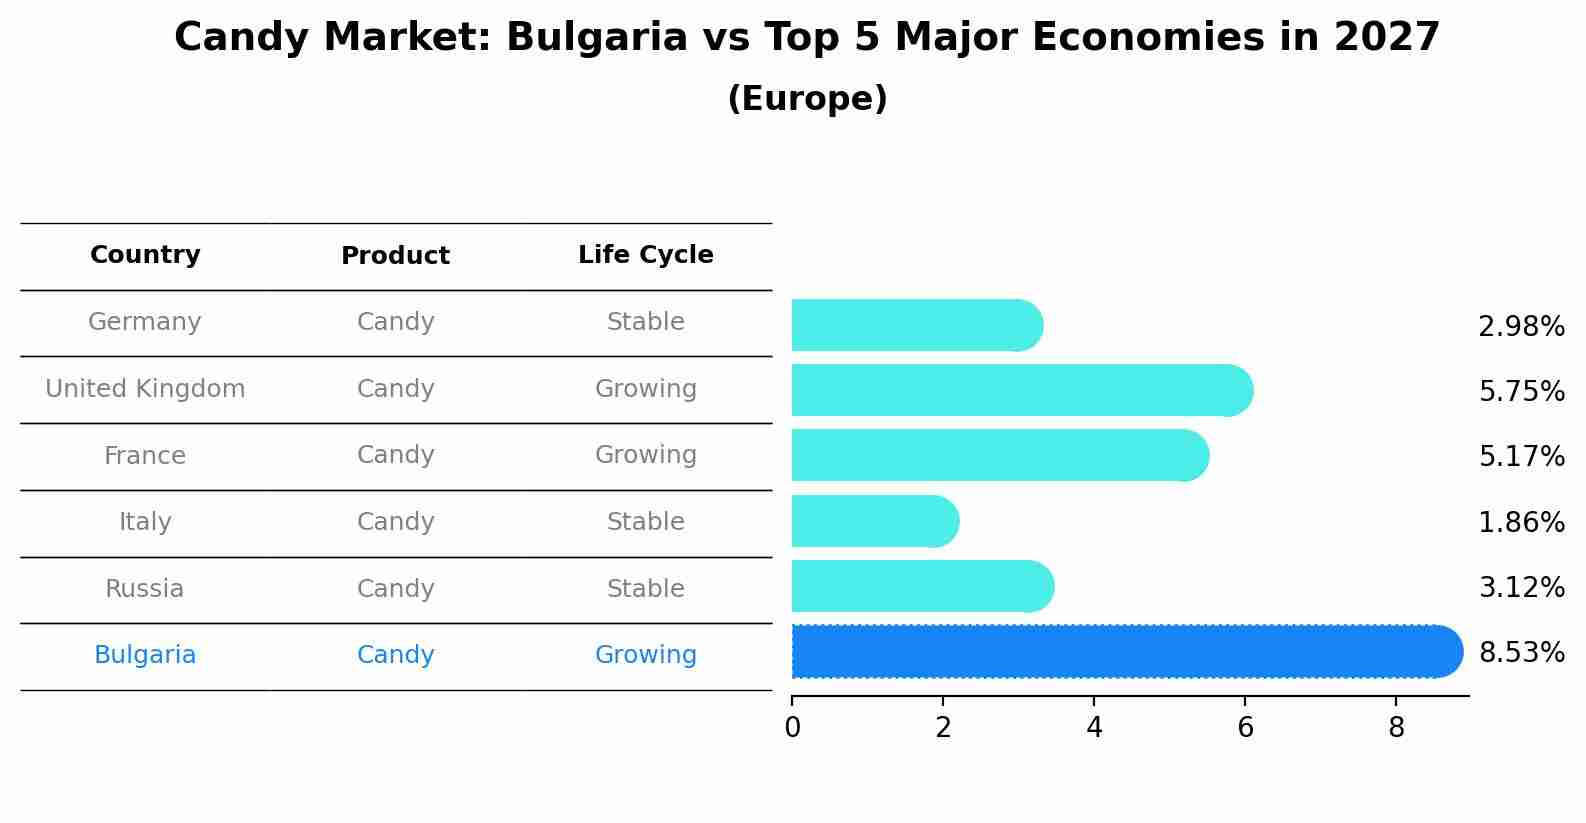
Candy Market: Bulgaria vs Top 5 Major Economies in 2027 (Europe)
The Candy market in Bulgaria is projected to grow at a growing growth rate of 8.53% by 2027, within the Europe region led by Germany, along with other countries like United Kingdom, France, Italy and Russia, collectively shaping a dynamic and evolving market environment driven by innovation and increasing adoption of emerging technologies.
Bulgaria Candy Market Overview
The candy market in Bulgaria is a dynamic and competitive sector, with a wide range of products catering to different age groups and preferences. Traditional Bulgarian candies, along with international brands, are popular. The market is driven by innovations in flavors and packaging, as well as seasonal demand during holidays and festive seasons.
Drivers of the market
The candy market in Bulgaria is influenced by consumer preferences for sweet treats and confectionery products. The rise in disposable incomes and the availability of diverse candy options drive the market`s growth. Additionally, innovations in candy flavors, packaging, and marketing strategies contribute to the expanding market for candy.
Challenges of the market
The Bulgaria Candy Market is challenged by increasing health consciousness among consumers, leading to a shift in demand towards healthier alternatives. Additionally, fluctuations in the prices of raw materials, such as sugar and cocoa, can impact production costs. The market also faces competition from other snack products.
Government Policy of the market
In Bulgaria, the candy market is regulated to ensure product safety and quality. The government enforces standards for ingredients, labeling, and production practices to protect consumer health and ensure that products meet safety regulations.
Key Highlights of the Report:
- Bulgaria Candy Market Outlook
- Market Size of Bulgaria Candy Market, 2024
- Forecast of Bulgaria Candy Market, 2031
- Historical Data and Forecast of Bulgaria Candy Revenues & Volume for the Period 2021-2031
- Bulgaria Candy Market Trend Evolution
- Bulgaria Candy Market Drivers and Challenges
- Bulgaria Candy Price Trends
- Bulgaria Candy Porter`s Five Forces
- Bulgaria Candy Industry Life Cycle
- Historical Data and Forecast of Bulgaria Candy Market Revenues & Volume By Product Type for the Period 2021-2031
- Historical Data and Forecast of Bulgaria Candy Market Revenues & Volume By Chocolate Candy for the Period 2021-2031
- Historical Data and Forecast of Bulgaria Candy Market Revenues & Volume By Non-Chocolate Candy for the Period 2021-2031
- Historical Data and Forecast of Bulgaria Candy Market Revenues & Volume By Distribution for the Period 2021-2031
- Historical Data and Forecast of Bulgaria Candy Market Revenues & Volume By Supermarkets and Hypermarkets for the Period 2021-2031
- Historical Data and Forecast of Bulgaria Candy Market Revenues & Volume By Convenience Stores for the Period 2021-2031
- Historical Data and Forecast of Bulgaria Candy Market Revenues & Volume By Specialist Retailers for the Period 2021-2031
- Historical Data and Forecast of Bulgaria Candy Market Revenues & Volume By Online Retail for the Period 2021-2031
- Historical Data and Forecast of Bulgaria Candy Market Revenues & Volume By Others for the Period 2021-2031
- Bulgaria Candy Import Export Trade Statistics
- Market Opportunity Assessment By Product Type
- Market Opportunity Assessment By Distribution
- Bulgaria Candy Top Companies Market Share
- Bulgaria Candy Competitive Benchmarking By Technical and Operational Parameters
- Bulgaria Candy Company Profiles
- Bulgaria Candy Key Strategic Recommendations
Frequently Asked Questions About the Market Study (FAQs):
6Wresearch actively monitors the Bulgaria Candy Market and publishes its comprehensive annual report, highlighting emerging trends, growth drivers, revenue analysis, and forecast outlook. Our insights help businesses to make data-backed strategic decisions with ongoing market dynamics. Our analysts track relevent industries related to the Bulgaria Candy Market, allowing our clients with actionable intelligence and reliable forecasts tailored to emerging regional needs.
Yes, we provide customisation as per your requirements. To learn more, feel free to contact us on sales@6wresearch.com
1 Executive Summary |
2 Introduction |
2.1 Key Highlights of the Report |
2.2 Report Description |
2.3 Market Scope & Segmentation |
2.4 Research Methodology |
2.5 Assumptions |
3 Bulgaria Candy Market Overview |
3.1 Bulgaria Country Macro Economic Indicators |
3.2 Bulgaria Candy Market Revenues & Volume, 2021 & 2031F |
3.3 Bulgaria Candy Market - Industry Life Cycle |
3.4 Bulgaria Candy Market - Porter's Five Forces |
3.5 Bulgaria Candy Market Revenues & Volume Share, By Product Type, 2021 & 2031F |
3.6 Bulgaria Candy Market Revenues & Volume Share, By Distribution, 2021 & 2031F |
4 Bulgaria Candy Market Dynamics |
4.1 Impact Analysis |
4.2 Market Drivers |
4.2.1 Increasing disposable income of consumers in Bulgaria |
4.2.2 Growing trend of gifting candies on special occasions |
4.2.3 Expanding retail distribution channels for candies |
4.2.4 Rising demand for premium and artisanal candies |
4.2.5 Innovation in flavors and packaging of candies |
4.3 Market Restraints |
4.3.1 Health concerns related to excessive sugar consumption |
4.3.2 Competition from healthier snack options |
4.3.3 Fluctuating raw material prices impacting production costs |
4.3.4 Regulatory restrictions on certain ingredients in candies |
4.3.5 Economic uncertainty affecting consumer spending patterns |
5 Bulgaria Candy Market Trends |
6 Bulgaria Candy Market Segmentations |
6.1 Bulgaria Candy Market, By Product Type |
6.1.1 Overview and Analysis |
6.1.2 Bulgaria Candy Market Revenues & Volume, By Chocolate Candy, 2021-2031F |
6.1.3 Bulgaria Candy Market Revenues & Volume, By Non-Chocolate Candy, 2021-2031F |
6.2 Bulgaria Candy Market, By Distribution |
6.2.1 Overview and Analysis |
6.2.2 Bulgaria Candy Market Revenues & Volume, By Supermarkets and Hypermarkets, 2021-2031F |
6.2.3 Bulgaria Candy Market Revenues & Volume, By Convenience Stores, 2021-2031F |
6.2.4 Bulgaria Candy Market Revenues & Volume, By Specialist Retailers, 2021-2031F |
6.2.5 Bulgaria Candy Market Revenues & Volume, By Online Retail, 2021-2031F |
6.2.6 Bulgaria Candy Market Revenues & Volume, By Others, 2021-2031F |
7 Bulgaria Candy Market Import-Export Trade Statistics |
7.1 Bulgaria Candy Market Export to Major Countries |
7.2 Bulgaria Candy Market Imports from Major Countries |
8 Bulgaria Candy Market Key Performance Indicators |
8.1 Consumer engagement on social media platforms for candy brands |
8.2 Number of new product launches in the candy market |
8.3 Growth in online sales of candies |
8.4 Customer satisfaction and loyalty metrics for candy brands |
8.5 Participation in candy industry events and trade shows |
9 Bulgaria Candy Market - Opportunity Assessment |
9.1 Bulgaria Candy Market Opportunity Assessment, By Product Type, 2021 & 2031F |
9.2 Bulgaria Candy Market Opportunity Assessment, By Distribution, 2021 & 2031F |
10 Bulgaria Candy Market - Competitive Landscape |
10.1 Bulgaria Candy Market Revenue Share, By Companies, 2024 |
10.2 Bulgaria Candy Market Competitive Benchmarking, By Operating and Technical Parameters |
11 Company Profiles |
12 Recommendations | 13 Disclaimer |
Export potential assessment - trade Analytics for 2030
Export potential enables firms to identify high-growth global markets with greater confidence by combining advanced trade intelligence with a structured quantitative methodology. The framework analyzes emerging demand trends and country-level import patterns while integrating macroeconomic and trade datasets such as GDP and population forecasts, bilateral import–export flows, tariff structures, elasticity differentials between developed and developing economies, geographic distance, and import demand projections. Using weighted trade values from 2020–2024 as the base period to project country-to-country export potential for 2030, these inputs are operationalized through calculated drivers such as gravity model parameters, tariff impact factors, and projected GDP per-capita growth. Through an analysis of hidden potentials, demand hotspots, and market conditions that are most favorable to success, this method enables firms to focus on target countries, maximize returns, and global expansion with data, backed by accuracy.
By factoring in the projected importer demand gap that is currently unmet and could be potential opportunity, it identifies the potential for the Exporter (Country) among 190 countries, against the general trade analysis, which identifies the biggest importer or exporter.
To discover high-growth global markets and optimize your business strategy:
Click Here
Pricing
- Single User License$ 1,995
- Department License$ 2,400
- Site License$ 3,120
- Global License$ 3,795

Search
Thought Leadership and Analyst Meet


Our Clients
Related Reports
- Pakistan Contraceptive Implants Market (2025-2031) | Demand, Growth, Size, Share, Industry, Pricing Analysis, Competitive, Strategic Insights, Strategy, Consumer Insights, Analysis, Investment Trends, Opportunities, Revenue, Segments, Value, Segmentation, Supply, Forecast, Restraints, Outlook, Competition, Drivers, Trends, Companies, Challenges
- Sri Lanka Packaging Market (2026-2032) | Outlook, Competition, Drivers, Trends, Demand, Pricing Analysis, Competitive, Strategic Insights, Companies, Challenges, Strategy, Consumer Insights, Analysis, Investment Trends, Opportunities, Growth, Size, Share, Industry, Revenue, Segments, Value, Segmentation, Supply, Forecast, Restraints
- India Kids Watches Market (2026-2032) | Strategy, Consumer Insights, Analysis, Investment Trends, Opportunities, Growth, Size, Share, Industry, Revenue, Segments, Value, Segmentation, Supply, Forecast, Restraints, Outlook, Competition, Drivers, Trends, Demand, Pricing Analysis, Competitive, Strategic Insights, Companies, Challenges
- Saudi Arabia Core Assurance Service Market (2025-2031) | Strategy, Consumer Insights, Analysis, Investment Trends, Opportunities, Growth, Size, Share, Industry, Revenue, Segments, Value, Segmentation, Supply, Forecast, Restraints, Outlook, Competition, Drivers, Trends, Demand, Pricing Analysis, Competitive, Strategic Insights, Companies, Challenges
- Romania Uninterruptible Power Supply (UPS) Market (2026-2032) | Industry, Analysis, Revenue, Size, Forecast, Outlook, Value, Trends, Share, Growth & Companies
- Saudi Arabia Car Window Tinting Film, Paint Protection Film (PPF), and Ceramic Coating Market (2025-2031) | Strategy, Consumer Insights, Analysis, Investment Trends, Opportunities, Growth, Size, Share, Industry, Revenue, Segments, Value, Segmentation, Supply, Forecast, Restraints, Outlook, Competition, Drivers, Trends, Demand, Pricing Analysis, Competitive, Strategic Insights, Companies, Challenges
- South Africa Stationery Market (2025-2031) | Share, Size, Industry, Value, Growth, Revenue, Analysis, Trends, Segmentation & Outlook
- Afghanistan Rocking Chairs And Adirondack Chairs Market (2026-2032) | Size & Revenue, Competitive Landscape, Share, Segmentation, Industry, Value, Outlook, Analysis, Trends, Growth, Forecast, Companies
- Afghanistan Apparel Market (2026-2032) | Growth, Outlook, Industry, Segmentation, Forecast, Size, Companies, Trends, Value, Share, Analysis & Revenue
- Canada Oil and Gas Market (2026-2032) | Share, Segmentation, Value, Industry, Trends, Forecast, Analysis, Size & Revenue, Growth, Competitive Landscape, Outlook, Companies
Industry Events and Analyst Meet

Smart Production Solutions Guangzhou 2026

Stationery & Paper Expo Saudi Arabia 2026

Kids & Toys Expo Saudi Arabia 2026

Gifts & Homeware Expo Saudi Arabia 2026

Smart Home Expo 2026
Whitepaper
- Middle East & Africa Commercial Security Market Click here to view more.
- Middle East & Africa Fire Safety Systems & Equipment Market Click here to view more.
- GCC Drone Market Click here to view more.
- Middle East Lighting Fixture Market Click here to view more.
- GCC Physical & Perimeter Security Market Click here to view more.
6WResearch In News
- Doha a strategic location for EV manufacturing hub: IPA Qatar
- Demand for luxury TVs surging in the GCC, says Samsung
- Empowering Growth: The Thriving Journey of Bangladesh’s Cable Industry
- Demand for luxury TVs surging in the GCC, says Samsung
- Video call with a traditional healer? Once unthinkable, it’s now common in South Africa
- Intelligent Buildings To Smooth GCC’s Path To Net Zero