Burundi Polyphenol Market (2025-2031) | Companies, Share, Revenue, Value, Industry, Trends, Outlook, Size, Analysis, Growth, Segmentation & Forecast
Market Forecast By Product Type (Apple, Green Tea, Grape Seeds, Others), By Type (Flavonoid, Resveratrol, Phenolic Acid, Lignin), By Application (Functional Beverages, Functional Foods, Dietary Supplements, Others) And Competitive Landscape
| Product Code: ETC5308309 | Publication Date: Nov 2023 | Updated Date: Oct 2025 | Product Type: Market Research Report | |
| Publisher: 6Wresearch | Author: Bhawna Singh | No. of Pages: 60 | No. of Figures: 30 | No. of Tables: 5 |
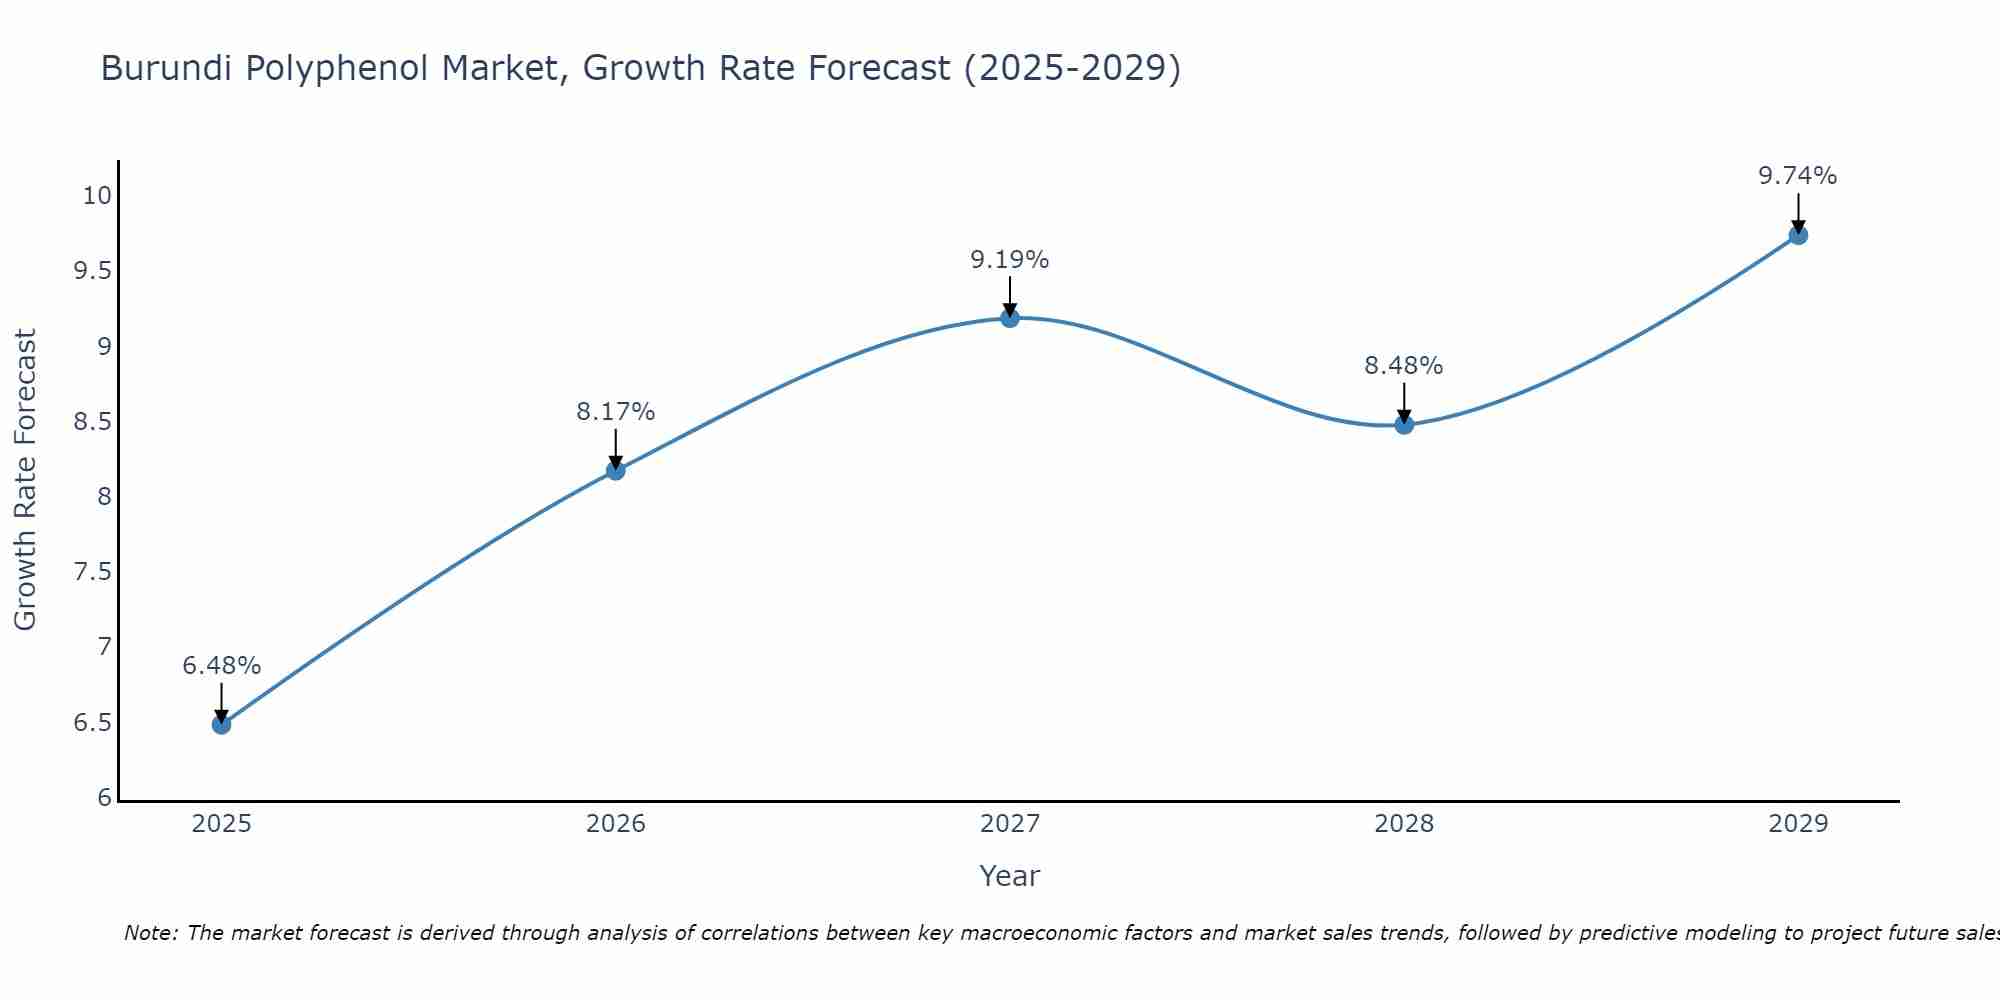
Burundi Polyphenol Market Size Growth Rate
The Burundi Polyphenol Market is projected to witness mixed growth rate patterns during 2025 to 2029. From 6.48% in 2025, the growth rate steadily ascends to 9.74% in 2029.
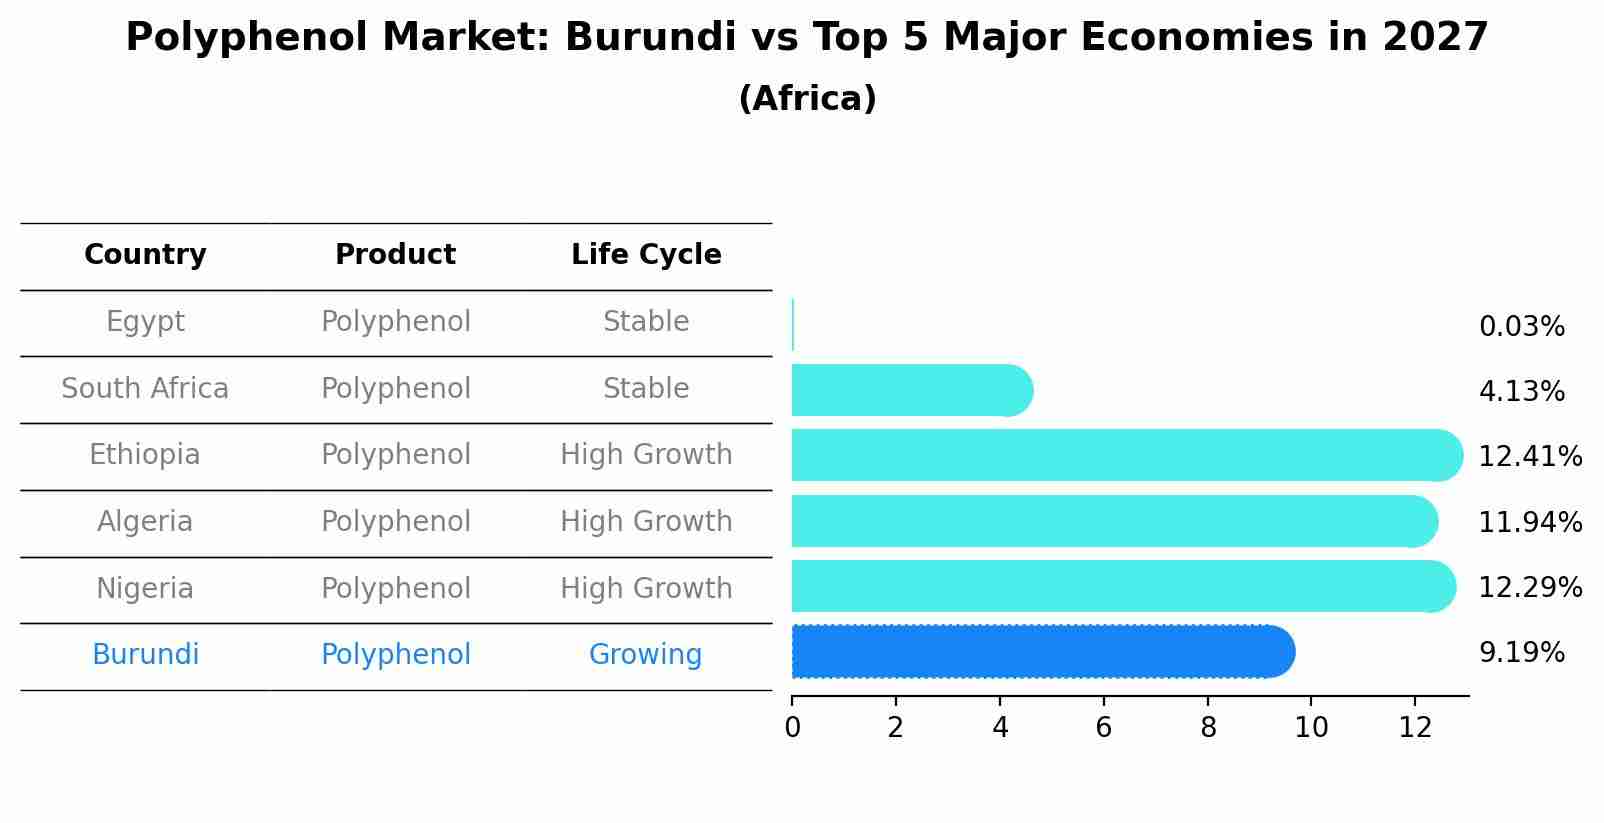
Polyphenol Market: Burundi vs Top 5 Major Economies in 2027 (Africa)
Burundi's Polyphenol market is anticipated to experience a growing growth rate of 9.19% by 2027, reflecting trends observed in the largest economy Egypt, followed by South Africa, Ethiopia, Algeria and Nigeria.
Burundi Polyphenol Market Overview
The Polyphenol market in Burundi is expanding due to the use of polyphenols in pharmaceuticals, cosmetics, and food and beverages. Polyphenols are known for their antioxidant properties and health benefits. The market is driven by growing consumer awareness of health and wellness. As the demand for natural and functional ingredients increases, the polyphenol market in Burundi is expected to grow.
Drivers of the market
The polyphenol market in Burundi is influenced by the demand for these compounds in various applications, including pharmaceuticals, cosmetics, and food and beverages. Polyphenols are valued for their antioxidant properties and health benefits. The growth of the pharmaceuticals and cosmetics industries, coupled with increasing consumer awareness of health and wellness, is driving market growth. Additionally, advancements in polyphenol extraction technologies and the rising focus on natural and functional ingredients are contributing to market expansion.
Challenges of the market
The Polyphenol market in Burundi faces difficulties such as high costs of imported polyphenols and limited local production capabilities. There is also a lack of local suppliers and distributors for polyphenol products. Market growth is further hindered by fluctuating demand and competition from alternative polyphenol solutions.
Government Policy of the market
Burundi`s polyphenol market may be influenced by government policies on health and wellness industries. As the government promotes the development of the nutraceutical and functional food sectors, there could be growing demand for polyphenols used in dietary supplements, beverages, and cosmetics.
Key Highlights of the Report:
- Burundi Polyphenol Market Outlook
- Market Size of Burundi Polyphenol Market, 2024
- Forecast of Burundi Polyphenol Market, 2031
- Historical Data and Forecast of Burundi Polyphenol Revenues & Volume for the Period 2021-2031
- Burundi Polyphenol Market Trend Evolution
- Burundi Polyphenol Market Drivers and Challenges
- Burundi Polyphenol Price Trends
- Burundi Polyphenol Porter`s Five Forces
- Burundi Polyphenol Industry Life Cycle
- Historical Data and Forecast of Burundi Polyphenol Market Revenues & Volume By Product Type for the Period 2021-2031
- Historical Data and Forecast of Burundi Polyphenol Market Revenues & Volume By Apple for the Period 2021-2031
- Historical Data and Forecast of Burundi Polyphenol Market Revenues & Volume By Green Tea for the Period 2021-2031
- Historical Data and Forecast of Burundi Polyphenol Market Revenues & Volume By Grape Seeds for the Period 2021-2031
- Historical Data and Forecast of Burundi Polyphenol Market Revenues & Volume By Others for the Period 2021-2031
- Historical Data and Forecast of Burundi Polyphenol Market Revenues & Volume By Type for the Period 2021-2031
- Historical Data and Forecast of Burundi Polyphenol Market Revenues & Volume By Flavonoid for the Period 2021-2031
- Historical Data and Forecast of Burundi Polyphenol Market Revenues & Volume By Resveratrol for the Period 2021-2031
- Historical Data and Forecast of Burundi Polyphenol Market Revenues & Volume By Phenolic Acid for the Period 2021-2031
- Historical Data and Forecast of Burundi Polyphenol Market Revenues & Volume By Lignin for the Period 2021-2031
- Historical Data and Forecast of Burundi Polyphenol Market Revenues & Volume By Application for the Period 2021-2031
- Historical Data and Forecast of Burundi Polyphenol Market Revenues & Volume By Functional Beverages for the Period 2021-2031
- Historical Data and Forecast of Burundi Polyphenol Market Revenues & Volume By Functional Foods for the Period 2021-2031
- Historical Data and Forecast of Burundi Polyphenol Market Revenues & Volume By Dietary Supplements for the Period 2021-2031
- Historical Data and Forecast of Burundi Polyphenol Market Revenues & Volume By Others for the Period 2021-2031
- Burundi Polyphenol Import Export Trade Statistics
- Market Opportunity Assessment By Product Type
- Market Opportunity Assessment By Type
- Market Opportunity Assessment By Application
- Burundi Polyphenol Top Companies Market Share
- Burundi Polyphenol Competitive Benchmarking By Technical and Operational Parameters
- Burundi Polyphenol Company Profiles
- Burundi Polyphenol Key Strategic Recommendations
Frequently Asked Questions About the Market Study (FAQs):
6Wresearch actively monitors the Burundi Polyphenol Market and publishes its comprehensive annual report, highlighting emerging trends, growth drivers, revenue analysis, and forecast outlook. Our insights help businesses to make data-backed strategic decisions with ongoing market dynamics. Our analysts track relevent industries related to the Burundi Polyphenol Market, allowing our clients with actionable intelligence and reliable forecasts tailored to emerging regional needs.
Yes, we provide customisation as per your requirements. To learn more, feel free to contact us on sales@6wresearch.com
1 Executive Summary |
2 Introduction |
2.1 Key Highlights of the Report |
2.2 Report Description |
2.3 Market Scope & Segmentation |
2.4 Research Methodology |
2.5 Assumptions |
3 Burundi Polyphenol Market Overview |
3.1 Burundi Country Macro Economic Indicators |
3.2 Burundi Polyphenol Market Revenues & Volume, 2021 & 2031F |
3.3 Burundi Polyphenol Market - Industry Life Cycle |
3.4 Burundi Polyphenol Market - Porter's Five Forces |
3.5 Burundi Polyphenol Market Revenues & Volume Share, By Product Type, 2021 & 2031F |
3.6 Burundi Polyphenol Market Revenues & Volume Share, By Type, 2021 & 2031F |
3.7 Burundi Polyphenol Market Revenues & Volume Share, By Application, 2021 & 2031F |
4 Burundi Polyphenol Market Dynamics |
4.1 Impact Analysis |
4.2 Market Drivers |
4.2.1 Growing awareness about health benefits of polyphenols |
4.2.2 Increasing demand for natural and plant-based products |
4.2.3 Rising prevalence of lifestyle diseases leading to a focus on preventive healthcare |
4.3 Market Restraints |
4.3.1 Limited availability of raw materials for polyphenol extraction |
4.3.2 Lack of standardized quality control measures |
4.3.3 High production costs associated with polyphenol extraction and processing |
5 Burundi Polyphenol Market Trends |
6 Burundi Polyphenol Market Segmentations |
6.1 Burundi Polyphenol Market, By Product Type |
6.1.1 Overview and Analysis |
6.1.2 Burundi Polyphenol Market Revenues & Volume, By Apple, 2021-2031F |
6.1.3 Burundi Polyphenol Market Revenues & Volume, By Green Tea, 2021-2031F |
6.1.4 Burundi Polyphenol Market Revenues & Volume, By Grape Seeds, 2021-2031F |
6.1.5 Burundi Polyphenol Market Revenues & Volume, By Others, 2021-2031F |
6.2 Burundi Polyphenol Market, By Type |
6.2.1 Overview and Analysis |
6.2.2 Burundi Polyphenol Market Revenues & Volume, By Flavonoid, 2021-2031F |
6.2.3 Burundi Polyphenol Market Revenues & Volume, By Resveratrol, 2021-2031F |
6.2.4 Burundi Polyphenol Market Revenues & Volume, By Phenolic Acid, 2021-2031F |
6.2.5 Burundi Polyphenol Market Revenues & Volume, By Lignin, 2021-2031F |
6.3 Burundi Polyphenol Market, By Application |
6.3.1 Overview and Analysis |
6.3.2 Burundi Polyphenol Market Revenues & Volume, By Functional Beverages, 2021-2031F |
6.3.3 Burundi Polyphenol Market Revenues & Volume, By Functional Foods, 2021-2031F |
6.3.4 Burundi Polyphenol Market Revenues & Volume, By Dietary Supplements, 2021-2031F |
6.3.5 Burundi Polyphenol Market Revenues & Volume, By Others, 2021-2031F |
7 Burundi Polyphenol Market Import-Export Trade Statistics |
7.1 Burundi Polyphenol Market Export to Major Countries |
7.2 Burundi Polyphenol Market Imports from Major Countries |
8 Burundi Polyphenol Market Key Performance Indicators |
8.1 Research and development investment in new polyphenol extraction techniques |
8.2 Number of new product launches containing polyphenol ingredients |
8.3 Consumer surveys indicating awareness and preference for polyphenol-rich products |
8.4 Adoption rate of polyphenol supplements in the market |
9 Burundi Polyphenol Market - Opportunity Assessment |
9.1 Burundi Polyphenol Market Opportunity Assessment, By Product Type, 2021 & 2031F |
9.2 Burundi Polyphenol Market Opportunity Assessment, By Type, 2021 & 2031F |
9.3 Burundi Polyphenol Market Opportunity Assessment, By Application, 2021 & 2031F |
10 Burundi Polyphenol Market - Competitive Landscape |
10.1 Burundi Polyphenol Market Revenue Share, By Companies, 2024 |
10.2 Burundi Polyphenol Market Competitive Benchmarking, By Operating and Technical Parameters |
11 Company Profiles |
12 Recommendations | 13 Disclaimer |
Export potential assessment - trade Analytics for 2030
Export potential enables firms to identify high-growth global markets with greater confidence by combining advanced trade intelligence with a structured quantitative methodology. The framework analyzes emerging demand trends and country-level import patterns while integrating macroeconomic and trade datasets such as GDP and population forecasts, bilateral import–export flows, tariff structures, elasticity differentials between developed and developing economies, geographic distance, and import demand projections. Using weighted trade values from 2020–2024 as the base period to project country-to-country export potential for 2030, these inputs are operationalized through calculated drivers such as gravity model parameters, tariff impact factors, and projected GDP per-capita growth. Through an analysis of hidden potentials, demand hotspots, and market conditions that are most favorable to success, this method enables firms to focus on target countries, maximize returns, and global expansion with data, backed by accuracy.
By factoring in the projected importer demand gap that is currently unmet and could be potential opportunity, it identifies the potential for the Exporter (Country) among 190 countries, against the general trade analysis, which identifies the biggest importer or exporter.
To discover high-growth global markets and optimize your business strategy:
Click Here
Pricing
- Single User License$ 1,995
- Department License$ 2,400
- Site License$ 3,120
- Global License$ 3,795

Search
Thought Leadership and Analyst Meet


Our Clients
Latest Reports
- Philippines Polyhydroxybutyrate-co-Hydroxyvalerate Market (2026-2032) | Trends, Insights, Challenges, Restraints, Competition, Size, Value, Forecast, Pricing, Share, Outlook, Revenue, Investment Opportunities, Strategy, Drivers, Demand, Growth, segmentation, Analysis, Companies
- Peru Polyhydroxybutyrate-co-Hydroxyvalerate Market (2026-2032) | Growth, Demand, Challenges, Share, Trends, Analysis, Pricing, Investment Opportunities, Drivers, Value, Forecast, Competition, Size, Companies, Insights, Outlook, Restraints, segmentation, Revenue, Strategy
- Pakistan Polyhydroxybutyrate-co-Hydroxyvalerate Market (2026-2032) | Restraints, segmentation, Pricing, Forecast, Share, Strategy, Competition, Trends, Insights, Drivers, Challenges, Growth, Revenue, Outlook, Value, Investment Opportunities, Companies, Size, Analysis, Demand
- Oman Polyhydroxybutyrate-co-Hydroxyvalerate Market (2026-2032) | Drivers, segmentation, Insights, Competition, Pricing, Outlook, Size, Revenue, Challenges, Forecast, Analysis, Growth, Value, Share, Trends, Investment Opportunities, Strategy, Restraints, Companies, Demand
- Nigeria Polyhydroxybutyrate-co-Hydroxyvalerate Market (2026-2032) | Value, Investment Opportunities, Analysis, Revenue, Restraints, Pricing, Outlook, Competition, Demand, Growth, Forecast, Companies, Trends, Challenges, segmentation, Drivers, Insights, Share, Size, Strategy
- Nepal Polyhydroxybutyrate-co-Hydroxyvalerate Market (2026-2032) | Insights, Analysis, Drivers, Share, Revenue, Demand, segmentation, Investment Opportunities, Competition, Forecast, Growth, Pricing, Companies, Strategy, Trends, Restraints, Challenges, Outlook, Size, Value
- Myanmar Polyhydroxybutyrate-co-Hydroxyvalerate Market (2026-2032) | Outlook, Revenue, Strategy, Restraints, Drivers, segmentation, Share, Forecast, Competition, Insights, Growth, Pricing, Size, Demand, Value, Companies, Trends, Challenges, Investment Opportunities, Analysis
- Morocco Polyhydroxybutyrate-co-Hydroxyvalerate Market (2026-2032) | Outlook, Investment Opportunities, Restraints, Strategy, Forecast, Challenges, Drivers, Growth, Companies, segmentation, Trends, Size, Competition, Revenue, Demand, Insights, Share, Analysis, Value, Pricing
- Mexico Polyhydroxybutyrate-co-Hydroxyvalerate Market (2026-2032) | Size, Drivers, Outlook, Share, Strategy, Growth, Pricing, Challenges, Companies, Demand, Value, Investment Opportunities, Restraints, Trends, Forecast, segmentation, Analysis, Insights, Competition, Revenue
- Malaysia Polyhydroxybutyrate-co-Hydroxyvalerate Market (2026-2032) | Share, segmentation, Size, Companies, Analysis, Insights, Forecast, Value, Revenue, Drivers, Restraints, Challenges, Investment Opportunities, Trends, Competition, Strategy, Demand, Growth, Outlook, Pricing
Industry Events and Analyst Meet

HIMTEX 2026

India Refining Summit 2026

India EV Show 2026

EV tech India Expo 2026

Auto Tech Asia 2026
Whitepaper
- Middle East & Africa Commercial Security Market Click here to view more.
- Middle East & Africa Fire Safety Systems & Equipment Market Click here to view more.
- GCC Drone Market Click here to view more.
- Middle East Lighting Fixture Market Click here to view more.
- GCC Physical & Perimeter Security Market Click here to view more.
6WResearch In News
- Doha a strategic location for EV manufacturing hub: IPA Qatar
- Demand for luxury TVs surging in the GCC, says Samsung
- Empowering Growth: The Thriving Journey of Bangladesh’s Cable Industry
- Demand for luxury TVs surging in the GCC, says Samsung
- Video call with a traditional healer? Once unthinkable, it’s now common in South Africa
- Intelligent Buildings To Smooth GCC’s Path To Net Zero