Cambodia Energy Saving & Fluorescent Market (2026-2032) | Trends, Analysis, Share, Companies, Forecast, Industry, Revenue, Outlook, Value, Growth & Size
Market Forecast By Sources (High-Intensity Discharge Lamps (HID), Linear Fluorescent Lamps (LFL), Light Emitting Diodes (LED)), By Applications (Commercial, Residential, Government) And Competitive Landscape
| Product Code: ETC005093 | Publication Date: Sep 2020 | Updated Date: Jun 2026 | Product Type: Report | |
| Publisher: 6Wresearch | Author: Ravi Bhandari | No. of Pages: 70 | No. of Figures: 35 | No. of Tables: 5 |
Cambodia Energy Saving & Fluorescent Market Summary
The cambodia energy saving & fluorescent market was estimated at USD 1241 Million in 2025 and is projected to reach USD 1793 Million by 2032, growing at a CAGR of 6.6% from 2026 to 2032.
Cambodia Energy Saving & Fluorescent Market Year-wise Growth Rate and Key Drivers
This graph highlights how the Cambodia Energy Saving & Fluorescent Market has steadily grown over the past five years, supported by major growth factors.
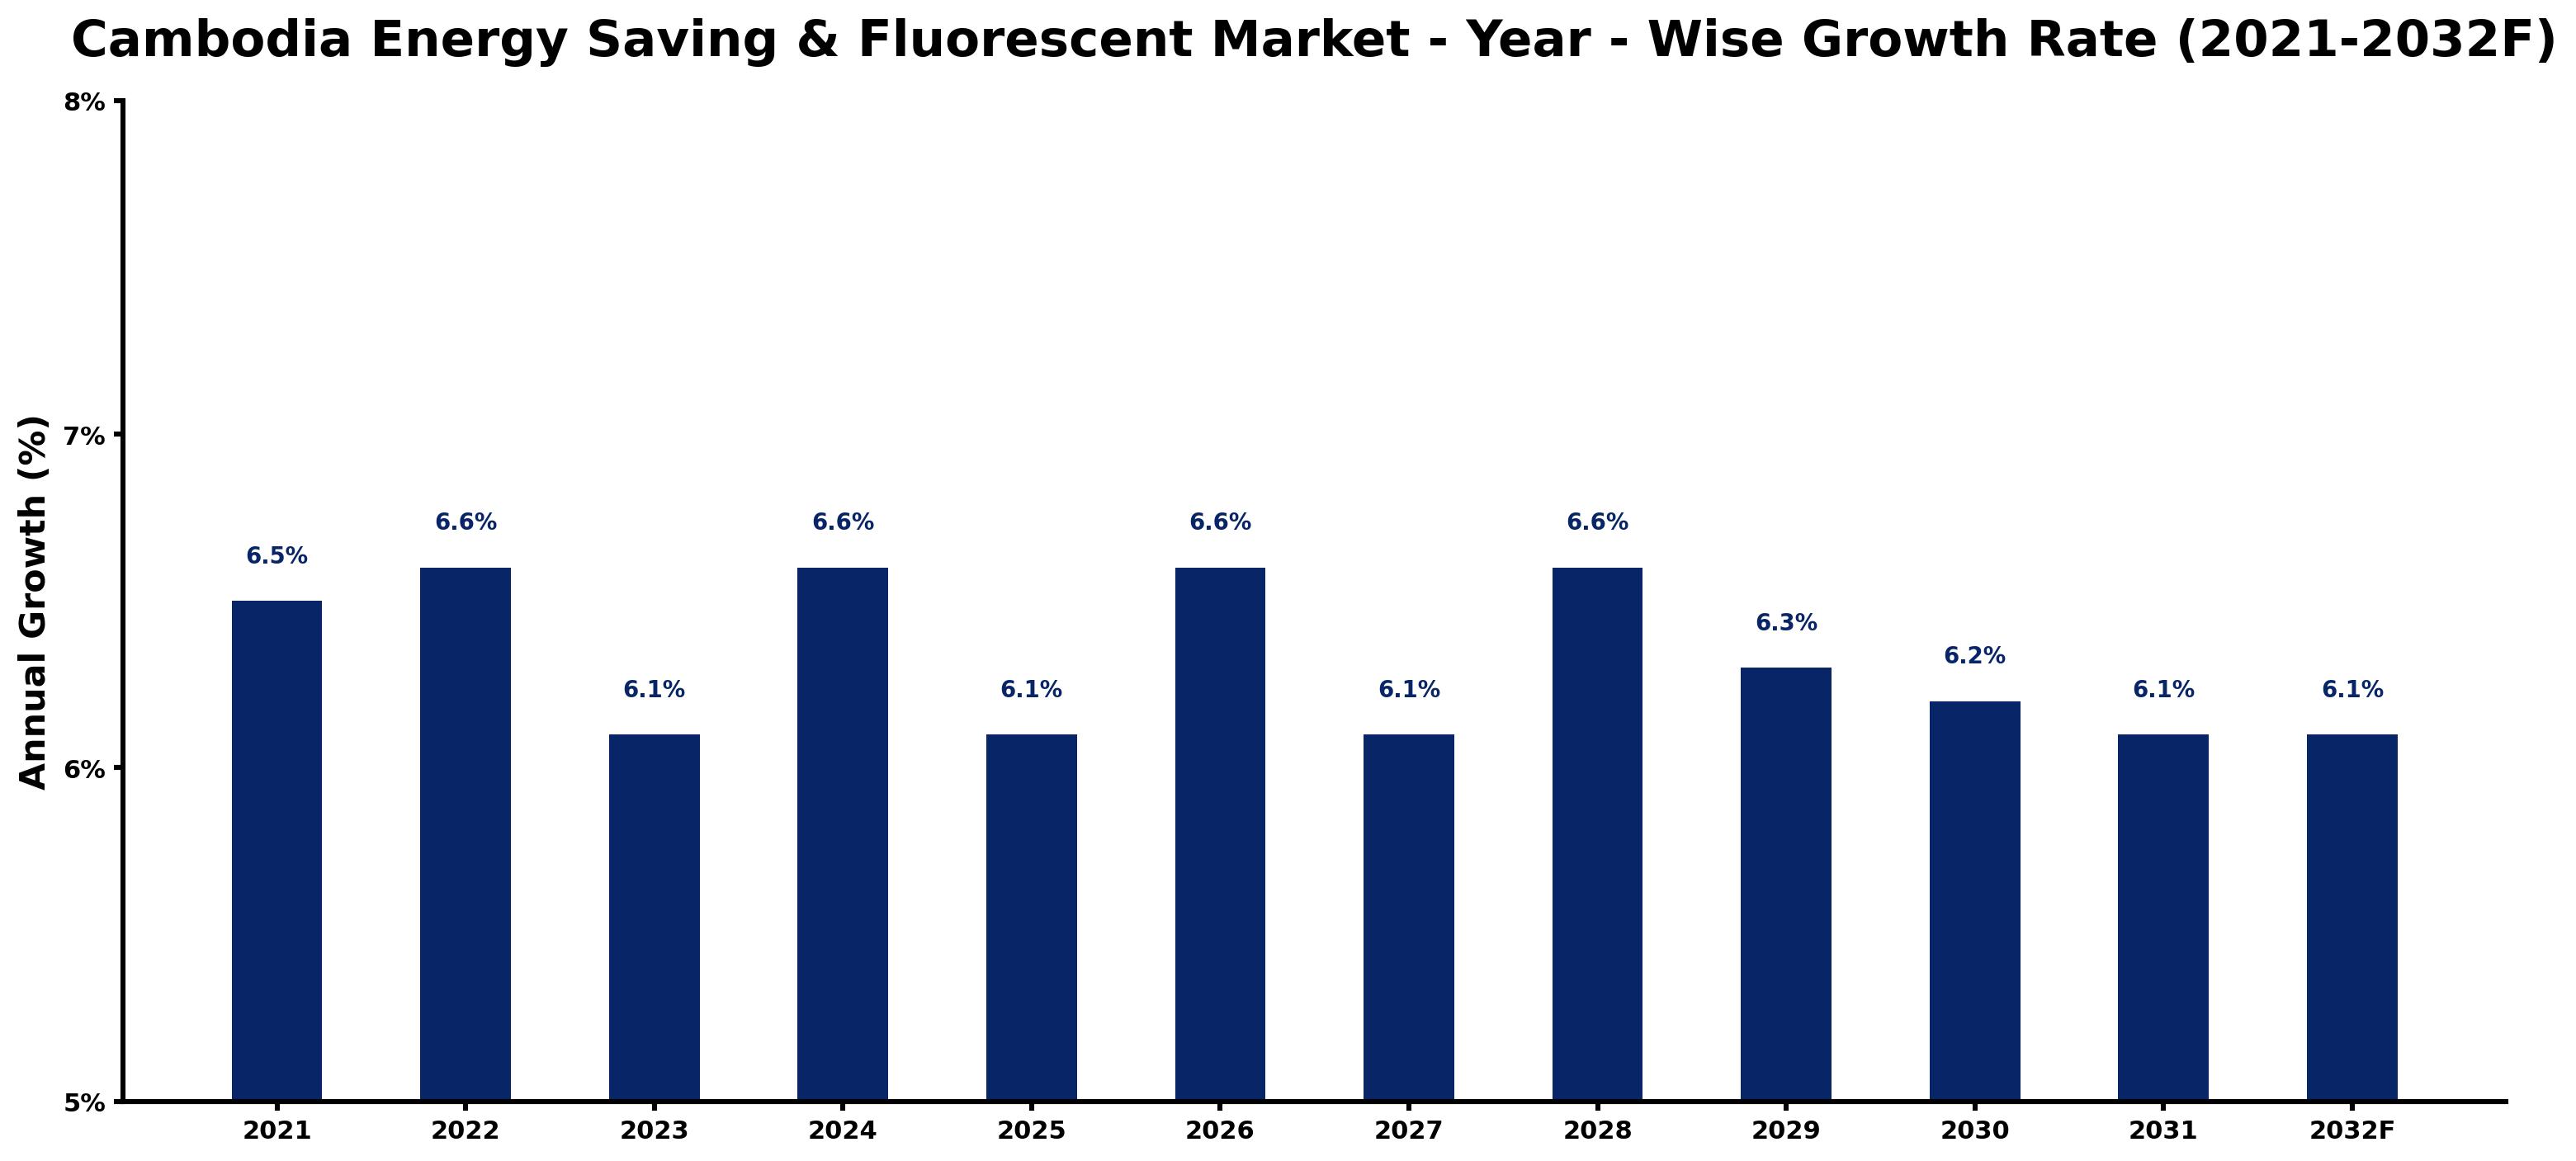
The table below presents the year wise growth rates along with the key drivers influencing the market
| Year | Growth Rate | Major Drivers |
| 2021 | 6.5% | Post-pandemic recovery plans focus heavily on energy efficiency and sustainability goals. |
| 2022 | 6.6% | Fluorescent technology gains traction due to affordability and longer lifespan benefits. |
| 2023 | 6.1% | Local manufacturing initiatives reduce dependence on imports, boosting regional production capacities. |
| 2024 | 6.6% | Consumer awareness campaigns promote energy-saving products, encouraging household upgrades. |
| 2025 | 6.1% | Urbanization trends lead to increased demand for efficient lighting in commercial spaces. |
| 2026 | 6.6% | Corporate social responsibility efforts drive businesses to adopt energy-efficient technologies. |
| 2027 | 6.1% | Infrastructure investments focus on enhancing power grids and renewable energy integration. |
| 2028 | 6.6% | Partnerships between NGOs and local businesses enhance distribution of energy-saving solutions. |
| 2029 | 6.3% | Technological innovations lower production costs, making energy-efficient products more accessible. |
| 2030 | 6.2% | Cross-border collaborations foster knowledge sharing and best practices in energy savings. |
| 2031 | 6.1% | Community-oriented programs encourage grassroots initiatives for energy conservation projects. |
| 2032 | 6.1% | Market maturity leads to standardization in energy-efficient products, enhancing consumer trust. |
Note - Market size estimations and growth projections presented in this report are based on 6Wresearch's advanced forecasting approach, validated with industry datasets as of June 2026.
Key Highlights of the Report:
- Cambodia Energy Saving & Fluorescent Market Outlook
- Market Size of Cambodia Energy Saving & Fluorescent Market, 2025
- Forecast of Cambodia Energy Saving & Fluorescent Market, 2032F
- Historical Data and Forecast of Cambodia Energy Saving & Fluorescent Revenues & Volume for the Period 2022-2032F
- Cambodia Energy Saving & Fluorescent Market Trend Evolution
- Cambodia Energy Saving & Fluorescent Market Drivers and Challenges
- Cambodia Energy Saving & Fluorescent Price Trends
- Cambodia Energy Saving & Fluorescent Porter's Five Forces
- Cambodia Energy Saving & Fluorescent Industry Life Cycle
- Historical Data and Forecast of Cambodia Energy Saving & Fluorescent Market Revenues & Volume By Sources for the Period 2022-2032F
- Historical Data and Forecast of Cambodia Energy Saving & Fluorescent Market Revenues & Volume By High-Intensity Discharge Lamps (HID) for the Period 2022-2032F
- Historical Data and Forecast of Cambodia Energy Saving & Fluorescent Market Revenues & Volume By Linear Fluorescent Lamps (LFL) for the Period 2022-2032F
- Historical Data and Forecast of Cambodia Energy Saving & Fluorescent Market Revenues & Volume By Light Emitting Diodes (LED) for the Period 2022-2032F
- Historical Data and Forecast of Cambodia Energy Saving & Fluorescent Market Revenues & Volume By Applications for the Period 2022-2032F
- Historical Data and Forecast of Cambodia Energy Saving & Fluorescent Market Revenues & Volume By Commercial for the Period 2022-2032F
- Historical Data and Forecast of Cambodia Energy Saving & Fluorescent Market Revenues & Volume By Residential for the Period 2022-2032F
- Historical Data and Forecast of Cambodia Energy Saving & Fluorescent Market Revenues & Volume By Government for the Period 2022-2032F
- Cambodia Energy Saving & Fluorescent Import Export Trade Statistics
- Market Opportunity Assessment By Sources
- Market Opportunity Assessment By Applications
- Cambodia Energy Saving & Fluorescent Top Companies Market Share
- Cambodia Energy Saving & Fluorescent Competitive Benchmarking By Technical and Operational Parameters
- Cambodia Energy Saving & Fluorescent Company Profiles
- Cambodia Energy Saving & Fluorescent Key Strategic Recommendations
Frequently Asked Questions About the Market Study (FAQs):
6Wresearch actively monitors the Cambodia Energy Saving & Fluorescent Market and publishes its comprehensive annual report, highlighting emerging trends, growth drivers, revenue analysis, and forecast outlook. Our insights help businesses to make data-backed strategic decisions with ongoing market dynamics. Our analysts track relevent industries related to the Cambodia Energy Saving & Fluorescent Market, allowing our clients with actionable intelligence and reliable forecasts tailored to emerging regional needs.
Yes, we provide customisation as per your requirements. To learn more, feel free to contact us on sales@6wresearch.com
1 Executive Summary |
2 Introduction |
2.1 Key Highlights of the Report |
2.2 Report Description |
2.3 Market Scope & Segmentation |
2.4 Research Methodology |
2.5 Assumptions |
3 Cambodia Energy Saving & Fluorescent Market Overview |
3.1 Cambodia Country Macro Economic Indicators |
3.2 Cambodia Energy Saving & Fluorescent Market Revenues & Volume, 2022 & 2032F |
3.3 Cambodia Energy Saving & Fluorescent Market - Industry Life Cycle |
3.4 Cambodia Energy Saving & Fluorescent Market - Porter's Five Forces |
3.5 Cambodia Energy Saving & Fluorescent Market Revenues & Volume Share, By Sources, 2022 & 2032F |
3.6 Cambodia Energy Saving & Fluorescent Market Revenues & Volume Share, By Applications, 2022 & 2032F |
4 Cambodia Energy Saving & Fluorescent Market Dynamics |
4.1 Impact Analysis |
4.2 Market Drivers |
4.3 Market Restraints |
5 Cambodia Energy Saving & Fluorescent Market Trends |
6 Cambodia Energy Saving & Fluorescent Market, By Types |
6.1 Cambodia Energy Saving & Fluorescent Market, By Sources |
6.1.1 Overview and Analysis |
6.1.2 Cambodia Energy Saving & Fluorescent Market Revenues & Volume, By Sources, 2022 - 2032F |
6.1.3 Cambodia Energy Saving & Fluorescent Market Revenues & Volume, By High-Intensity Discharge Lamps (HID), 2022 - 2032F |
6.1.4 Cambodia Energy Saving & Fluorescent Market Revenues & Volume, By Linear Fluorescent Lamps (LFL), 2022 - 2032F |
6.1.5 Cambodia Energy Saving & Fluorescent Market Revenues & Volume, By Light Emitting Diodes (LED), 2022 - 2032F |
6.2 Cambodia Energy Saving & Fluorescent Market, By Applications |
6.2.1 Overview and Analysis |
6.2.2 Cambodia Energy Saving & Fluorescent Market Revenues & Volume, By Commercial, 2022 - 2032F |
6.2.3 Cambodia Energy Saving & Fluorescent Market Revenues & Volume, By Residential, 2022 - 2032F |
6.2.4 Cambodia Energy Saving & Fluorescent Market Revenues & Volume, By Government, 2022 - 2032F |
7 Cambodia Energy Saving & Fluorescent Market Import-Export Trade Statistics |
7.1 Cambodia Energy Saving & Fluorescent Market Export to Major Countries |
7.2 Cambodia Energy Saving & Fluorescent Market Imports from Major Countries |
8 Cambodia Energy Saving & Fluorescent Market Key Performance Indicators |
9 Cambodia Energy Saving & Fluorescent Market - Opportunity Assessment |
9.1 Cambodia Energy Saving & Fluorescent Market Opportunity Assessment, By Sources, 2022 & 2032F |
9.2 Cambodia Energy Saving & Fluorescent Market Opportunity Assessment, By Applications, 2022 & 2032F |
10 Cambodia Energy Saving & Fluorescent Market - Competitive Landscape |
10.1 Cambodia Energy Saving & Fluorescent Market Revenue Share, By Companies, 2025 |
10.2 Cambodia Energy Saving & Fluorescent Market Competitive Benchmarking, By Operating and Technical Parameters |
11 Company Profiles |
12 Recommendations |
13 Disclaimer |
Global Go To Market Strategy - 2030
Export potential enables firms to identify high-growth global markets with greater confidence by combining advanced trade intelligence with a structured quantitative methodology. The framework analyzes emerging demand trends and country-level import patterns while integrating macroeconomic and trade datasets such as GDP and population forecasts, bilateral import–export flows, tariff structures, elasticity differentials between developed and developing economies, geographic distance, and import demand projections. Using weighted trade values from 2020–2024 as the base period to project country-to-country export potential for 2030, these inputs are operationalized through calculated drivers such as gravity model parameters, tariff impact factors, and projected GDP per-capita growth. Through an analysis of hidden potentials, demand hotspots, and market conditions that are most favorable to success, this method enables firms to focus on target countries, maximize returns, and global expansion with data, backed by accuracy.
By factoring in the projected importer demand gap that is currently unmet and could be potential opportunity, it identifies the potential for the Exporter (Country) among 190 countries, against the general trade analysis, which identifies the biggest importer or exporter.
To discover high-growth global markets and optimize your business strategy:
Click Here
Pricing
- Single User License$ 1,995
- Department License$ 2,400
- Site License$ 3,120
- Global License$ 3,795

Leadership Perspectives from Industry Events
Search
Thought Leadership and Analyst Meet


Our Clients
6WResearch In News
- Smartphones Lead India's Exports potential at $94 Billion by 2031 — But $30.1 Billion in Untapped Markets Is the Real Story
- India Air Conditioner Market Set for Strong Rebound in 2026 After Weather-Led Correction and GST-Driven Recovery: 6Wresearch
- ADAS in India: How Automatic Emergency Braking, Blind Spot Detection & Driver Monitoring are Transforming Road Safety
- Doha a strategic location for EV manufacturing hub: IPA Qatar
- Demand for luxury TVs surging in the GCC, says Samsung
- Empowering Growth: The Thriving Journey of Bangladesh’s Cable Industry
Latest Reports
- Gabon Citrullinemia Type-1 Market (2026-2032)
- Finland Citrullinemia Type-1 Market (2026-2032)
- Fiji Citrullinemia Type-1 Market (2026-2032)
- Ethiopia Citrullinemia Type-1 Market (2026-2032)
- Estonia Citrullinemia Type-1 Market (2026-2032)
- Eritrea Citrullinemia Type-1 Market (2026-2032)
- Equatorial Guinea Citrullinemia Type-1 Market (2026-2032)
- El Salvador Citrullinemia Type-1 Market (2026-2032)
- Ecuador Citrullinemia Type-1 Market (2026-2032)
- Dominica Citrullinemia Type-1 Market (2026-2032)
Industry Events and Analyst Meet

EV India Expo 2026

HIMTEX 2026

India Refining Summit 2026

India EV Show 2026

EV tech India Expo 2026
Whitepaper
- Middle East & Africa Commercial Security Market Click here to view more.
- Middle East & Africa Fire Safety Systems & Equipment Market Click here to view more.
- GCC Drone Market Click here to view more.
- Middle East Lighting Fixture Market Click here to view more.
- GCC Physical & Perimeter Security Market Click here to view more.