Cambodia Neon Gas Market (2026-2032) Outlook | Share, Growth, Industry, Value, Companies, Forecast, Size, Trends, Revenue & Analysis
Market Forecast By Type (Low, High, Ultra High), By Application (Semiconductor, LCD, Imaging and Lighting, Refrigerator, Laser, Medical, Others) And Competitive Landscape
| Product Code: ETC094852 | Publication Date: Jun 2021 | Updated Date: Jun 2026 | Product Type: Report | |
| Publisher: 6Wresearch | Author: Summon Dutta | No. of Pages: 70 | No. of Figures: 35 | No. of Tables: 5 |
Cambodia Neon Gas Market Size, Share & Growth Rate
The Cambodia Neon Gas Market was estimated at USD 387 Million in 2025 and is projected to reach USD 542 Million by 2032, growing at a CAGR of 4.9% from 2026 to 2032. This robust growth trajectory is fueled by the increasing demand from key sectors such as electronics and healthcare, where neon gas is essential for various applications, including plasma displays and medical lasers. As urbanization and industrial development in Cambodia accelerate, the demand for neon gas in signage, lighting, and other applications is set to rise significantly.
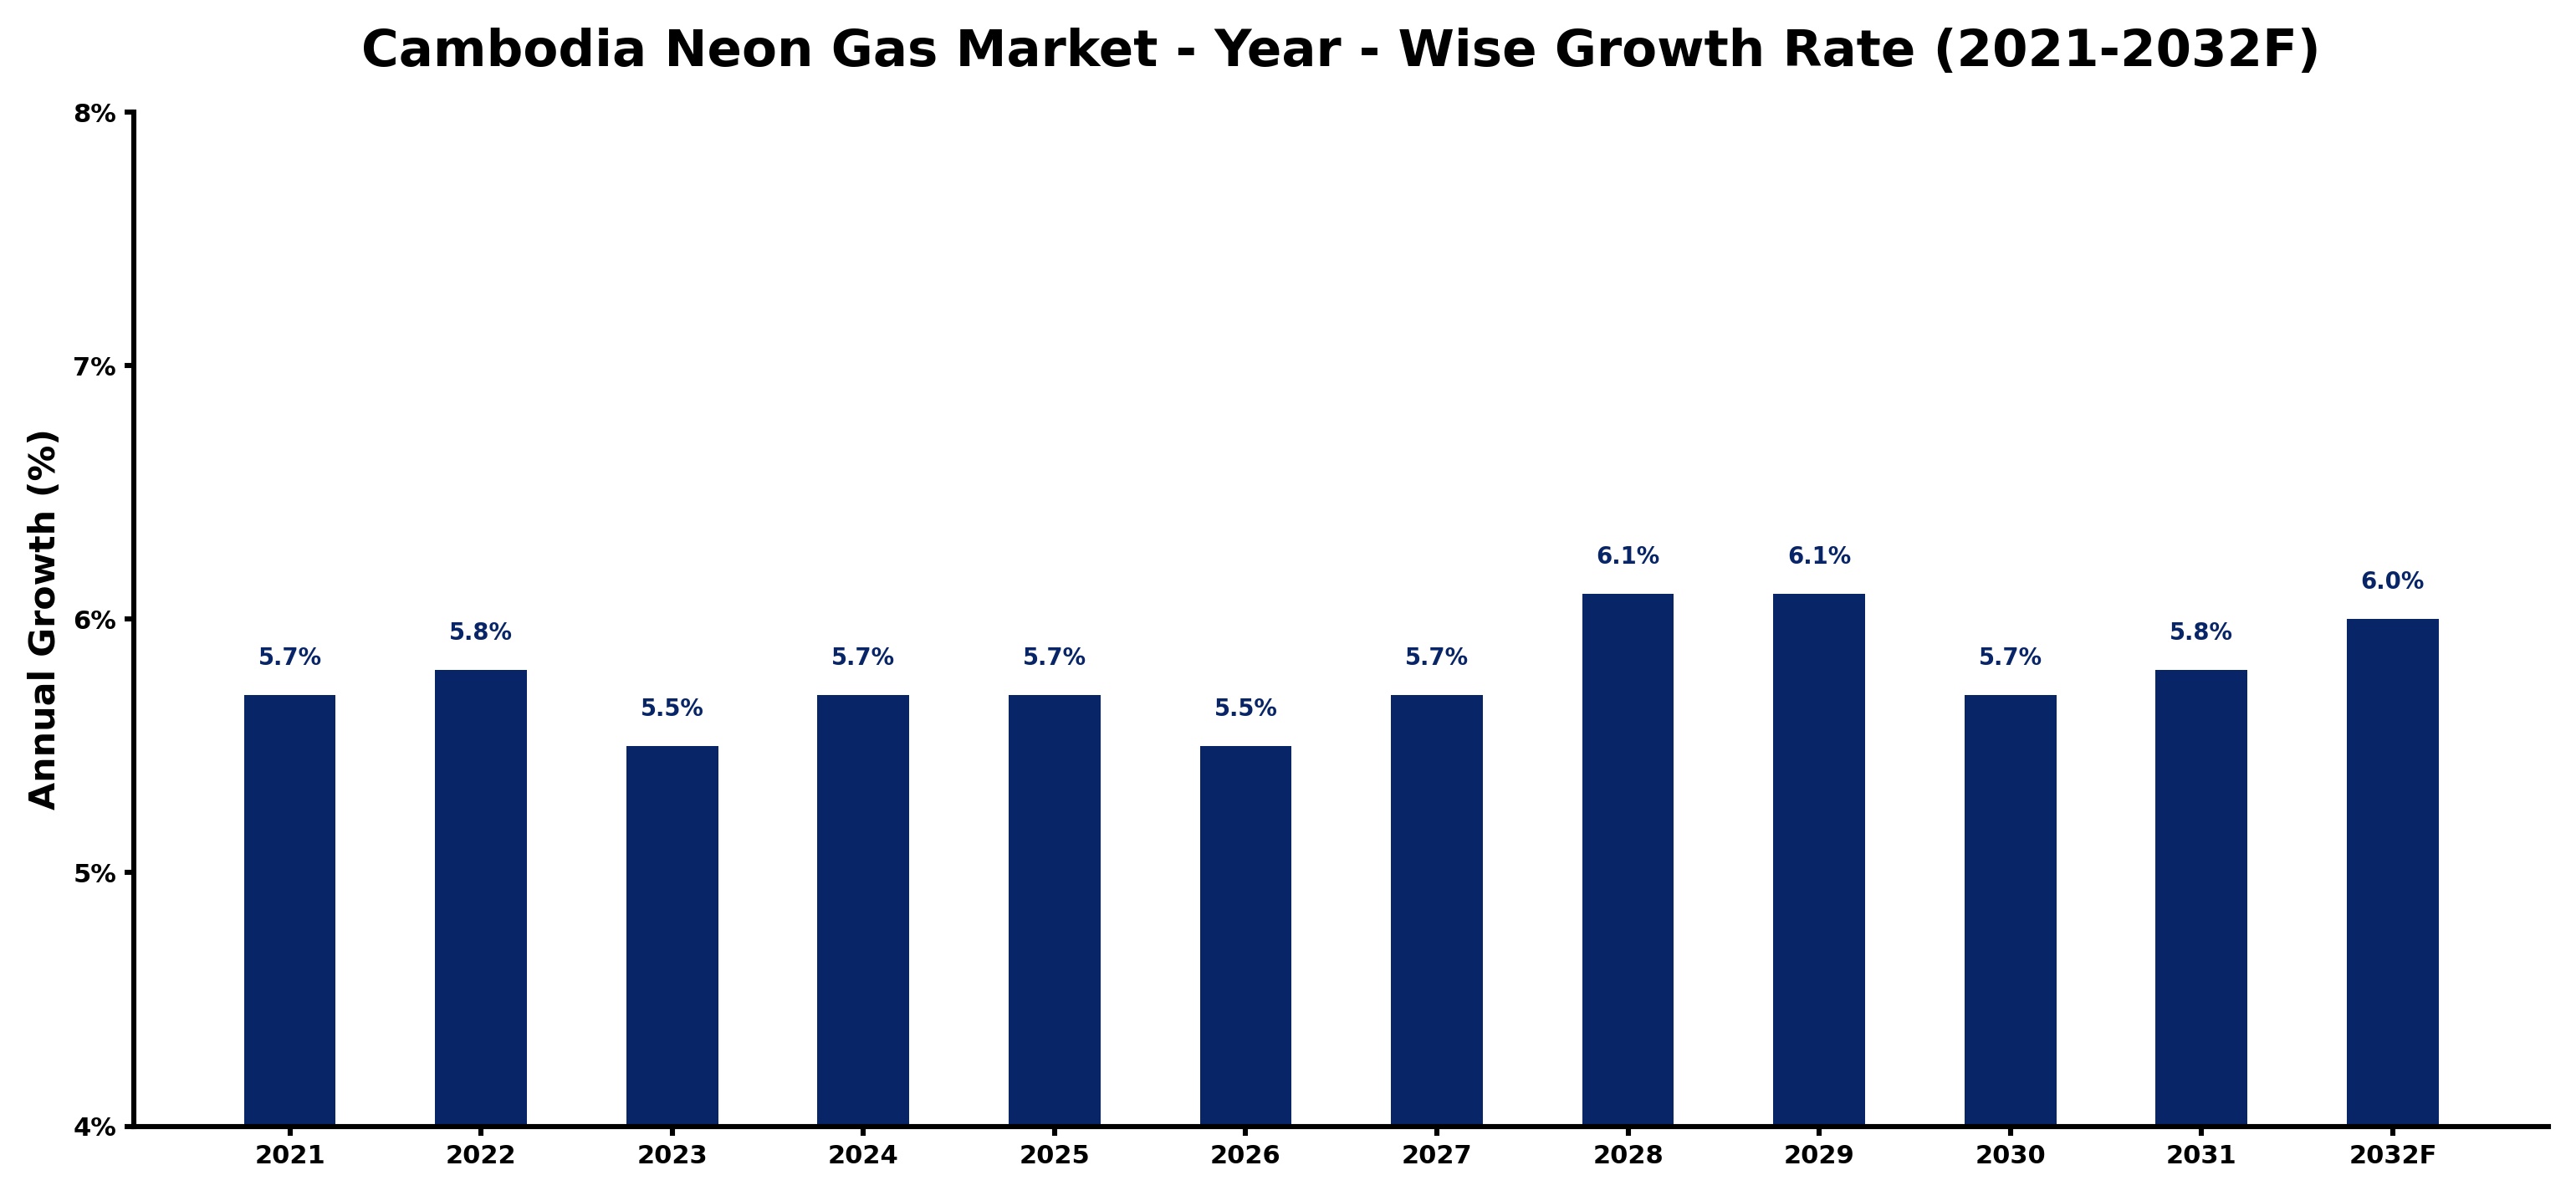
Cambodia Neon Gas Market Growth Rate Analysis (2021-2032)
The Cambodia neon gas market has exhibited stable growth, recording a yearly increase of 5.7% in 2021, followed by slight fluctuations with 5.8% in 2022, and 5.5% in 2023. This steady expansion can be attributed to a surge in demand across various industries, particularly in lighting and signage applications, coupled with ongoing investments in infrastructure and technology. The forecast indicates a continuation of this trend, with growth rates projected at 5.7% for both 2024 and 2025. Notably, a slight pick-up to 6.1% in 2028 and 2029 reflects enhanced consumer adoption and advancements in production technology, supporting Cambodia's energy transition towards more efficient and sustainable practices.
Cambodia Neon Gas Market Year-wise Growth Rate and Key Drivers
This graph highlights how the Cambodia Neon Gas Market has steadily grown over the past five years, supported by major growth factors.
The table below presents the year‑wise growth rates along with the key drivers influencing the market
| Year | Growth Rate | Major Drivers |
| 2021 | 5.7% | Higher demand for neon gas boosts semiconductor manufacturing capacity |
| 2022 | 5.8% | Local manufacturing investment boosted neon gas production capabilities |
| 2023 | 5.5% | Manufacturing sector recovery boosts neon gas consumption for electronics |
| 2024 | 5.7% | Export driven demand for neon gas supports local manufacturing investments |
| 2025 | 5.7% | New gas separation technology boosts local neon gas production |
| 2026 | 5.5% | Neon gas suppliers adopt advanced technology for efficient extraction |
| 2027 | 5.7% | Regional chemical manufacturers optimized processes to boost neon gas production |
| 2028 | 6.1% | Cambodian electronics manufacturing surge drives neon gas consumption growth |
| 2029 | 6.1% | Technology upgrades in gas production boost operational efficiency and output |
| 2030 | 5.7% | Increased local glass production boosts neon gas demand |
| 2031 | 5.8% | Export driven demand for neon gas supports semiconductor manufacturing investments |
| 2032 | 6.0% | Domestic neon gas supply chain investments boosted semiconductor manufacturing output |
Note - Market size estimations and growth projections presented in this report are based on 6Wresearch’s advanced forecasting approach, validated with industry datasets as of June 2026.
Cambodia Neon Gas Market Synopsis
Recent momentum in the Cambodia Neon Gas Market has been driven by a surge in demand across multiple sectors. However, as industries adapt to evolving technologies and standards, the market is poised for further expansion, especially with the potential for innovative applications in emerging fields.
While the current landscape shows promise, there are underlying challenges, such as high import costs and limited domestic production capabilities. These factors create a complex environment for market players, necessitating strategic planning and investment to capitalize on growth opportunities.
Cambodia Neon Gas Market Key Takeaways
- The market is experiencing steady growth driven by demand in electronics, healthcare, and lighting.
- Urbanization and infrastructure developments are expanding applications for neon gas.
- Investment opportunities are abundant, particularly in production and innovative applications.
- Government policies are focused on safety and fair competition within the neon gas sector.
- Challenges related to cost and logistics need addressing for sustained growth.
Evaluation of Restraints in Cambodia Neon Gas Market
One of the primary constraints in the Cambodia Neon Gas Market is the limited understanding of neon gas applications among potential customers. Many end-users are still unaware of the benefits and versatility of neon gas compared to more commonly used gases, which hinders market penetration. Furthermore, the supply chain for neon gas often lacks the robustness seen in other gas markets, complicating distribution and availability for suppliers. Additionally, global fluctuations in raw material prices can significantly impact local pricing, creating uncertainty in cost management for businesses operating in this space.
Cambodia Neon Gas Market Trends
The demand for neon gas in Cambodia is increasingly influenced by technological advancements, particularly in the electronics and healthcare sectors. The rise of LED and plasma display technologies is reshaping applications traditionally dominated by neon. Moreover, the healthcare sector's expanding reliance on neon for various medical devices is a significant growth driver. With urban infrastructure development gaining momentum, there is a burgeoning interest in neon for construction-related applications, including specialized lighting.
Cambodia Neon Gas Market Opportunities
Investment potential in the Cambodia Neon Gas Market is particularly promising due to the ongoing industrialization and economic growth. Opportunities abound in establishing local production facilities to reduce dependency on imports, thus mitigating associated costs. Additionally, research and development initiatives aimed at uncovering new applications for neon gas are likely to yield significant returns. Government incentives aimed at attracting foreign investment further enhance the market’s attractiveness for potential stakeholders.
Government Initiatives in the Cambodia Neon Gas Market
The Cambodian government has implemented a regulatory framework to ensure safe production, distribution, and usage of neon gas. These regulations prioritize public safety and environmental protection, mandating companies to adhere to strict guidelines for gas handling. Additionally, the government monitors pricing structures to promote fair competition and prevent market manipulation. Such policies reflect a commitment to cultivating a secure and competitive market environment that can support ongoing industrial growth.
Future Insights of the Cambodia Neon Gas Market
The future of the Cambodia Neon Gas Market looks increasingly optimistic, with growth anticipated from various sectors such as electronics and healthcare. The continuous expansion of the electronics manufacturing industry is likely to create further demand for neon gas in advanced applications. Despite potential hurdles, including the emergence of alternative gases and fluctuating raw material costs, the overall market trajectory indicates a period of sustained growth and innovation through 2032.
Cambodia Neon Gas Market Latest Developments (May 2025 - June 2026)
In the recent months, the Cambodia Neon Gas Market has seen a shift towards improved production practices and enhanced safety standards. The introduction of new regulatory measures aims to streamline operations and encourage industry compliance. Additionally, companies are increasingly focusing on expanding their product offerings to incorporate advanced applications in medical and display technologies, reflecting broader trends in global gas markets.
Cambodia Neon Gas Market - Key Attractiveness of the Report
- 10 Years of Market Numbers
- Historical Data Starting from 2022 to 2025
- Base Year: 2025
- Forecast Data until 2032
- Key Performance Indicators Impacting the Market
- Major Upcoming Developments and Projects
Key Highlights of the Report:
- Cambodia Neon Gas Market Outlook
- Market Size of Cambodia Neon Gas Market, 2025
- Forecast of Cambodia Neon Gas Market, 2032
- Historical Data and Forecast of Cambodia Neon Gas Revenues & Volume for the Period 2022-2032F
- Cambodia Neon Gas Market Trend Evolution
- Cambodia Neon Gas Market Drivers and Challenges
- Cambodia Neon Gas Price Trends
- Cambodia Neon Gas Porter's Five Forces
- Cambodia Neon Gas Industry Life Cycle
- Historical Data and Forecast of Cambodia Neon Gas Market Revenues & Volume By Type for the Period 2022-2032F
- Historical Data and Forecast of Cambodia Neon Gas Market Revenues & Volume By Low for the Period 2022-2032F
- Historical Data and Forecast of Cambodia Neon Gas Market Revenues & Volume By High for the Period 2022-2032F
- Historical Data and Forecast of Cambodia Neon Gas Market Revenues & Volume By Ultra High for the Period 2022-2032F
- Historical Data and Forecast of Cambodia Neon Gas Market Revenues & Volume By Application for the Period 2022-2032F
- Historical Data and Forecast of Cambodia Neon Gas Market Revenues & Volume By Semiconductor for the Period 2022-2032F
- Historical Data and Forecast of Cambodia Neon Gas Market Revenues & Volume By LCD for the Period 2022-2032F
- Historical Data and Forecast of Cambodia Neon Gas Market Revenues & Volume By Imaging and Lighting for the Period 2022-2032F
- Historical Data and Forecast of Cambodia Neon Gas Market Revenues & Volume By Refrigerator for the Period 2022-2032F
- Historical Data and Forecast of Cambodia Neon Gas Market Revenues & Volume By Laser for the Period 2022-2032F
- Historical Data and Forecast of Cambodia Neon Gas Market Revenues & Volume By Medical for the Period 2022-2032F
- Historical Data and Forecast of Cambodia Neon Gas Market Revenues & Volume By Others for the Period 2022-2032F
- Cambodia Neon Gas Import Export Trade Statistics
- Market Opportunity Assessment By Type
- Market Opportunity Assessment By Application
- Cambodia Neon Gas Top Companies Market Share
- Cambodia Neon Gas Competitive Benchmarking By Technical and Operational Parameters
- Cambodia Neon Gas Company Profiles
- Cambodia Neon Gas Key Strategic Recommendations
Cambodia Neon Gas Market - Frequently Asked Questions
The market is primarily driven by increasing demand from key sectors such as electronics, healthcare, and signage, where neon gas plays a vital role in various applications.
Urbanization is leading to higher demand for neon gas in construction and manufacturing applications, particularly in signage and specialized lighting for urban infrastructure.
The Cambodia Neon Gas Market was estimated at USD 387 Million in 2025 and is projected to reach USD 542 Million by 2032, growing at a CAGR of 4.9% from 2026 to 2032.
Challenges include high import costs, limited domestic production capabilities, and fluctuating global raw material prices that impact local pricing and market dynamics.
Opportunities lie in establishing local production facilities, innovative applications through R&D, and leveraging government initiatives aimed at promoting industrial growth.
6Wresearch actively monitors the Cambodia Neon Gas Market and publishes its comprehensive annual report, highlighting emerging trends, growth drivers, revenue analysis, and forecast outlook. Our insights help businesses to make data-backed strategic decisions with ongoing market dynamics. Our analysts track relevent industries related to the Cambodia Neon Gas Market, allowing our clients with actionable intelligence and reliable forecasts tailored to emerging regional needs.
Yes, we provide customisation as per your requirements. To learn more, feel free to contact us on sales@6wresearch.com
1 Executive Summary |
2 Introduction |
2.1 Key Highlights of the Report |
2.2 Report Description |
2.3 Market Scope & Segmentation |
2.4 Research Methodology |
2.5 Assumptions |
3 Cambodia Neon Gas Market Overview |
3.1 Cambodia Country Macro Economic Indicators |
3.2 Cambodia Neon Gas Market Revenues & Volume, 2022 & 2032F |
3.3 Cambodia Neon Gas Market - Industry Life Cycle |
3.4 Cambodia Neon Gas Market - Porter's Five Forces |
3.5 Cambodia Neon Gas Market Revenues & Volume Share, By Type, 2022 & 2032F |
3.6 Cambodia Neon Gas Market Revenues & Volume Share, By Form, 2022 & 2032F |
4 Cambodia Neon Gas Market Dynamics |
4.1 Impact Analysis |
4.2 Market Drivers |
4.3 Market Restraints |
5 Cambodia Neon Gas Market Trends |
6 Cambodia Neon Gas Market, By Types |
6.1 Cambodia Neon Gas Market, By Type |
6.1.1 Overview and Analysis |
6.1.2 Cambodia Neon Gas Market Revenues & Volume, By Type, 2022-2032F |
6.1.3 Cambodia Neon Gas Market Revenues & Volume, By Low, 2022-2032F |
6.1.4 Cambodia Neon Gas Market Revenues & Volume, By High, 2022-2032F |
6.1.5 Cambodia Neon Gas Market Revenues & Volume, By Ultra High, 2022-2032F |
6.2 Cambodia Neon Gas Market, By Application |
6.2.1 Overview and Analysis |
6.2.2 Cambodia Neon Gas Market Revenues & Volume, By Semiconductor, 2022-2032F |
6.2.3 Cambodia Neon Gas Market Revenues & Volume, By LCD, 2022-2032F |
6.2.4 Cambodia Neon Gas Market Revenues & Volume, By Imaging and Lighting, 2022-2032F |
6.2.5 Cambodia Neon Gas Market Revenues & Volume, By Refrigerator, 2022-2032F |
6.2.6 Cambodia Neon Gas Market Revenues & Volume, By Laser, 2022-2032F |
6.2.7 Cambodia Neon Gas Market Revenues & Volume, By Medical, 2022-2032F |
7 Cambodia Neon Gas Market Import-Export Trade Statistics |
7.1 Cambodia Neon Gas Market Export to Major Countries |
7.2 Cambodia Neon Gas Market Imports from Major Countries |
8 Cambodia Neon Gas Market Key Performance Indicators |
9 Cambodia Neon Gas Market - Opportunity Assessment |
9.1 Cambodia Neon Gas Market Opportunity Assessment, By Type, 2022 & 2032F |
9.2 Cambodia Neon Gas Market Opportunity Assessment, By Application, 2022 & 2032F |
10 Cambodia Neon Gas Market - Competitive Landscape |
10.1 Cambodia Neon Gas Market Revenue Share, By Companies, 2025 |
10.2 Cambodia Neon Gas Market Competitive Benchmarking, By Operating and Technical Parameters |
11 Company Profiles |
12 Recommendations |
13 Disclaimer |
Global Go To Market Strategy - 2030
Export potential enables firms to identify high-growth global markets with greater confidence by combining advanced trade intelligence with a structured quantitative methodology. The framework analyzes emerging demand trends and country-level import patterns while integrating macroeconomic and trade datasets such as GDP and population forecasts, bilateral import–export flows, tariff structures, elasticity differentials between developed and developing economies, geographic distance, and import demand projections. Using weighted trade values from 2020–2024 as the base period to project country-to-country export potential for 2030, these inputs are operationalized through calculated drivers such as gravity model parameters, tariff impact factors, and projected GDP per-capita growth. Through an analysis of hidden potentials, demand hotspots, and market conditions that are most favorable to success, this method enables firms to focus on target countries, maximize returns, and global expansion with data, backed by accuracy.
By factoring in the projected importer demand gap that is currently unmet and could be potential opportunity, it identifies the potential for the Exporter (Country) among 190 countries, against the general trade analysis, which identifies the biggest importer or exporter.
To discover high-growth global markets and optimize your business strategy:
Click Here
Pricing
- Single User License$ 1,995
- Department License$ 2,400
- Site License$ 3,120
- Global License$ 3,795

Leadership Perspectives from Industry Events
Search
Thought Leadership and Analyst Meet


Our Clients
6WResearch In News
- India Air Conditioner Market Set for Strong Rebound in 2026 After Weather-Led Correction and GST-Driven Recovery: 6Wresearch
- ADAS in India: How Automatic Emergency Braking, Blind Spot Detection & Driver Monitoring are Transforming Road Safety
- Doha a strategic location for EV manufacturing hub: IPA Qatar
- Demand for luxury TVs surging in the GCC, says Samsung
- Empowering Growth: The Thriving Journey of Bangladesh’s Cable Industry
- Demand for luxury TVs surging in the GCC, says Samsung
Latest Reports
- Nicaragua RPG Gaming Market (2026-2032)
- New Zealand RPG Gaming Market (2026-2032)
- Netherlands RPG Gaming Market (2026-2032)
- Nauru RPG Gaming Market (2026-2032)
- Namibia RPG Gaming Market (2026-2032)
- Mozambique RPG Gaming Market (2026-2032)
- Montenegro RPG Gaming Market (2026-2032)
- Mongolia RPG Gaming Market (2026-2032)
- Monaco RPG Gaming Market (2026-2032)
- Micronesia RPG Gaming Market (2026-2032)
Industry Events and Analyst Meet

HIMTEX 2026

India Refining Summit 2026

India EV Show 2026

EV tech India Expo 2026

Auto Tech Asia 2026
Whitepaper
- Middle East & Africa Commercial Security Market Click here to view more.
- Middle East & Africa Fire Safety Systems & Equipment Market Click here to view more.
- GCC Drone Market Click here to view more.
- Middle East Lighting Fixture Market Click here to view more.
- GCC Physical & Perimeter Security Market Click here to view more.