Cape Verde Candy Market (2025-2031) | Size, Trends, Forecast, Growth, Value, Analysis, Revenue, Industry, Segmentation, Outlook, Share & Companies
Market Forecast By Product Type (Chocolate Candy, Non-Chocolate Candy), By Distribution (Supermarkets and Hypermarkets, Convenience Stores, Specialist Retailers, Online Retail, Others) And Competitive Landscape
| Product Code: ETC5378270 | Publication Date: Nov 2023 | Updated Date: Nov 2025 | Product Type: Market Research Report | |
| Publisher: 6Wresearch | Author: Bhawna Singh | No. of Pages: 60 | No. of Figures: 30 | No. of Tables: 5 |
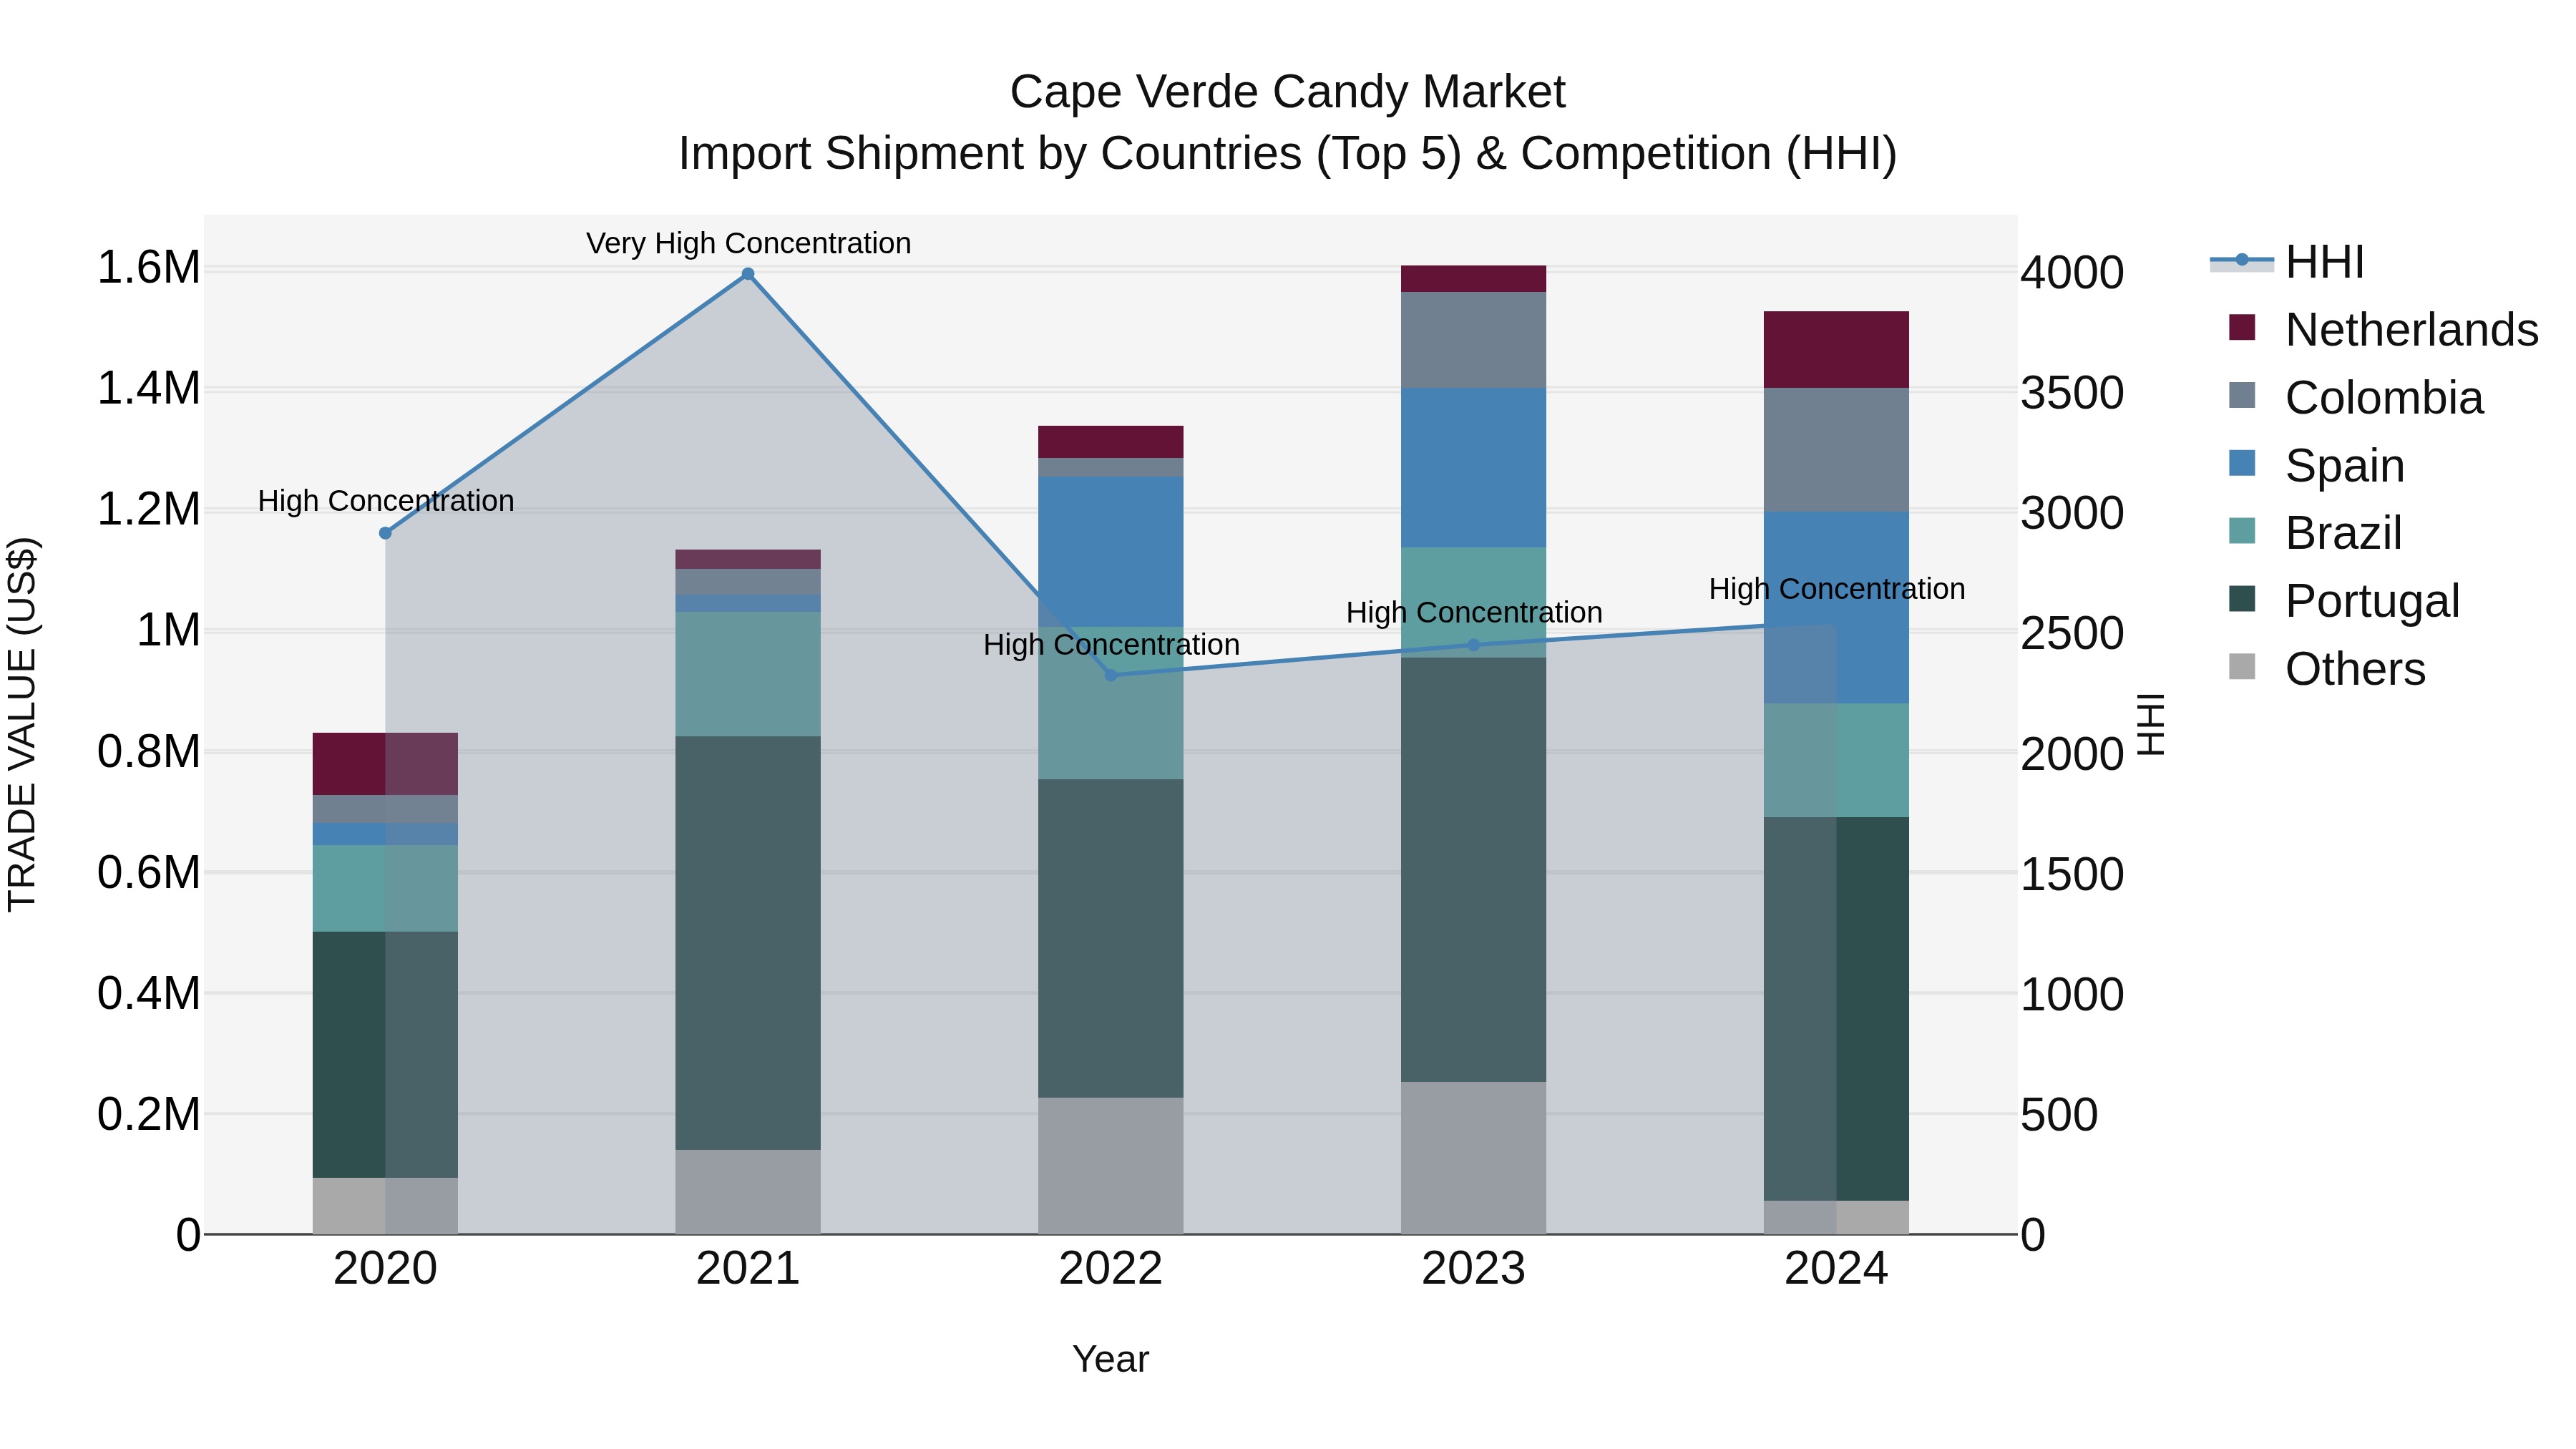
Cape Verde Candy Market: Top 5 Importing Countries and Market Competition (HHI) Analysis
Despite a slight decline in growth rate from 2023 to 2024, Cape Verde`s candy import market continues to show strong overall expansion, with a notable Compound Annual Growth Rate (CAGR) of 16.47% from 2020 to 2024. The top countries exporting confectionery products to Cape Verde in 2024 are Portugal, Spain, Colombia, Brazil, and Netherlands, indicating a diverse range of sources for candy imports. The High Herfindahl-Hirschman Index (HHI) suggests a concentrated market, pointing to potential competition challenges and opportunities for market consolidation in the future.
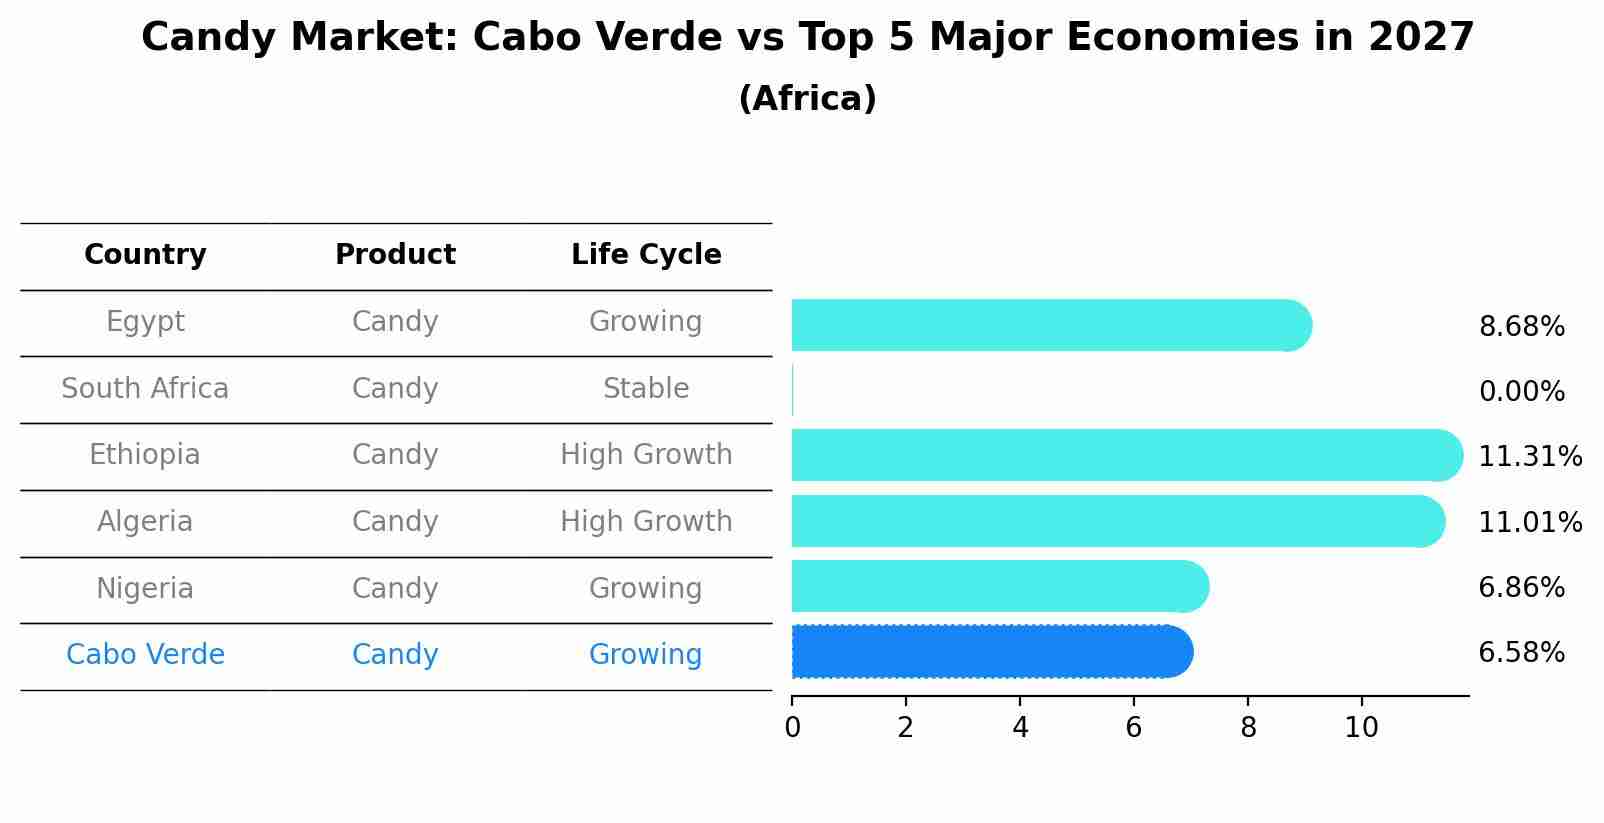
Candy Market: Cabo Verde vs Top 5 Major Economies in 2027 (Africa)
Cabo Verde's Candy market is anticipated to experience a growing growth rate of 6.58% by 2027, reflecting trends observed in the largest economy Egypt, followed by South Africa, Ethiopia, Algeria and Nigeria.
Cape Verde Candy Market Overview
The candy market in Cape Verde is driven by consumer preferences and the growing retail sector. Candy is a popular confectionery item, and demand is influenced by factors such as local consumption habits and imported product availability. The market is characterized by a mix of local and imported candy products. As disposable incomes rise and consumer tastes evolve, there is potential for growth in the candy market. Import costs and global candy trends also impact the local market dynamics.
Drivers of the market
The Cape Verde candy market experiences growth due to increasing consumer demand for confectionery products. The expansion of the retail sector and the introduction of new and innovative candy products drive market growth. Additionally, festive seasons and cultural events contribute to higher candy consumption. The rising disposable incomes and changing consumer preferences support the markets expansion.
Challenges of the market
The Cape Verde Candy market faces several challenges, including high import costs for raw materials and finished products. Limited local manufacturing capabilities and infrastructure further contribute to market difficulties. Additionally, fluctuations in consumer preferences and competition from both local and international brands impact market dynamics and profitability.
Government Policy of the market
Cape Verde`s policies on the candy market focus on food safety and quality. The government regulates the production, labeling, and importation of candy to ensure that products meet health standards and are safe for consumption. Regulations cover ingredients, manufacturing processes, and packaging to prevent contamination and ensure product quality. Importers must adhere to these regulations, and there are incentives for local producers to maintain high standards and promote domestic production.
Key Highlights of the Report:
- Cape Verde Candy Market Outlook
- Market Size of Cape Verde Candy Market, 2024
- Forecast of Cape Verde Candy Market, 2031
- Historical Data and Forecast of Cape Verde Candy Revenues & Volume for the Period 2021-2031
- Cape Verde Candy Market Trend Evolution
- Cape Verde Candy Market Drivers and Challenges
- Cape Verde Candy Price Trends
- Cape Verde Candy Porter`s Five Forces
- Cape Verde Candy Industry Life Cycle
- Historical Data and Forecast of Cape Verde Candy Market Revenues & Volume By Product Type for the Period 2021-2031
- Historical Data and Forecast of Cape Verde Candy Market Revenues & Volume By Chocolate Candy for the Period 2021-2031
- Historical Data and Forecast of Cape Verde Candy Market Revenues & Volume By Non-Chocolate Candy for the Period 2021-2031
- Historical Data and Forecast of Cape Verde Candy Market Revenues & Volume By Distribution for the Period 2021-2031
- Historical Data and Forecast of Cape Verde Candy Market Revenues & Volume By Supermarkets and Hypermarkets for the Period 2021-2031
- Historical Data and Forecast of Cape Verde Candy Market Revenues & Volume By Convenience Stores for the Period 2021-2031
- Historical Data and Forecast of Cape Verde Candy Market Revenues & Volume By Specialist Retailers for the Period 2021-2031
- Historical Data and Forecast of Cape Verde Candy Market Revenues & Volume By Online Retail for the Period 2021-2031
- Historical Data and Forecast of Cape Verde Candy Market Revenues & Volume By Others for the Period 2021-2031
- Cape Verde Candy Import Export Trade Statistics
- Market Opportunity Assessment By Product Type
- Market Opportunity Assessment By Distribution
- Cape Verde Candy Top Companies Market Share
- Cape Verde Candy Competitive Benchmarking By Technical and Operational Parameters
- Cape Verde Candy Company Profiles
- Cape Verde Candy Key Strategic Recommendations
Frequently Asked Questions About the Market Study (FAQs):
6Wresearch actively monitors the Cape Verde Candy Market and publishes its comprehensive annual report, highlighting emerging trends, growth drivers, revenue analysis, and forecast outlook. Our insights help businesses to make data-backed strategic decisions with ongoing market dynamics. Our analysts track relevent industries related to the Cape Verde Candy Market, allowing our clients with actionable intelligence and reliable forecasts tailored to emerging regional needs.
Yes, we provide customisation as per your requirements. To learn more, feel free to contact us on sales@6wresearch.com
1 Executive Summary |
2 Introduction |
2.1 Key Highlights of the Report |
2.2 Report Description |
2.3 Market Scope & Segmentation |
2.4 Research Methodology |
2.5 Assumptions |
3 Cape Verde Candy Market Overview |
3.1 Cape Verde Country Macro Economic Indicators |
3.2 Cape Verde Candy Market Revenues & Volume, 2021 & 2031F |
3.3 Cape Verde Candy Market - Industry Life Cycle |
3.4 Cape Verde Candy Market - Porter's Five Forces |
3.5 Cape Verde Candy Market Revenues & Volume Share, By Product Type, 2021 & 2031F |
3.6 Cape Verde Candy Market Revenues & Volume Share, By Distribution, 2021 & 2031F |
4 Cape Verde Candy Market Dynamics |
4.1 Impact Analysis |
4.2 Market Drivers |
4.2.1 Increasing disposable income in Cape Verde leading to higher purchasing power for candies |
4.2.2 Growing trend of gifting candies during festivals and celebrations in Cape Verde |
4.2.3 Rising tourism industry in Cape Verde boosting demand for locally produced candies |
4.3 Market Restraints |
4.3.1 Fluctuating raw material prices affecting production costs of candies in Cape Verde |
4.3.2 Competition from imported candies impacting the market share of local candy manufacturers |
5 Cape Verde Candy Market Trends |
6 Cape Verde Candy Market Segmentations |
6.1 Cape Verde Candy Market, By Product Type |
6.1.1 Overview and Analysis |
6.1.2 Cape Verde Candy Market Revenues & Volume, By Chocolate Candy, 2021-2031F |
6.1.3 Cape Verde Candy Market Revenues & Volume, By Non-Chocolate Candy, 2021-2031F |
6.2 Cape Verde Candy Market, By Distribution |
6.2.1 Overview and Analysis |
6.2.2 Cape Verde Candy Market Revenues & Volume, By Supermarkets and Hypermarkets, 2021-2031F |
6.2.3 Cape Verde Candy Market Revenues & Volume, By Convenience Stores, 2021-2031F |
6.2.4 Cape Verde Candy Market Revenues & Volume, By Specialist Retailers, 2021-2031F |
6.2.5 Cape Verde Candy Market Revenues & Volume, By Online Retail, 2021-2031F |
6.2.6 Cape Verde Candy Market Revenues & Volume, By Others, 2021-2031F |
7 Cape Verde Candy Market Import-Export Trade Statistics |
7.1 Cape Verde Candy Market Export to Major Countries |
7.2 Cape Verde Candy Market Imports from Major Countries |
8 Cape Verde Candy Market Key Performance Indicators |
8.1 Average spend per capita on candies in Cape Verde |
8.2 Number of new candy product launches in the market |
8.3 Percentage growth in the number of candy stores or outlets in Cape Verde |
9 Cape Verde Candy Market - Opportunity Assessment |
9.1 Cape Verde Candy Market Opportunity Assessment, By Product Type, 2021 & 2031F |
9.2 Cape Verde Candy Market Opportunity Assessment, By Distribution, 2021 & 2031F |
10 Cape Verde Candy Market - Competitive Landscape |
10.1 Cape Verde Candy Market Revenue Share, By Companies, 2024 |
10.2 Cape Verde Candy Market Competitive Benchmarking, By Operating and Technical Parameters |
11 Company Profiles |
12 Recommendations | 13 Disclaimer |
Export potential assessment - trade Analytics for 2030
Export potential enables firms to identify high-growth global markets with greater confidence by combining advanced trade intelligence with a structured quantitative methodology. The framework analyzes emerging demand trends and country-level import patterns while integrating macroeconomic and trade datasets such as GDP and population forecasts, bilateral import–export flows, tariff structures, elasticity differentials between developed and developing economies, geographic distance, and import demand projections. Using weighted trade values from 2020–2024 as the base period to project country-to-country export potential for 2030, these inputs are operationalized through calculated drivers such as gravity model parameters, tariff impact factors, and projected GDP per-capita growth. Through an analysis of hidden potentials, demand hotspots, and market conditions that are most favorable to success, this method enables firms to focus on target countries, maximize returns, and global expansion with data, backed by accuracy.
By factoring in the projected importer demand gap that is currently unmet and could be potential opportunity, it identifies the potential for the Exporter (Country) among 190 countries, against the general trade analysis, which identifies the biggest importer or exporter.
To discover high-growth global markets and optimize your business strategy:
Click Here
Pricing
- Single User License$ 1,995
- Department License$ 2,400
- Site License$ 3,120
- Global License$ 3,795

Search
Thought Leadership and Analyst Meet


Our Clients
Related Reports
- India Kids Watches Market (2026-2032) | Strategy, Consumer Insights, Analysis, Investment Trends, Opportunities, Growth, Size, Share, Industry, Revenue, Segments, Value, Segmentation, Supply, Forecast, Restraints, Outlook, Competition, Drivers, Trends, Demand, Pricing Analysis, Competitive, Strategic Insights, Companies, Challenges
- Saudi Arabia Core Assurance Service Market (2025-2031) | Strategy, Consumer Insights, Analysis, Investment Trends, Opportunities, Growth, Size, Share, Industry, Revenue, Segments, Value, Segmentation, Supply, Forecast, Restraints, Outlook, Competition, Drivers, Trends, Demand, Pricing Analysis, Competitive, Strategic Insights, Companies, Challenges
- Romania Uninterruptible Power Supply (UPS) Market (2026-2032) | Industry, Analysis, Revenue, Size, Forecast, Outlook, Value, Trends, Share, Growth & Companies
- Saudi Arabia Car Window Tinting Film, Paint Protection Film (PPF), and Ceramic Coating Market (2025-2031) | Strategy, Consumer Insights, Analysis, Investment Trends, Opportunities, Growth, Size, Share, Industry, Revenue, Segments, Value, Segmentation, Supply, Forecast, Restraints, Outlook, Competition, Drivers, Trends, Demand, Pricing Analysis, Competitive, Strategic Insights, Companies, Challenges
- South Africa Stationery Market (2025-2031) | Share, Size, Industry, Value, Growth, Revenue, Analysis, Trends, Segmentation & Outlook
- Afghanistan Rocking Chairs And Adirondack Chairs Market (2026-2032) | Size & Revenue, Competitive Landscape, Share, Segmentation, Industry, Value, Outlook, Analysis, Trends, Growth, Forecast, Companies
- Afghanistan Apparel Market (2026-2032) | Growth, Outlook, Industry, Segmentation, Forecast, Size, Companies, Trends, Value, Share, Analysis & Revenue
- Canada Oil and Gas Market (2026-2032) | Share, Segmentation, Value, Industry, Trends, Forecast, Analysis, Size & Revenue, Growth, Competitive Landscape, Outlook, Companies
- Germany Breakfast Food Market (2026-2032) | Industry, Share, Growth, Size, Companies, Value, Analysis, Revenue, Trends, Forecast & Outlook
- Australia Briquette Market (2025-2031) | Growth, Size, Revenue, Forecast, Analysis, Trends, Value, Share, Industry & Companies
Industry Events and Analyst Meet

Smart Production Solutions Guangzhou 2026

Stationery & Paper Expo Saudi Arabia 2026

Kids & Toys Expo Saudi Arabia 2026

Gifts & Homeware Expo Saudi Arabia 2026

Smart Home Expo 2026
Whitepaper
- Middle East & Africa Commercial Security Market Click here to view more.
- Middle East & Africa Fire Safety Systems & Equipment Market Click here to view more.
- GCC Drone Market Click here to view more.
- Middle East Lighting Fixture Market Click here to view more.
- GCC Physical & Perimeter Security Market Click here to view more.
6WResearch In News
- Doha a strategic location for EV manufacturing hub: IPA Qatar
- Demand for luxury TVs surging in the GCC, says Samsung
- Empowering Growth: The Thriving Journey of Bangladesh’s Cable Industry
- Demand for luxury TVs surging in the GCC, says Samsung
- Video call with a traditional healer? Once unthinkable, it’s now common in South Africa
- Intelligent Buildings To Smooth GCC’s Path To Net Zero