Cape Verde Inks Market (2025-2031) | Segmentation, Trends, Size, Companies, Analysis, Value, Revenue, Forecast, Share, Industry, Outlook & Growth
Market Forecast By Type (Non-printing, Printing), By Formulating Technology (Oil-based, Solvent-based, Water-based, UV-cured, Others), By Applications (Packaging, Publication & Commercial, Security, Ceramic Tiles, Tags & Labels, Textiles, Consumer) And Competitive Landscape
| Product Code: ETC5523487 | Publication Date: Nov 2023 | Updated Date: Nov 2025 | Product Type: Market Research Report | |
| Publisher: 6Wresearch | Author: Vasudha | No. of Pages: 60 | No. of Figures: 30 | No. of Tables: 5 |
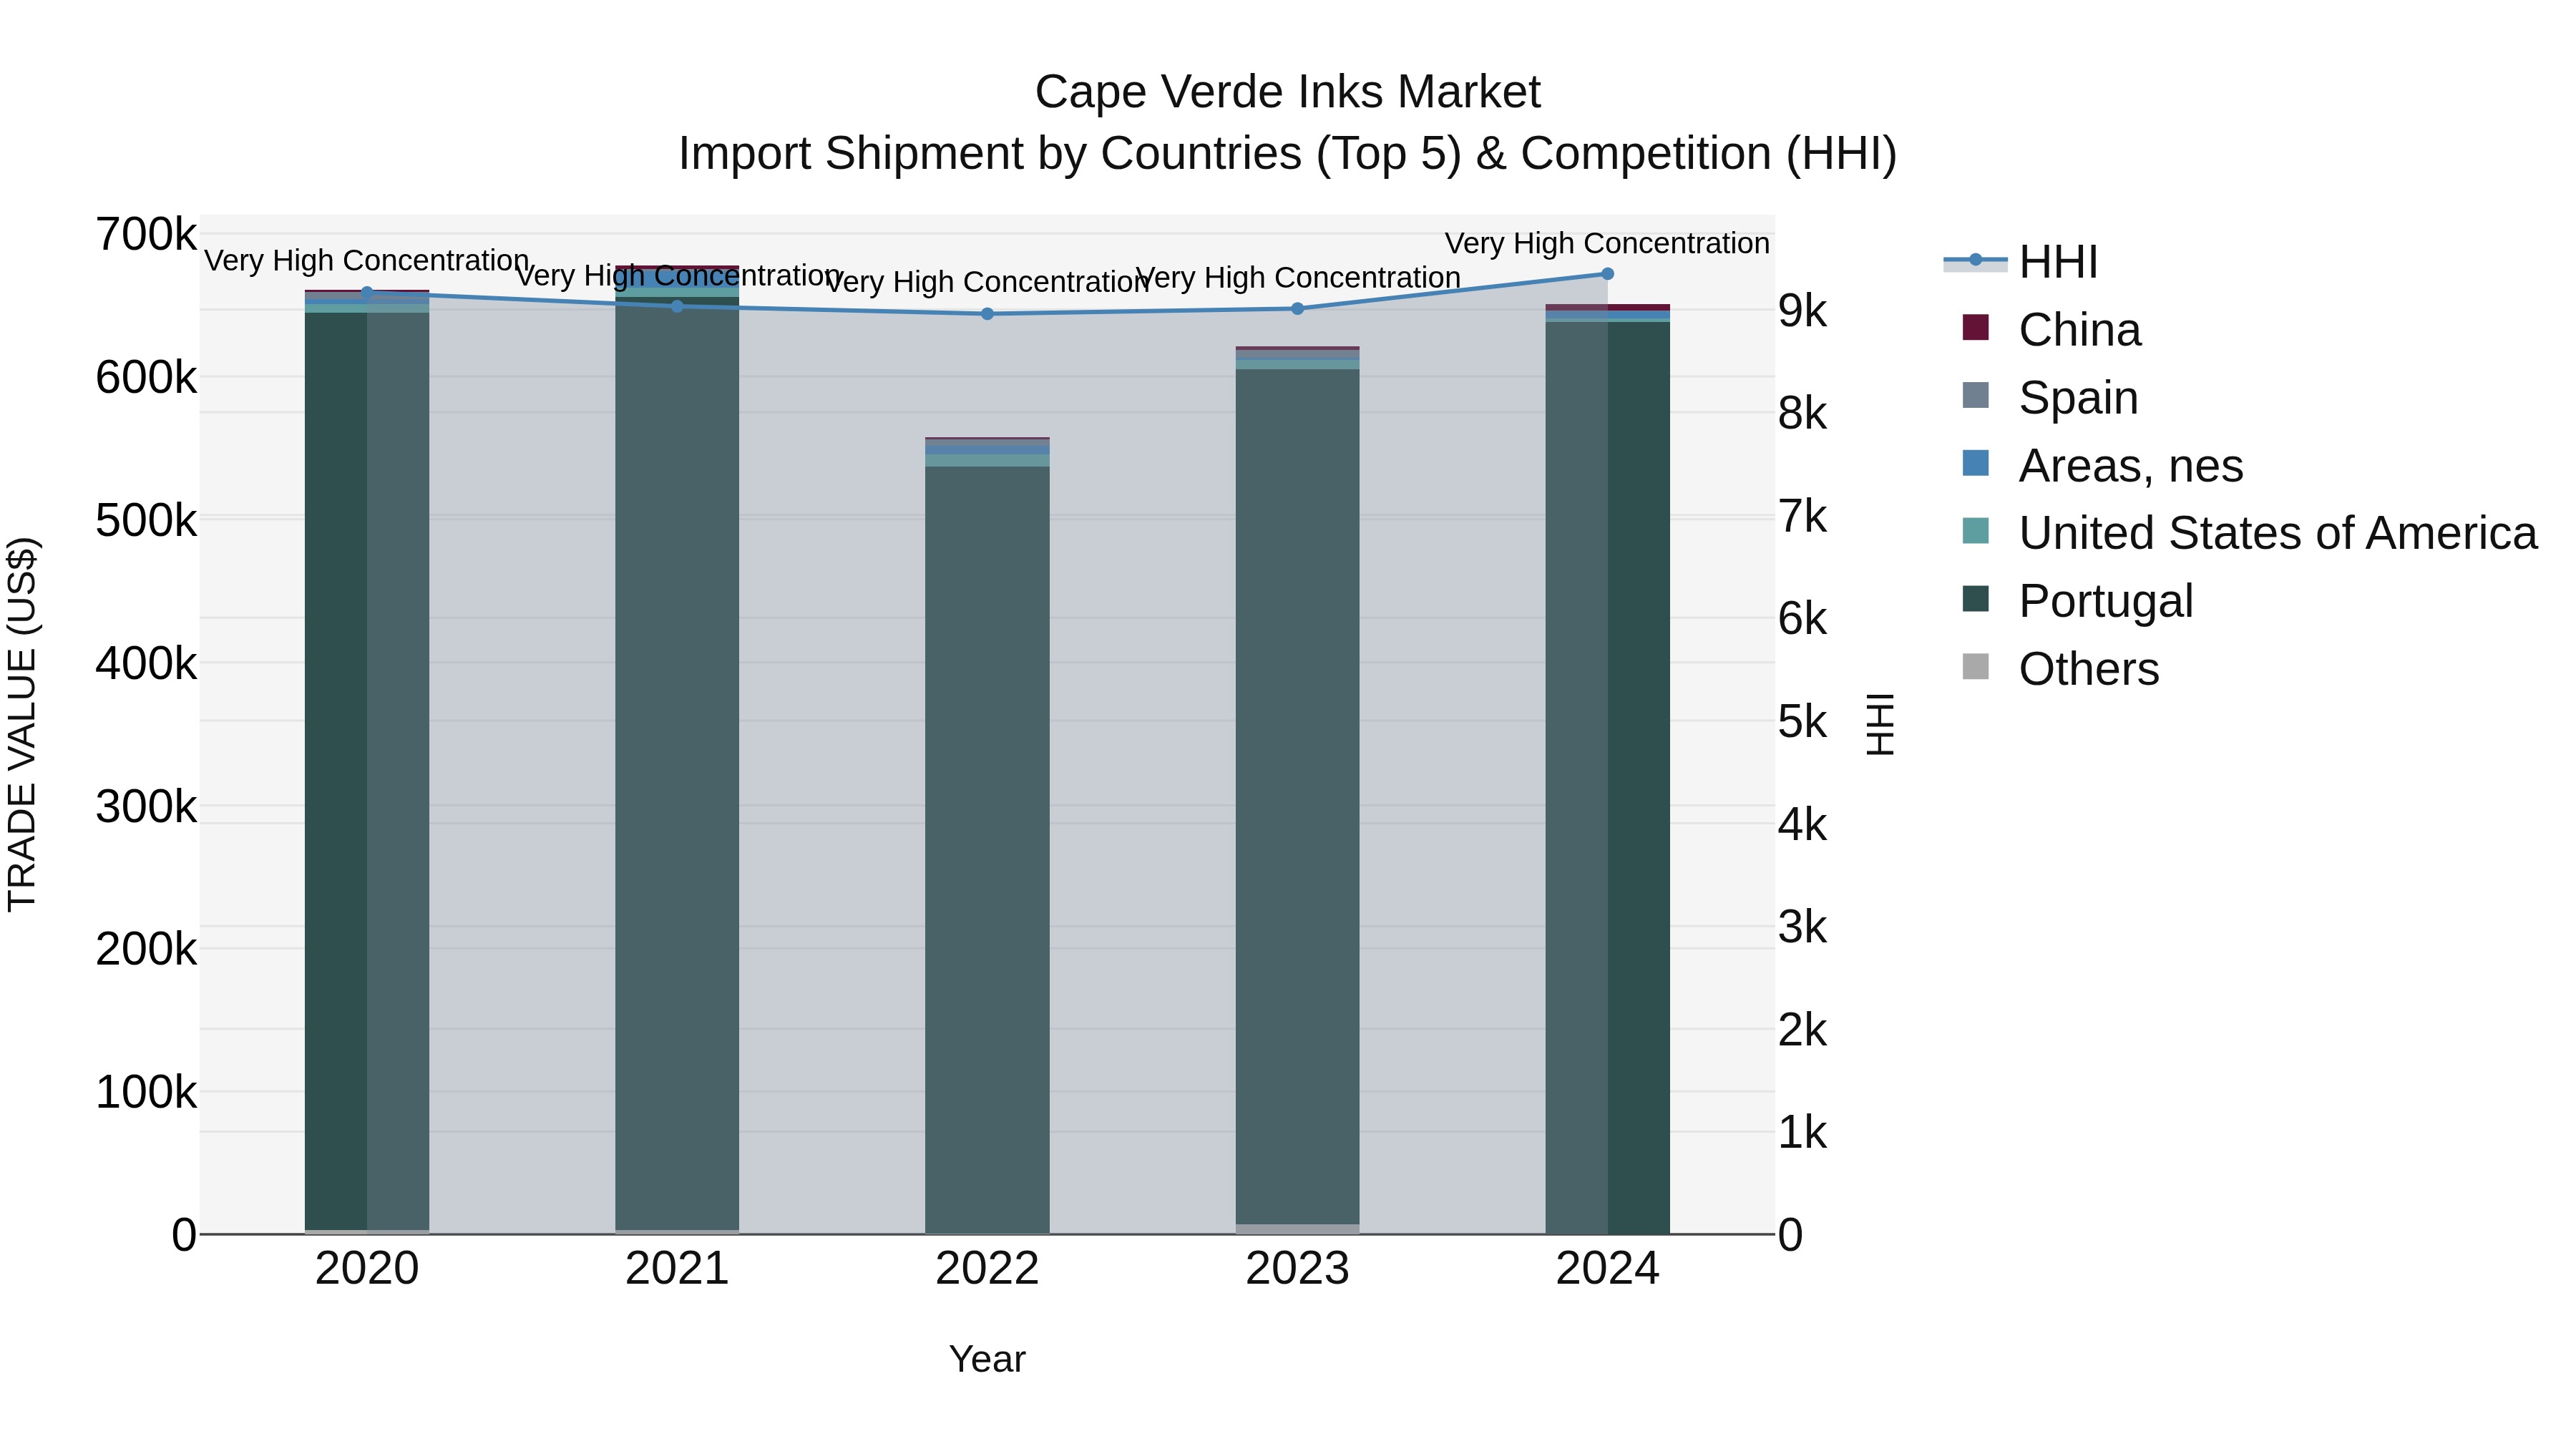
Cape Verde Inks Market: Top 5 Importing Countries and Market Competition (HHI) Analysis
In 2024, Cape Verde continued to heavily rely on ink imports, with top exporters being Portugal, Areas, nes, China, USA, and Spain. The market showed high concentration levels, indicating limited diversity in suppliers. However, the negative CAGR from 2020-24 suggests a slight decline in overall ink import demand. On a positive note, the growth rate in 2024 improved by 4.79%, indicating a potential rebound in the market. Cape Verde may need to diversify its ink import sources to mitigate risks associated with high concentration levels and declining demand trends.
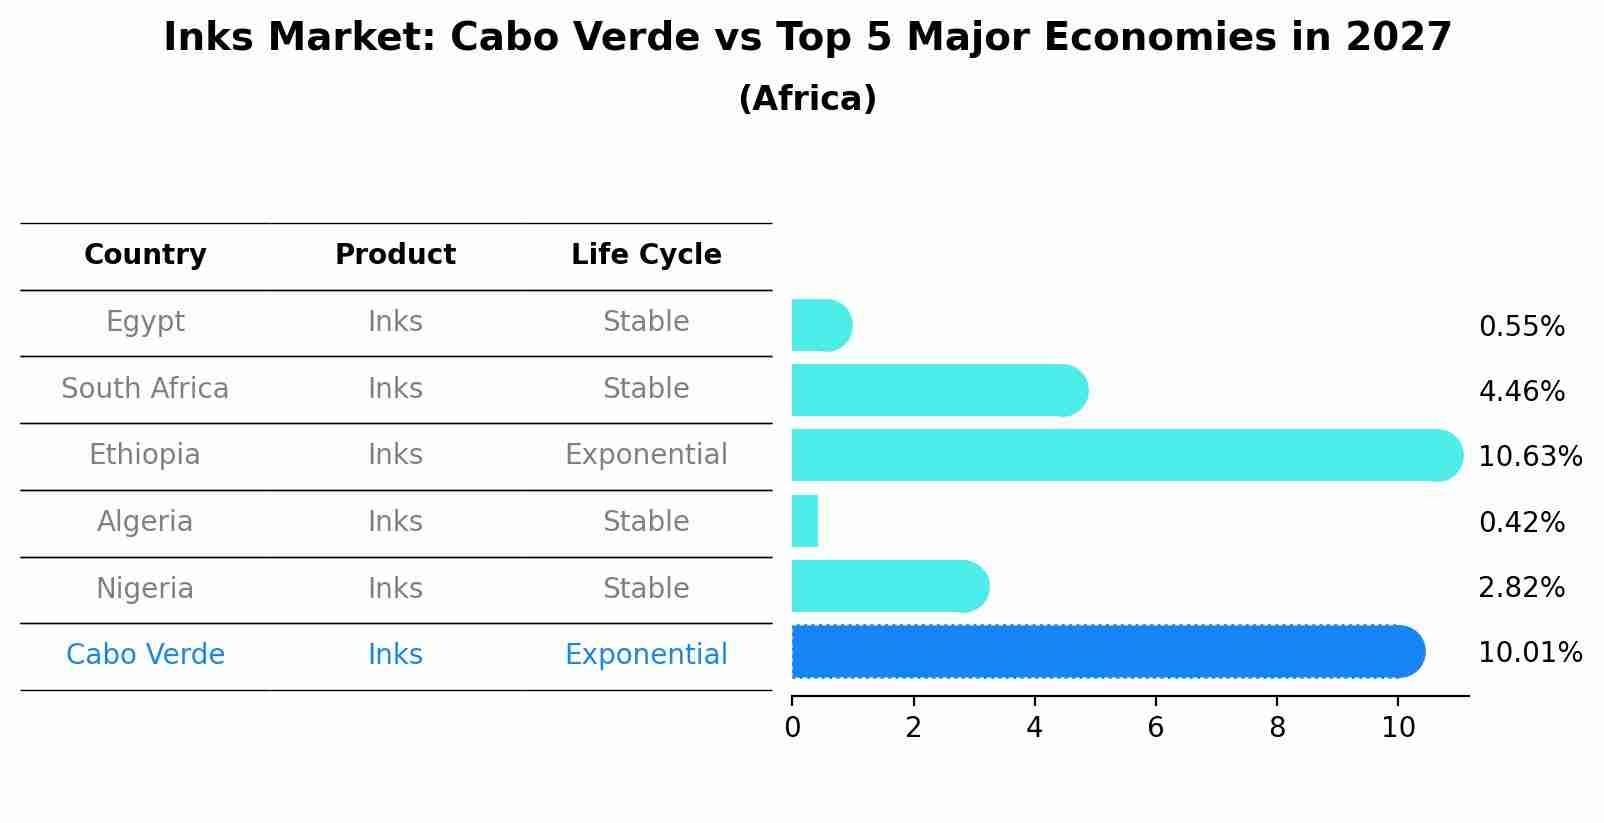
Inks Market: Cabo Verde vs Top 5 Major Economies in 2027 (Africa)
The Inks market in Cabo Verde is projected to grow at a high growth rate of 10.01% by 2027, within the Africa region led by Egypt, along with other countries like South Africa, Ethiopia, Algeria and Nigeria, collectively shaping a dynamic and evolving market environment driven by innovation and increasing adoption of emerging technologies.
Cape Verde Inks Market Overview
The Cape Verde Inks Market encompasses a wide range of printing inks used in various applications, from commercial printing to packaging. Growth in this market is propelled by technological advancements in ink formulations that offer higher quality and faster drying times. The rise of digital printing has further boosted demand for specialized inks that cater to different substrates and printing technologies.
Drivers of the market
The demand for specialty inks, such as UV-cured, solvent-based, and water-based inks, is increasing due to their wide range of applications and environmental benefits. Growth in the textile, packaging, and commercial printing sectors also contributes to market expansion. Furthermore, innovations in ink formulations and a shift towards sustainable and eco-friendly inks are driving market dynamics.
Challenges of the market
Similar to the broader ink market, the Cape Verde Inks Market is hindered by a dependency on imports, which affects pricing and availability. The market also faces challenges related to regulatory compliance, particularly in terms of environmental standards. Additionally, fluctuating raw material prices and the need for continuous innovation to meet diverse customer preferences pose significant hurdles.
Government Policy of the market
In the broader inks market, government policies emphasize safety and environmental compliance. There are strict guidelines on labeling and chemical composition to ensure consumer safety. Moreover, the government has initiated programs to encourage the recycling of ink cartridges and the use of water-based inks to minimize environmental harm.
Key Highlights of the Report:
- Cape Verde Inks Market Outlook
- Market Size of Cape Verde Inks Market, 2024
- Forecast of Cape Verde Inks Market, 2031
- Historical Data and Forecast of Cape Verde Inks Revenues & Volume for the Period 2021-2031
- Cape Verde Inks Market Trend Evolution
- Cape Verde Inks Market Drivers and Challenges
- Cape Verde Inks Price Trends
- Cape Verde Inks Porter`s Five Forces
- Cape Verde Inks Industry Life Cycle
- Historical Data and Forecast of Cape Verde Inks Market Revenues & Volume By Type for the Period 2021-2031
- Historical Data and Forecast of Cape Verde Inks Market Revenues & Volume By Non-printing for the Period 2021-2031
- Historical Data and Forecast of Cape Verde Inks Market Revenues & Volume By Printing for the Period 2021-2031
- Historical Data and Forecast of Cape Verde Inks Market Revenues & Volume By Formulating Technology for the Period 2021-2031
- Historical Data and Forecast of Cape Verde Inks Market Revenues & Volume By Oil-based for the Period 2021-2031
- Historical Data and Forecast of Cape Verde Inks Market Revenues & Volume By Solvent-based for the Period 2021-2031
- Historical Data and Forecast of Cape Verde Inks Market Revenues & Volume By Water-based for the Period 2021-2031
- Historical Data and Forecast of Cape Verde Inks Market Revenues & Volume By UV-cured for the Period 2021-2031
- Historical Data and Forecast of Cape Verde Inks Market Revenues & Volume By Others for the Period 2021-2031
- Historical Data and Forecast of Cape Verde Inks Market Revenues & Volume By Applications for the Period 2021-2031
- Historical Data and Forecast of Cape Verde Inks Market Revenues & Volume By Packaging for the Period 2021-2031
- Historical Data and Forecast of Cape Verde Inks Market Revenues & Volume By Publication & Commercial for the Period 2021-2031
- Historical Data and Forecast of Cape Verde Inks Market Revenues & Volume By Security for the Period 2021-2031
- Historical Data and Forecast of Cape Verde Inks Market Revenues & Volume By Ceramic Tiles for the Period 2021-2031
- Historical Data and Forecast of Cape Verde Inks Market Revenues & Volume By Tags & Labels for the Period 2021-2031
- Historical Data and Forecast of Cape Verde Inks Market Revenues & Volume By Textiles for the Period 2021-2031
- Historical Data and Forecast of Cape Verde Inks Market Revenues & Volume By Consumer for the Period 2021-2031
- Cape Verde Inks Import Export Trade Statistics
- Market Opportunity Assessment By Type
- Market Opportunity Assessment By Formulating Technology
- Market Opportunity Assessment By Applications
- Cape Verde Inks Top Companies Market Share
- Cape Verde Inks Competitive Benchmarking By Technical and Operational Parameters
- Cape Verde Inks Company Profiles
- Cape Verde Inks Key Strategic Recommendations
Frequently Asked Questions About the Market Study (FAQs):
6Wresearch actively monitors the Cape Verde Inks Market and publishes its comprehensive annual report, highlighting emerging trends, growth drivers, revenue analysis, and forecast outlook. Our insights help businesses to make data-backed strategic decisions with ongoing market dynamics. Our analysts track relevent industries related to the Cape Verde Inks Market, allowing our clients with actionable intelligence and reliable forecasts tailored to emerging regional needs.
Yes, we provide customisation as per your requirements. To learn more, feel free to contact us on sales@6wresearch.com
1 Executive Summary |
2 Introduction |
2.1 Key Highlights of the Report |
2.2 Report Description |
2.3 Market Scope & Segmentation |
2.4 Research Methodology |
2.5 Assumptions |
3 Cape Verde Inks Market Overview |
3.1 Cape Verde Country Macro Economic Indicators |
3.2 Cape Verde Inks Market Revenues & Volume, 2021 & 2031F |
3.3 Cape Verde Inks Market - Industry Life Cycle |
3.4 Cape Verde Inks Market - Porter's Five Forces |
3.5 Cape Verde Inks Market Revenues & Volume Share, By Type, 2021 & 2031F |
3.6 Cape Verde Inks Market Revenues & Volume Share, By Formulating Technology, 2021 & 2031F |
3.7 Cape Verde Inks Market Revenues & Volume Share, By Applications, 2021 & 2031F |
4 Cape Verde Inks Market Dynamics |
4.1 Impact Analysis |
4.2 Market Drivers |
4.2.1 Growth in the packaging industry in Cape Verde |
4.2.2 Increasing demand for eco-friendly and sustainable inks |
4.2.3 Innovation in ink technology and product development |
4.3 Market Restraints |
4.3.1 Volatility in raw material prices |
4.3.2 Competition from imported inks |
4.3.3 Regulatory challenges related to environmental standards and safety regulations |
5 Cape Verde Inks Market Trends |
6 Cape Verde Inks Market Segmentations |
6.1 Cape Verde Inks Market, By Type |
6.1.1 Overview and Analysis |
6.1.2 Cape Verde Inks Market Revenues & Volume, By Non-printing, 2021-2031F |
6.1.3 Cape Verde Inks Market Revenues & Volume, By Printing, 2021-2031F |
6.2 Cape Verde Inks Market, By Formulating Technology |
6.2.1 Overview and Analysis |
6.2.2 Cape Verde Inks Market Revenues & Volume, By Oil-based, 2021-2031F |
6.2.3 Cape Verde Inks Market Revenues & Volume, By Solvent-based, 2021-2031F |
6.2.4 Cape Verde Inks Market Revenues & Volume, By Water-based, 2021-2031F |
6.2.5 Cape Verde Inks Market Revenues & Volume, By UV-cured, 2021-2031F |
6.2.6 Cape Verde Inks Market Revenues & Volume, By Others, 2021-2031F |
6.3 Cape Verde Inks Market, By Applications |
6.3.1 Overview and Analysis |
6.3.2 Cape Verde Inks Market Revenues & Volume, By Packaging, 2021-2031F |
6.3.3 Cape Verde Inks Market Revenues & Volume, By Publication & Commercial, 2021-2031F |
6.3.4 Cape Verde Inks Market Revenues & Volume, By Security, 2021-2031F |
6.3.5 Cape Verde Inks Market Revenues & Volume, By Ceramic Tiles, 2021-2031F |
6.3.6 Cape Verde Inks Market Revenues & Volume, By Tags & Labels, 2021-2031F |
6.3.7 Cape Verde Inks Market Revenues & Volume, By Textiles, 2021-2031F |
7 Cape Verde Inks Market Import-Export Trade Statistics |
7.1 Cape Verde Inks Market Export to Major Countries |
7.2 Cape Verde Inks Market Imports from Major Countries |
8 Cape Verde Inks Market Key Performance Indicators |
8.1 Percentage of revenue from new eco-friendly ink products |
8.2 Research and development investment in ink technology |
8.3 Customer satisfaction and loyalty metrics |
8.4 Percentage of repeat business from key clients |
8.5 Market penetration of locally produced inks |
9 Cape Verde Inks Market - Opportunity Assessment |
9.1 Cape Verde Inks Market Opportunity Assessment, By Type, 2021 & 2031F |
9.2 Cape Verde Inks Market Opportunity Assessment, By Formulating Technology, 2021 & 2031F |
9.3 Cape Verde Inks Market Opportunity Assessment, By Applications, 2021 & 2031F |
10 Cape Verde Inks Market - Competitive Landscape |
10.1 Cape Verde Inks Market Revenue Share, By Companies, 2024 |
10.2 Cape Verde Inks Market Competitive Benchmarking, By Operating and Technical Parameters |
11 Company Profiles |
12 Recommendations | 13 Disclaimer |
Global Go To Market Strategy - 2030
Export potential enables firms to identify high-growth global markets with greater confidence by combining advanced trade intelligence with a structured quantitative methodology. The framework analyzes emerging demand trends and country-level import patterns while integrating macroeconomic and trade datasets such as GDP and population forecasts, bilateral import–export flows, tariff structures, elasticity differentials between developed and developing economies, geographic distance, and import demand projections. Using weighted trade values from 2020–2024 as the base period to project country-to-country export potential for 2030, these inputs are operationalized through calculated drivers such as gravity model parameters, tariff impact factors, and projected GDP per-capita growth. Through an analysis of hidden potentials, demand hotspots, and market conditions that are most favorable to success, this method enables firms to focus on target countries, maximize returns, and global expansion with data, backed by accuracy.
By factoring in the projected importer demand gap that is currently unmet and could be potential opportunity, it identifies the potential for the Exporter (Country) among 190 countries, against the general trade analysis, which identifies the biggest importer or exporter.
To discover high-growth global markets and optimize your business strategy:
Click Here
Pricing
- Single User License$ 1,995
- Department License$ 2,400
- Site License$ 3,120
- Global License$ 3,795

Leadership Perspectives from Industry Events
Search
Thought Leadership and Analyst Meet


Our Clients
6WResearch In News
- India Export Attractiveness Tracker 2026
- India Air Conditioner Market Set for Strong Rebound in 2026 After Weather-Led Correction and GST-Driven Recovery: 6Wresearch
- ADAS in India: How Automatic Emergency Braking, Blind Spot Detection & Driver Monitoring are Transforming Road Safety
- Doha a strategic location for EV manufacturing hub: IPA Qatar
- Demand for luxury TVs surging in the GCC, says Samsung
- Empowering Growth: The Thriving Journey of Bangladesh’s Cable Industry
Latest Reports
- Nicaragua RPG Gaming Market (2026-2032)
- New Zealand RPG Gaming Market (2026-2032)
- Netherlands RPG Gaming Market (2026-2032)
- Nauru RPG Gaming Market (2026-2032)
- Namibia RPG Gaming Market (2026-2032)
- Mozambique RPG Gaming Market (2026-2032)
- Montenegro RPG Gaming Market (2026-2032)
- Mongolia RPG Gaming Market (2026-2032)
- Monaco RPG Gaming Market (2026-2032)
- Micronesia RPG Gaming Market (2026-2032)
Industry Events and Analyst Meet

EV India Expo 2026

HIMTEX 2026

India Refining Summit 2026

India EV Show 2026

EV tech India Expo 2026
Whitepaper
- Middle East & Africa Commercial Security Market Click here to view more.
- Middle East & Africa Fire Safety Systems & Equipment Market Click here to view more.
- GCC Drone Market Click here to view more.
- Middle East Lighting Fixture Market Click here to view more.
- GCC Physical & Perimeter Security Market Click here to view more.