Cape Verde Non-alcoholic Drink Market (2025-2031) | Outlook, Analysis, Value, Trends, Size, Companies, Forecast, Revenue, Segmentation, Growth, Industry & Share
Market Forecast By Product Types (CarbonatedDrinks, Non-CarbonatedDrinks), By Distribution Channel (Online, Offline) And Competitive Landscape
| Product Code: ETC5078754 | Publication Date: Nov 2023 | Updated Date: Nov 2025 | Product Type: Market Research Report | |
| Publisher: 6Wresearch | Author: Sachin Kumar Rai | No. of Pages: 60 | No. of Figures: 30 | No. of Tables: 5 |
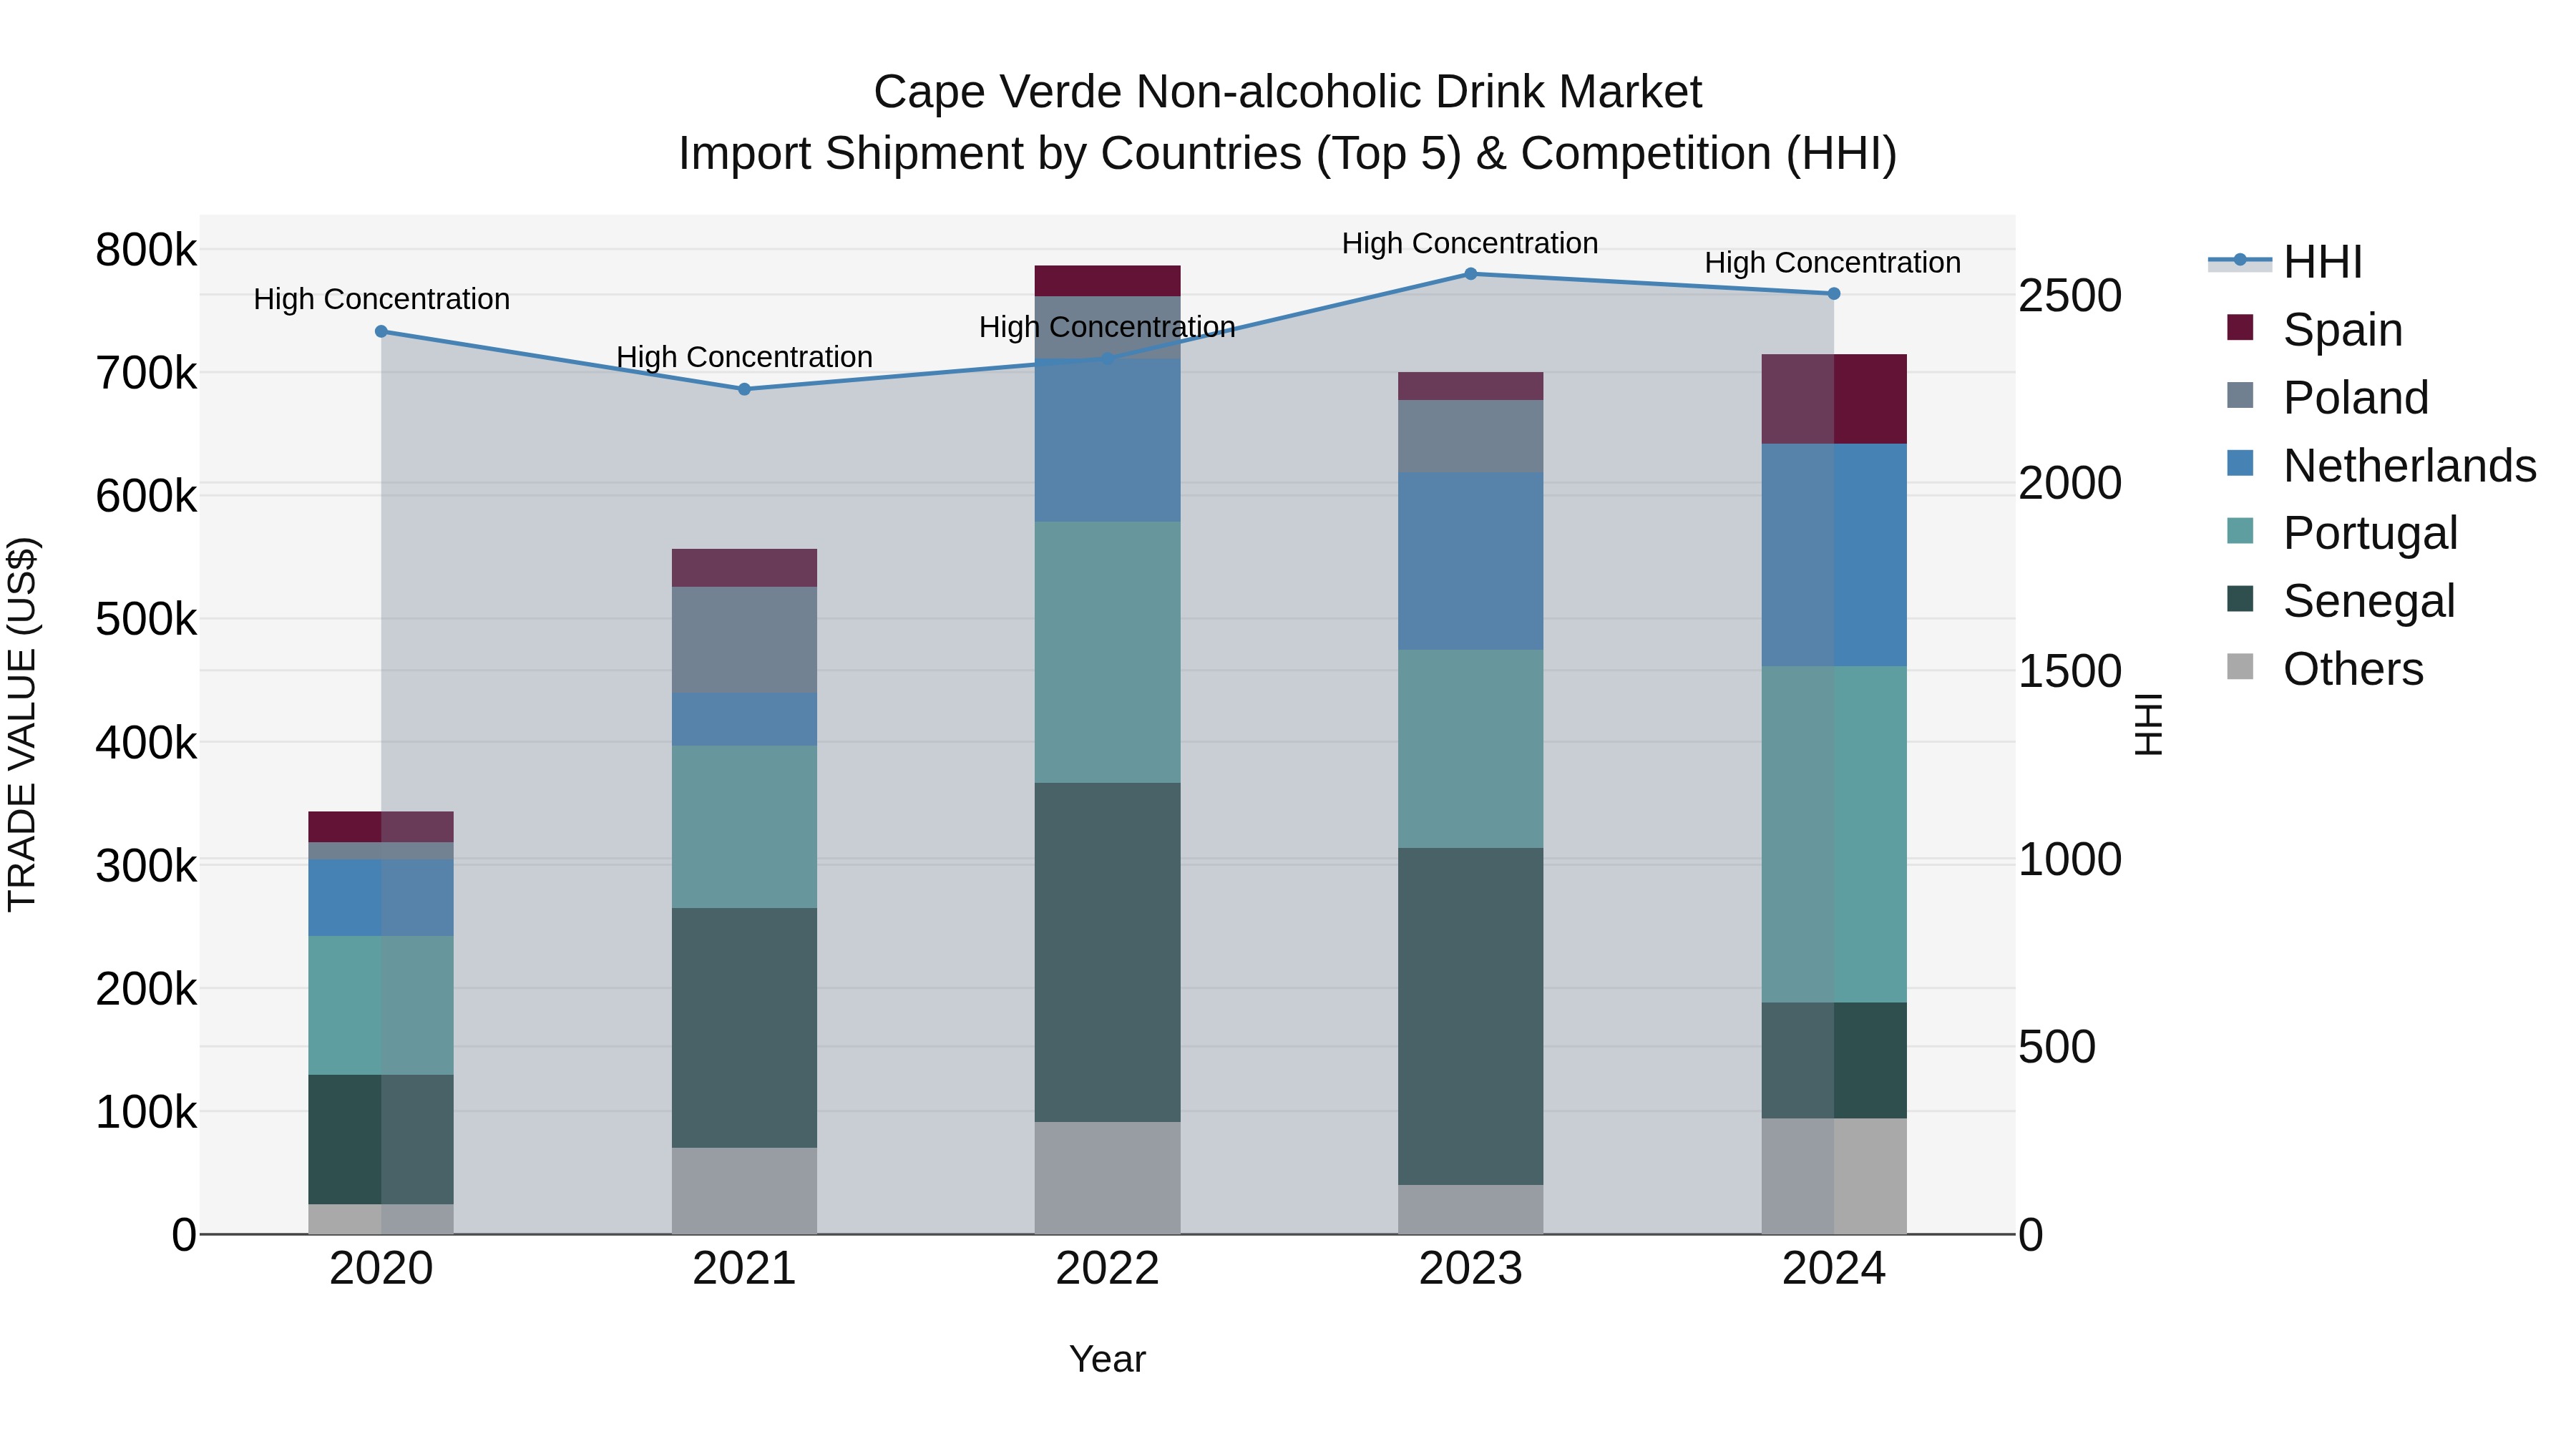
Cape Verde Non-alcoholic Drink Market: Top 5 Importing Countries and Market Competition (HHI) Analysis
Cape Verde continues to see a steady growth in non-alcoholic drink imports, with key suppliers including Portugal, Netherlands, Senegal, French Polynesia, and Spain. The high Herfindahl-Hirschman Index (HHI) indicates a concentrated market, while the impressive Compound Annual Growth Rate (CAGR) of 20.09% from 2020 to 2024 underscores the increasing demand for non-alcoholic beverages in the region. Despite a slight dip in the growth rate from 2023 to 2024, the market remains robust, presenting opportunities for both local businesses and international exporters in the non-alcoholic drink sector.
Cape Verde Non-alcoholic Drink Market Overview
This market covers the production and sale of non-alcoholic beverages, including soft drinks, juices, and bottled water. The market is driven by growing health consciousness among consumers and a preference for beverages that offer functional benefits.
Drivers of the market
The Cape Verde non-alcoholic drink market is expanding due to the increasing consumer preference for healthier and alcohol-free beverage options. Non-alcoholic drinks, including soft drinks, fruit juices, and flavored waters, are popular for their refreshing taste and lower calorie content compared to alcoholic beverages. The growing health and wellness trend, rising awareness about the effects of alcohol consumption, and the demand for diverse and innovative beverage options drive the market. Additionally, advancements in drink formulations and the introduction of new flavors and ingredients contribute to market growth.
Challenges of the market
The non-alcoholic drink market in Cape Verde is constrained by limited local production facilities and high import costs for beverages. There is also a lack of consumer awareness about the variety and benefits of non-alcoholic drinks. Additionally, the market faces challenges related to distribution and marketing, as well as competition from alcoholic beverages.
Government Policy of the market
The government may support the non-alcoholic drink market by promoting the development and consumption of healthy beverage options. Policies could include setting regulations for product quality and safety, providing incentives for local producers, and supporting the development of innovative non-alcoholic drink products to meet consumer demand.
Key Highlights of the Report:
- Cape Verde Non-alcoholic Drink Market Outlook
- Market Size of Cape Verde Non-alcoholic Drink Market, 2024
- Forecast of Cape Verde Non-alcoholic Drink Market, 2031
- Historical Data and Forecast of Cape Verde Non-alcoholic Drink Revenues & Volume for the Period 2021-2031
- Cape Verde Non-alcoholic Drink Market Trend Evolution
- Cape Verde Non-alcoholic Drink Market Drivers and Challenges
- Cape Verde Non-alcoholic Drink Price Trends
- Cape Verde Non-alcoholic Drink Porter`s Five Forces
- Cape Verde Non-alcoholic Drink Industry Life Cycle
- Historical Data and Forecast of Cape Verde Non-alcoholic Drink Market Revenues & Volume By Product Types for the Period 2021-2031
- Historical Data and Forecast of Cape Verde Non-alcoholic Drink Market Revenues & Volume By CarbonatedDrinks for the Period 2021-2031
- Historical Data and Forecast of Cape Verde Non-alcoholic Drink Market Revenues & Volume By Non-CarbonatedDrinks for the Period 2021-2031
- Historical Data and Forecast of Cape Verde Non-alcoholic Drink Market Revenues & Volume By Distribution Channel for the Period 2021-2031
- Historical Data and Forecast of Cape Verde Non-alcoholic Drink Market Revenues & Volume By Online for the Period 2021-2031
- Historical Data and Forecast of Cape Verde Non-alcoholic Drink Market Revenues & Volume By Offline for the Period 2021-2031
- Cape Verde Non-alcoholic Drink Import Export Trade Statistics
- Market Opportunity Assessment By Product Types
- Market Opportunity Assessment By Distribution Channel
- Cape Verde Non-alcoholic Drink Top Companies Market Share
- Cape Verde Non-alcoholic Drink Competitive Benchmarking By Technical and Operational Parameters
- Cape Verde Non-alcoholic Drink Company Profiles
- Cape Verde Non-alcoholic Drink Key Strategic Recommendations
Frequently Asked Questions About the Market Study (FAQs):
6Wresearch actively monitors the Cape Verde Non-alcoholic Drink Market and publishes its comprehensive annual report, highlighting emerging trends, growth drivers, revenue analysis, and forecast outlook. Our insights help businesses to make data-backed strategic decisions with ongoing market dynamics. Our analysts track relevent industries related to the Cape Verde Non-alcoholic Drink Market, allowing our clients with actionable intelligence and reliable forecasts tailored to emerging regional needs.
Yes, we provide customisation as per your requirements. To learn more, feel free to contact us on sales@6wresearch.com
1 Executive Summary |
2 Introduction |
2.1 Key Highlights of the Report |
2.2 Report Description |
2.3 Market Scope & Segmentation |
2.4 Research Methodology |
2.5 Assumptions |
3 Cape Verde Non-alcoholic Drink Market Overview |
3.1 Cape Verde Country Macro Economic Indicators |
3.2 Cape Verde Non-alcoholic Drink Market Revenues & Volume, 2021 & 2031F |
3.3 Cape Verde Non-alcoholic Drink Market - Industry Life Cycle |
3.4 Cape Verde Non-alcoholic Drink Market - Porter's Five Forces |
3.5 Cape Verde Non-alcoholic Drink Market Revenues & Volume Share, By Product Types, 2021 & 2031F |
3.6 Cape Verde Non-alcoholic Drink Market Revenues & Volume Share, By Distribution Channel, 2021 & 2031F |
4 Cape Verde Non-alcoholic Drink Market Dynamics |
4.1 Impact Analysis |
4.2 Market Drivers |
4.2.1 Increasing health consciousness among consumers |
4.2.2 Growing demand for natural and organic beverages |
4.2.3 Rising disposable incomes in Cape Verde |
4.3 Market Restraints |
4.3.1 High competition from established brands |
4.3.2 Fluctuating raw material prices |
5 Cape Verde Non-alcoholic Drink Market Trends |
6 Cape Verde Non-alcoholic Drink Market Segmentations |
6.1 Cape Verde Non-alcoholic Drink Market, By Product Types |
6.1.1 Overview and Analysis |
6.1.2 Cape Verde Non-alcoholic Drink Market Revenues & Volume, By Carbonated? Drinks, 2021-2031F |
6.1.3 Cape Verde Non-alcoholic Drink Market Revenues & Volume, By Non-Carbonated? Drinks, 2021-2031F |
6.2 Cape Verde Non-alcoholic Drink Market, By Distribution Channel |
6.2.1 Overview and Analysis |
6.2.2 Cape Verde Non-alcoholic Drink Market Revenues & Volume, By Online, 2021-2031F |
6.2.3 Cape Verde Non-alcoholic Drink Market Revenues & Volume, By Offline, 2021-2031F |
7 Cape Verde Non-alcoholic Drink Market Import-Export Trade Statistics |
7.1 Cape Verde Non-alcoholic Drink Market Export to Major Countries |
7.2 Cape Verde Non-alcoholic Drink Market Imports from Major Countries |
8 Cape Verde Non-alcoholic Drink Market Key Performance Indicators |
8.1 Consumer engagement on social media platforms |
8.2 Number of new product launches in the market |
8.3 Percentage of distribution coverage across different regions in Cape Verde |
8.4 Customer satisfaction scores from surveys |
8.5 Rate of innovation in product offerings |
9 Cape Verde Non-alcoholic Drink Market - Opportunity Assessment |
9.1 Cape Verde Non-alcoholic Drink Market Opportunity Assessment, By Product Types, 2021 & 2031F |
9.2 Cape Verde Non-alcoholic Drink Market Opportunity Assessment, By Distribution Channel, 2021 & 2031F |
10 Cape Verde Non-alcoholic Drink Market - Competitive Landscape |
10.1 Cape Verde Non-alcoholic Drink Market Revenue Share, By Companies, 2024 |
10.2 Cape Verde Non-alcoholic Drink Market Competitive Benchmarking, By Operating and Technical Parameters |
11 Company Profiles |
12 Recommendations | 13 Disclaimer |
Global Go To Market Strategy - 2030
Export potential enables firms to identify high-growth global markets with greater confidence by combining advanced trade intelligence with a structured quantitative methodology. The framework analyzes emerging demand trends and country-level import patterns while integrating macroeconomic and trade datasets such as GDP and population forecasts, bilateral import–export flows, tariff structures, elasticity differentials between developed and developing economies, geographic distance, and import demand projections. Using weighted trade values from 2020–2024 as the base period to project country-to-country export potential for 2030, these inputs are operationalized through calculated drivers such as gravity model parameters, tariff impact factors, and projected GDP per-capita growth. Through an analysis of hidden potentials, demand hotspots, and market conditions that are most favorable to success, this method enables firms to focus on target countries, maximize returns, and global expansion with data, backed by accuracy.
By factoring in the projected importer demand gap that is currently unmet and could be potential opportunity, it identifies the potential for the Exporter (Country) among 190 countries, against the general trade analysis, which identifies the biggest importer or exporter.
To discover high-growth global markets and optimize your business strategy:
Click Here
Pricing
- Single User License$ 1,995
- Department License$ 2,400
- Site License$ 3,120
- Global License$ 3,795

Leadership Perspectives from Industry Events
Search
Thought Leadership and Analyst Meet


Our Clients
6WResearch In News
- India Export Attractiveness Tracker 2026
- India Air Conditioner Market Set for Strong Rebound in 2026 After Weather-Led Correction and GST-Driven Recovery: 6Wresearch
- ADAS in India: How Automatic Emergency Braking, Blind Spot Detection & Driver Monitoring are Transforming Road Safety
- Doha a strategic location for EV manufacturing hub: IPA Qatar
- Demand for luxury TVs surging in the GCC, says Samsung
- Empowering Growth: The Thriving Journey of Bangladesh’s Cable Industry
Latest Reports
- Nicaragua RPG Gaming Market (2026-2032)
- New Zealand RPG Gaming Market (2026-2032)
- Netherlands RPG Gaming Market (2026-2032)
- Nauru RPG Gaming Market (2026-2032)
- Namibia RPG Gaming Market (2026-2032)
- Mozambique RPG Gaming Market (2026-2032)
- Montenegro RPG Gaming Market (2026-2032)
- Mongolia RPG Gaming Market (2026-2032)
- Monaco RPG Gaming Market (2026-2032)
- Micronesia RPG Gaming Market (2026-2032)
Industry Events and Analyst Meet

EV India Expo 2026

HIMTEX 2026

India Refining Summit 2026

India EV Show 2026

EV tech India Expo 2026
Whitepaper
- Middle East & Africa Commercial Security Market Click here to view more.
- Middle East & Africa Fire Safety Systems & Equipment Market Click here to view more.
- GCC Drone Market Click here to view more.
- Middle East Lighting Fixture Market Click here to view more.
- GCC Physical & Perimeter Security Market Click here to view more.