Cape Verde Processed Food Market (2025-2031) | Outlook, Forecast, Trends, Analysis, Revenue, Segmentation, Share, Size, Industry, Value, Growth & Companies
Market Forecast By Process (Minimally, Highly), By Product type (Plant based, Fruits , Vegetables, Legumes , Extracted foods, Others, Animal based, Milk ), By Application (Baked foods, Baby food, Breakfast Cereal, Biscuits, Cheese, Chocolate confectionary, Ice creams, Instant Noodles) And Competitive Landscape
| Product Code: ETC5208163 | Publication Date: Nov 2023 | Updated Date: Nov 2025 | Product Type: Market Research Report | |
| Publisher: 6Wresearch | Author: Bhawna Singh | No. of Pages: 60 | No. of Figures: 30 | No. of Tables: 5 |
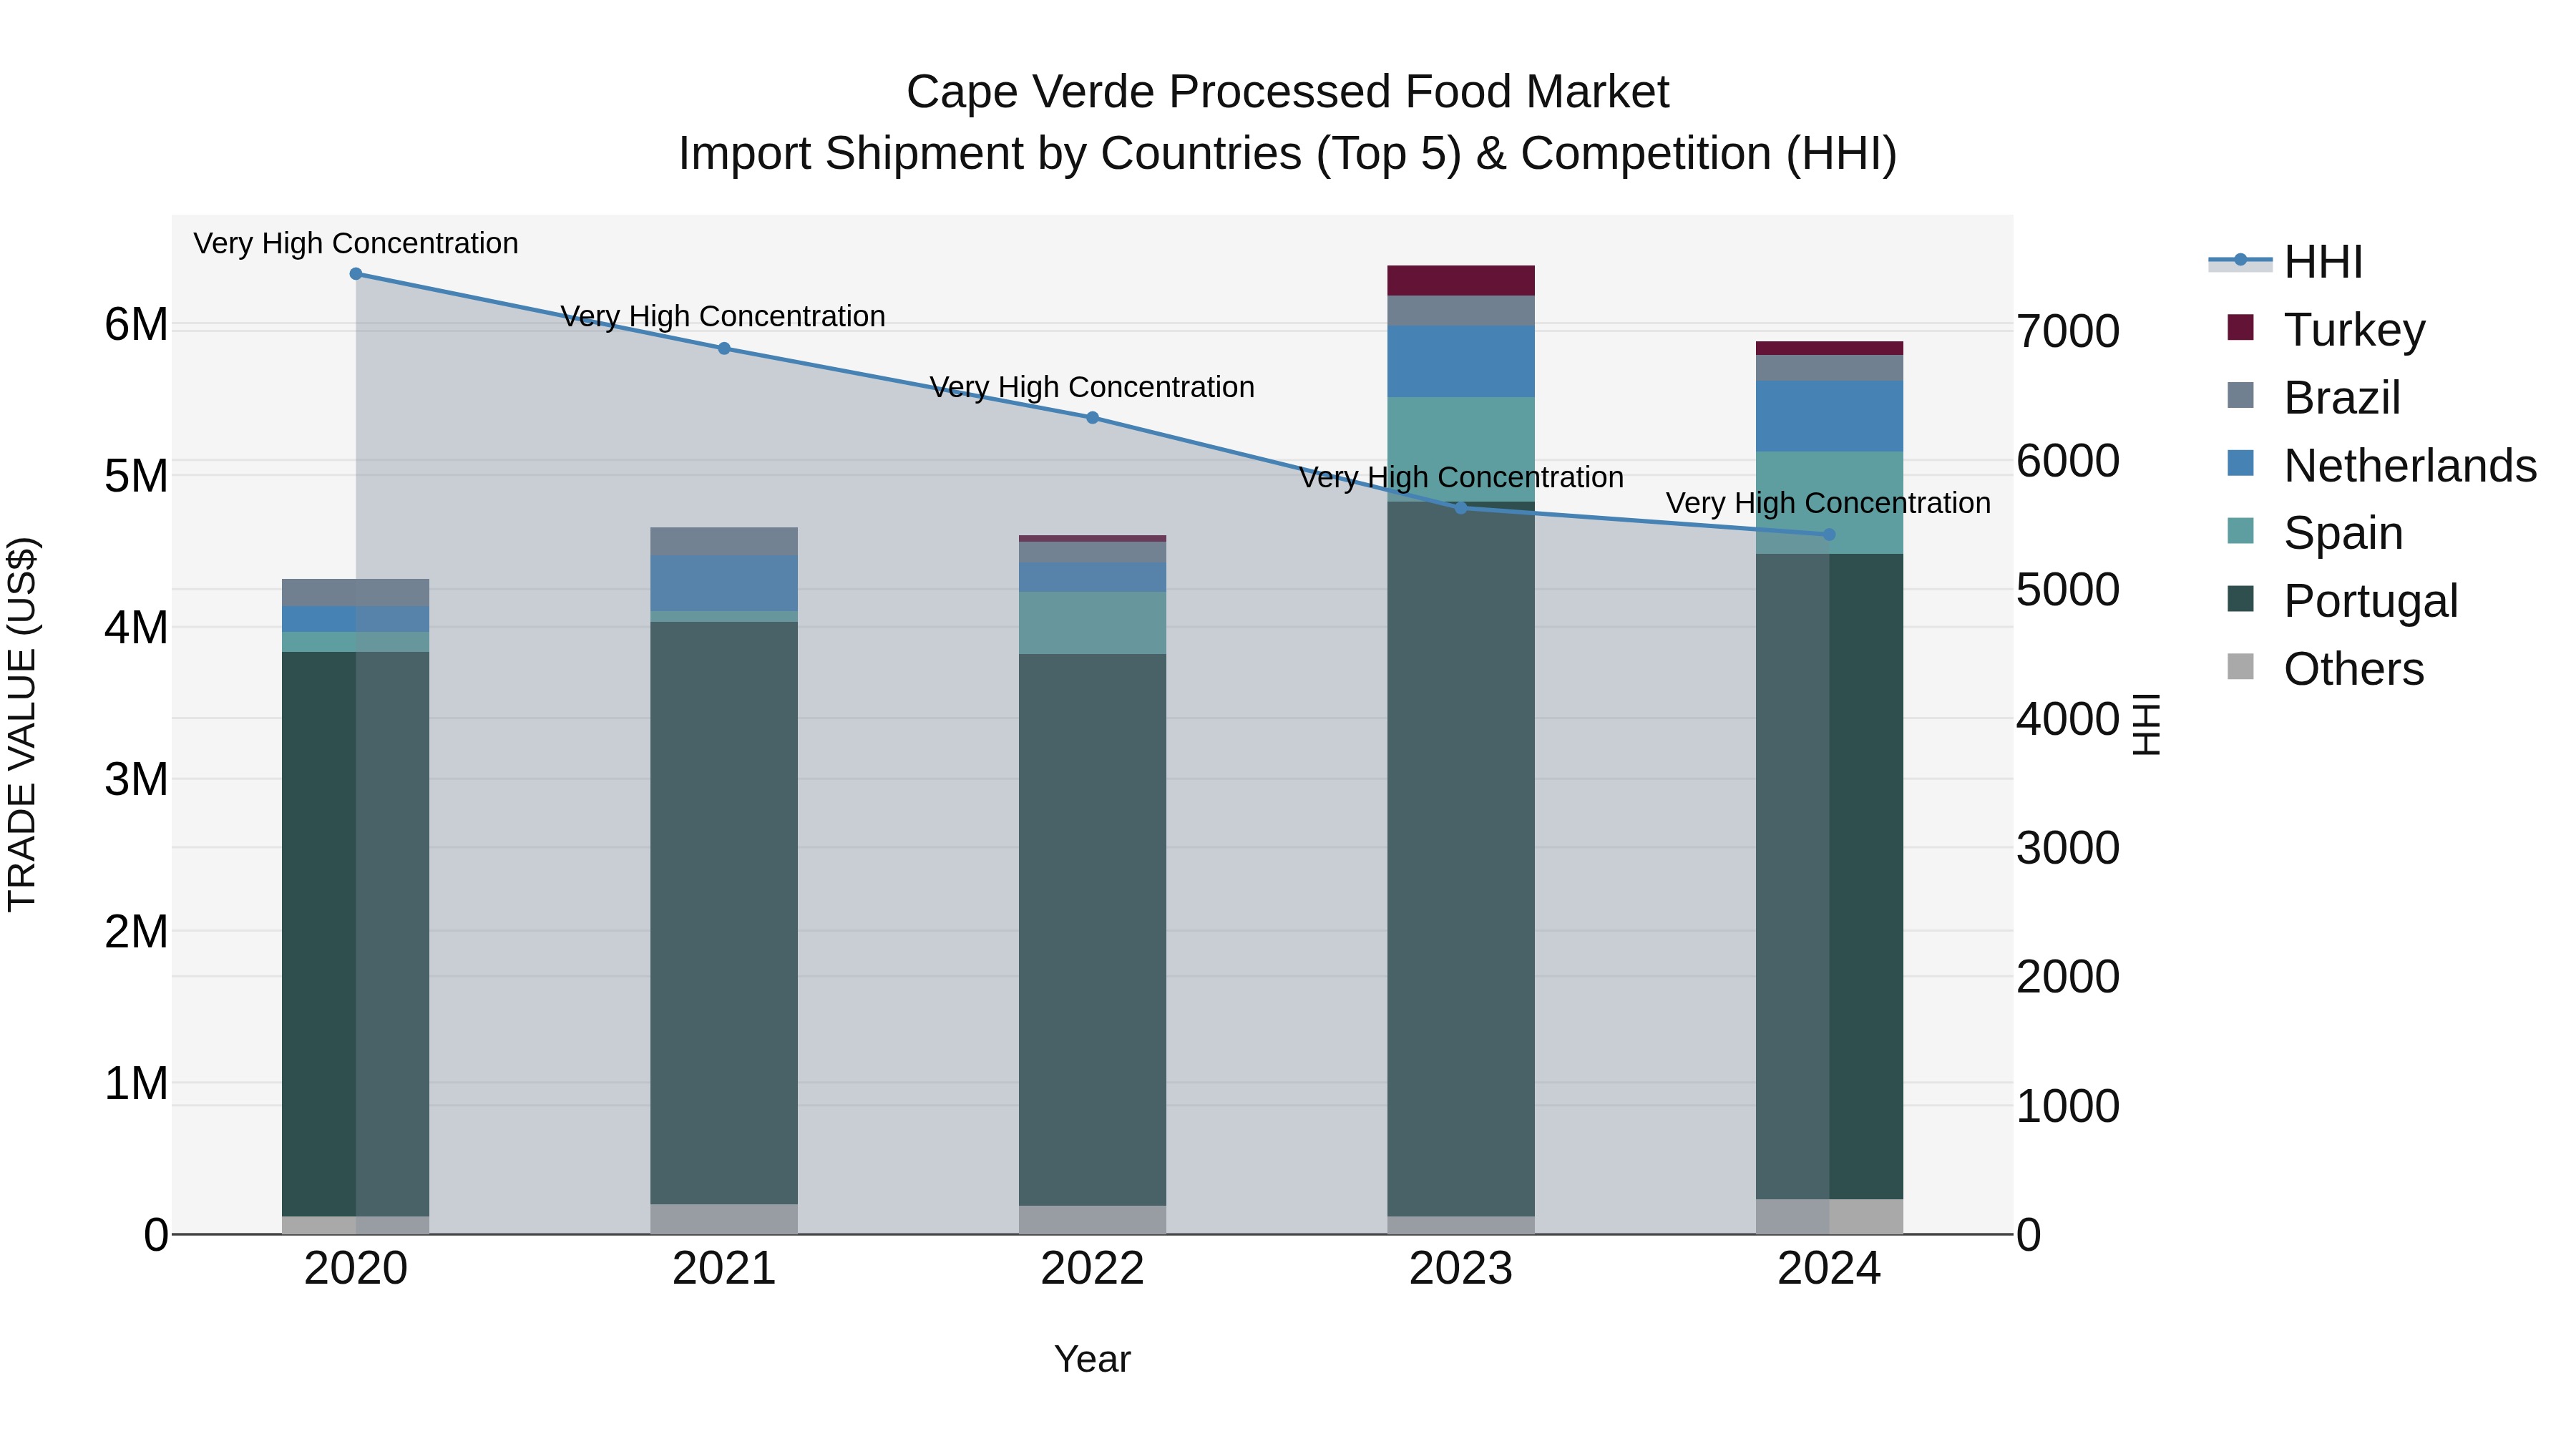
Cape Verde Processed Food Market: Top 5 Importing Countries and Market Competition (HHI) Analysis
In 2024, Cape Verde continued to rely on imports of processed food, with top exporting countries being Portugal, Spain, Netherlands, Brazil, and the United Arab Emirates. Despite a high Herfindahl-Hirschman Index (HHI) indicating market concentration, the industry saw a healthy compound annual growth rate (CAGR) of 8.05% from 2020 to 2024. However, there was a slight decline in growth rate from 2023 to 2024 at -7.8%, signaling potential challenges or shifts in the market dynamics for processed food imports in Cape Verde.
Processed Food Market: Cabo Verde vs Top 5 Major Economies in 2027 (Africa)
By 2027, Cabo Verde's Processed Food market is forecasted to achieve a exponential growth rate of 16.51%, with Egypt leading the Africa region, followed by South Africa, Ethiopia, Algeria and Nigeria.

Cape Verde Processed Food Market Overview
The processed food market in Cape Verde encompasses a wide range of food products that are prepared and packaged for convenience, including canned goods, frozen foods, and ready-to-eat meals. This market is driven by changing consumer lifestyles, urbanization, and the growing demand for convenient and long-lasting food options. As the population`s dietary preferences evolve, the processed food market is expected to see continued growth.
Drivers of the market
The processed food market in Cape Verde is influenced by the demand for convenient, ready-to-eat, and longer-lasting food products. Processed foods offer convenience and extended shelf life, catering to busy lifestyles. The growth in urbanization, changing dietary habits, and the rise in disposable income drive the demand for processed foods.
Challenges of the market
The processed food market in Cape Verde encounters challenges including high import costs and limited local manufacturing capabilities. There is a need for specialized technology and infrastructure to support food processing that are not readily available locally. The market faces competition from global suppliers and alternative food products. Supply chain logistics and distribution issues further impact the availability and cost of processed foods in the local market.
Government Policy of the market
To support the processed food market, the government might focus on promoting the use of high-quality and safe food products. Policies could include providing support for local production, setting standards for food safety and quality, and encouraging research into new processing technologies and applications.
Key Highlights of the Report:
- Cape Verde Processed Food Market Outlook
- Market Size of Cape Verde Processed Food Market, 2024
- Forecast of Cape Verde Processed Food Market, 2031
- Historical Data and Forecast of Cape Verde Processed Food Revenues & Volume for the Period 2021-2031
- Cape Verde Processed Food Market Trend Evolution
- Cape Verde Processed Food Market Drivers and Challenges
- Cape Verde Processed Food Price Trends
- Cape Verde Processed Food Porter`s Five Forces
- Cape Verde Processed Food Industry Life Cycle
- Historical Data and Forecast of Cape Verde Processed Food Market Revenues & Volume By Process for the Period 2021-2031
- Historical Data and Forecast of Cape Verde Processed Food Market Revenues & Volume By Minimally for the Period 2021-2031
- Historical Data and Forecast of Cape Verde Processed Food Market Revenues & Volume By Highly for the Period 2021-2031
- Historical Data and Forecast of Cape Verde Processed Food Market Revenues & Volume By Product type for the Period 2021-2031
- Historical Data and Forecast of Cape Verde Processed Food Market Revenues & Volume By Plant based for the Period 2021-2031
- Historical Data and Forecast of Cape Verde Processed Food Market Revenues & Volume By Fruits for the Period 2021-2031
- Historical Data and Forecast of Cape Verde Processed Food Market Revenues & Volume By Vegetables for the Period 2021-2031
- Historical Data and Forecast of Cape Verde Processed Food Market Revenues & Volume By Legumes for the Period 2021-2031
- Historical Data and Forecast of Cape Verde Processed Food Market Revenues & Volume By Extracted foods for the Period 2021-2031
- Historical Data and Forecast of Cape Verde Processed Food Market Revenues & Volume By Others for the Period 2021-2031
- Historical Data and Forecast of Cape Verde Processed Food Market Revenues & Volume By Animal based for the Period 2021-2031
- Historical Data and Forecast of Cape Verde Processed Food Market Revenues & Volume By Milk for the Period 2021-2031
- Historical Data and Forecast of Cape Verde Processed Food Market Revenues & Volume By Application for the Period 2021-2031
- Historical Data and Forecast of Cape Verde Processed Food Market Revenues & Volume By Baked foods for the Period 2021-2031
- Historical Data and Forecast of Cape Verde Processed Food Market Revenues & Volume By Baby food for the Period 2021-2031
- Historical Data and Forecast of Cape Verde Processed Food Market Revenues & Volume By Breakfast Cereal for the Period 2021-2031
- Historical Data and Forecast of Cape Verde Processed Food Market Revenues & Volume By Biscuits for the Period 2021-2031
- Historical Data and Forecast of Cape Verde Processed Food Market Revenues & Volume By Cheese for the Period 2021-2031
- Historical Data and Forecast of Cape Verde Processed Food Market Revenues & Volume By Chocolate confectionary for the Period 2021-2031
- Historical Data and Forecast of Cape Verde Processed Food Market Revenues & Volume By Ice creams for the Period 2021-2031
- Historical Data and Forecast of Cape Verde Processed Food Market Revenues & Volume By Instant Noodles for the Period 2021-2031
- Cape Verde Processed Food Import Export Trade Statistics
- Market Opportunity Assessment By Process
- Market Opportunity Assessment By Product type
- Market Opportunity Assessment By Application
- Cape Verde Processed Food Top Companies Market Share
- Cape Verde Processed Food Competitive Benchmarking By Technical and Operational Parameters
- Cape Verde Processed Food Company Profiles
- Cape Verde Processed Food Key Strategic Recommendations
Frequently Asked Questions About the Market Study (FAQs):
6Wresearch actively monitors the Cape Verde Processed Food Market and publishes its comprehensive annual report, highlighting emerging trends, growth drivers, revenue analysis, and forecast outlook. Our insights help businesses to make data-backed strategic decisions with ongoing market dynamics. Our analysts track relevent industries related to the Cape Verde Processed Food Market, allowing our clients with actionable intelligence and reliable forecasts tailored to emerging regional needs.
Yes, we provide customisation as per your requirements. To learn more, feel free to contact us on sales@6wresearch.com
1 Executive Summary |
2 Introduction |
2.1 Key Highlights of the Report |
2.2 Report Description |
2.3 Market Scope & Segmentation |
2.4 Research Methodology |
2.5 Assumptions |
3 Cape Verde Processed Food Market Overview |
3.1 Cape Verde Country Macro Economic Indicators |
3.2 Cape Verde Processed Food Market Revenues & Volume, 2021 & 2031F |
3.3 Cape Verde Processed Food Market - Industry Life Cycle |
3.4 Cape Verde Processed Food Market - Porter's Five Forces |
3.5 Cape Verde Processed Food Market Revenues & Volume Share, By Process, 2021 & 2031F |
3.6 Cape Verde Processed Food Market Revenues & Volume Share, By Product type, 2021 & 2031F |
3.7 Cape Verde Processed Food Market Revenues & Volume Share, By Application, 2021 & 2031F |
4 Cape Verde Processed Food Market Dynamics |
4.1 Impact Analysis |
4.2 Market Drivers |
4.2.1 Increasing urbanization leading to a higher demand for convenience foods |
4.2.2 Growing disposable income of the population |
4.2.3 Rising awareness about health and wellness leading to a shift towards processed foods with healthier ingredients |
4.3 Market Restraints |
4.3.1 Price sensitivity of the consumers |
4.3.2 Dependence on imports for raw materials, leading to vulnerability to external factors like currency fluctuations and supply chain disruptions |
5 Cape Verde Processed Food Market Trends |
6 Cape Verde Processed Food Market Segmentations |
6.1 Cape Verde Processed Food Market, By Process |
6.1.1 Overview and Analysis |
6.1.2 Cape Verde Processed Food Market Revenues & Volume, By Minimally, 2021-2031F |
6.1.3 Cape Verde Processed Food Market Revenues & Volume, By Highly, 2021-2031F |
6.2 Cape Verde Processed Food Market, By Product type |
6.2.1 Overview and Analysis |
6.2.2 Cape Verde Processed Food Market Revenues & Volume, By Plant based, 2021-2031F |
6.2.3 Cape Verde Processed Food Market Revenues & Volume, By Fruits , 2021-2031F | 6.2.4 Cape Verde Processed Food Market Revenues & Volume, By Vegetables, 2021-2031F |
6.2.5 Cape Verde Processed Food Market Revenues & Volume, By Legumes , 2021-2031F |
6.2.6 Cape Verde Processed Food Market Revenues & Volume, By Extracted foods, 2021-2031F |
6.2.7 Cape Verde Processed Food Market Revenues & Volume, By Others, 2021-2031F |
6.2.8 Cape Verde Processed Food Market Revenues & Volume, By Milk , 2021-2031F |
6.2.9 Cape Verde Processed Food Market Revenues & Volume, By Milk , 2021-2031F |
6.3 Cape Verde Processed Food Market, By Application |
6.3.1 Overview and Analysis |
6.3.2 Cape Verde Processed Food Market Revenues & Volume, By Baked foods, 2021-2031F |
6.3.3 Cape Verde Processed Food Market Revenues & Volume, By Baby food, 2021-2031F |
6.3.4 Cape Verde Processed Food Market Revenues & Volume, By Breakfast Cereal, 2021-2031F |
6.3.5 Cape Verde Processed Food Market Revenues & Volume, By Biscuits, 2021-2031F |
6.3.6 Cape Verde Processed Food Market Revenues & Volume, By Cheese, 2021-2031F |
6.3.7 Cape Verde Processed Food Market Revenues & Volume, By Chocolate confectionary, 2021-2031F |
6.3.8 Cape Verde Processed Food Market Revenues & Volume, By Instant Noodles, 2021-2031F |
6.3.9 Cape Verde Processed Food Market Revenues & Volume, By Instant Noodles, 2021-2031F |
7 Cape Verde Processed Food Market Import-Export Trade Statistics |
7.1 Cape Verde Processed Food Market Export to Major Countries |
7.2 Cape Verde Processed Food Market Imports from Major Countries |
8 Cape Verde Processed Food Market Key Performance Indicators |
8.1 Number of new product launches catering to health-conscious consumers |
8.2 Growth in the number of distribution channels for processed foods |
8.3 Percentage increase in per capita consumption of processed foods in Cape Verde |
9 Cape Verde Processed Food Market - Opportunity Assessment |
9.1 Cape Verde Processed Food Market Opportunity Assessment, By Process, 2021 & 2031F |
9.2 Cape Verde Processed Food Market Opportunity Assessment, By Product type, 2021 & 2031F |
9.3 Cape Verde Processed Food Market Opportunity Assessment, By Application, 2021 & 2031F |
10 Cape Verde Processed Food Market - Competitive Landscape |
10.1 Cape Verde Processed Food Market Revenue Share, By Companies, 2024 |
10.2 Cape Verde Processed Food Market Competitive Benchmarking, By Operating and Technical Parameters |
11 Company Profiles |
12 Recommendations | 13 Disclaimer |
Global Go To Market Strategy - 2030
Export potential enables firms to identify high-growth global markets with greater confidence by combining advanced trade intelligence with a structured quantitative methodology. The framework analyzes emerging demand trends and country-level import patterns while integrating macroeconomic and trade datasets such as GDP and population forecasts, bilateral import–export flows, tariff structures, elasticity differentials between developed and developing economies, geographic distance, and import demand projections. Using weighted trade values from 2020–2024 as the base period to project country-to-country export potential for 2030, these inputs are operationalized through calculated drivers such as gravity model parameters, tariff impact factors, and projected GDP per-capita growth. Through an analysis of hidden potentials, demand hotspots, and market conditions that are most favorable to success, this method enables firms to focus on target countries, maximize returns, and global expansion with data, backed by accuracy.
By factoring in the projected importer demand gap that is currently unmet and could be potential opportunity, it identifies the potential for the Exporter (Country) among 190 countries, against the general trade analysis, which identifies the biggest importer or exporter.
To discover high-growth global markets and optimize your business strategy:
Click Here
Pricing
- Single User License$ 1,995
- Department License$ 2,400
- Site License$ 3,120
- Global License$ 3,795

Leadership Perspectives from Industry Events
Search
Thought Leadership and Analyst Meet


Our Clients
6WResearch In News
- Doha a strategic location for EV manufacturing hub: IPA Qatar
- Demand for luxury TVs surging in the GCC, says Samsung
- Empowering Growth: The Thriving Journey of Bangladesh’s Cable Industry
- Demand for luxury TVs surging in the GCC, says Samsung
- Video call with a traditional healer? Once unthinkable, it’s now common in South Africa
- Intelligent Buildings To Smooth GCC’s Path To Net Zero
Latest Reports
- Cape Verde Portable Hand-Thrown Extinguisher Market (2026-2032)
- Canada Portable Hand-Thrown Extinguisher Market (2026-2032)
- Cameroon Portable Hand-Thrown Extinguisher Market (2026-2032)
- Burundi Portable Hand-Thrown Extinguisher Market (2026-2032)
- Burkina Faso Portable Hand-Thrown Extinguisher Market (2026-2032)
- Bulgaria Portable Hand-Thrown Extinguisher Market (2026-2032)
- Brunei Portable Hand-Thrown Extinguisher Market (2026-2032)
- Botswana Portable Hand-Thrown Extinguisher Market (2026-2032)
- Bosnia and Herzegovina Portable Hand-Thrown Extinguisher Market (2026-2032)
- Bolivia Portable Hand-Thrown Extinguisher Market (2026-2032)
Industry Events and Analyst Meet

HIMTEX 2026

India Refining Summit 2026

India EV Show 2026

EV tech India Expo 2026

Auto Tech Asia 2026
Whitepaper
- Middle East & Africa Commercial Security Market Click here to view more.
- Middle East & Africa Fire Safety Systems & Equipment Market Click here to view more.
- GCC Drone Market Click here to view more.
- Middle East Lighting Fixture Market Click here to view more.
- GCC Physical & Perimeter Security Market Click here to view more.