Cape Verde Urea Market (2025-2031) | Revenue, Value, Forecast, Trends, Size, Growth, Outlook, Companies, Industry, Analysis, Share & Segmentation
Market Forecast By Grade (Fertilizer, Feed, Technical), By End-user Industry (Agriculture, Chemical, Automotive, Medical, Others) And Competitive Landscape
| Product Code: ETC4901066 | Publication Date: Nov 2023 | Updated Date: Nov 2025 | Product Type: Market Research Report | |
| Publisher: 6Wresearch | Author: Sachin Kumar Rai | No. of Pages: 60 | No. of Figures: 30 | No. of Tables: 5 |
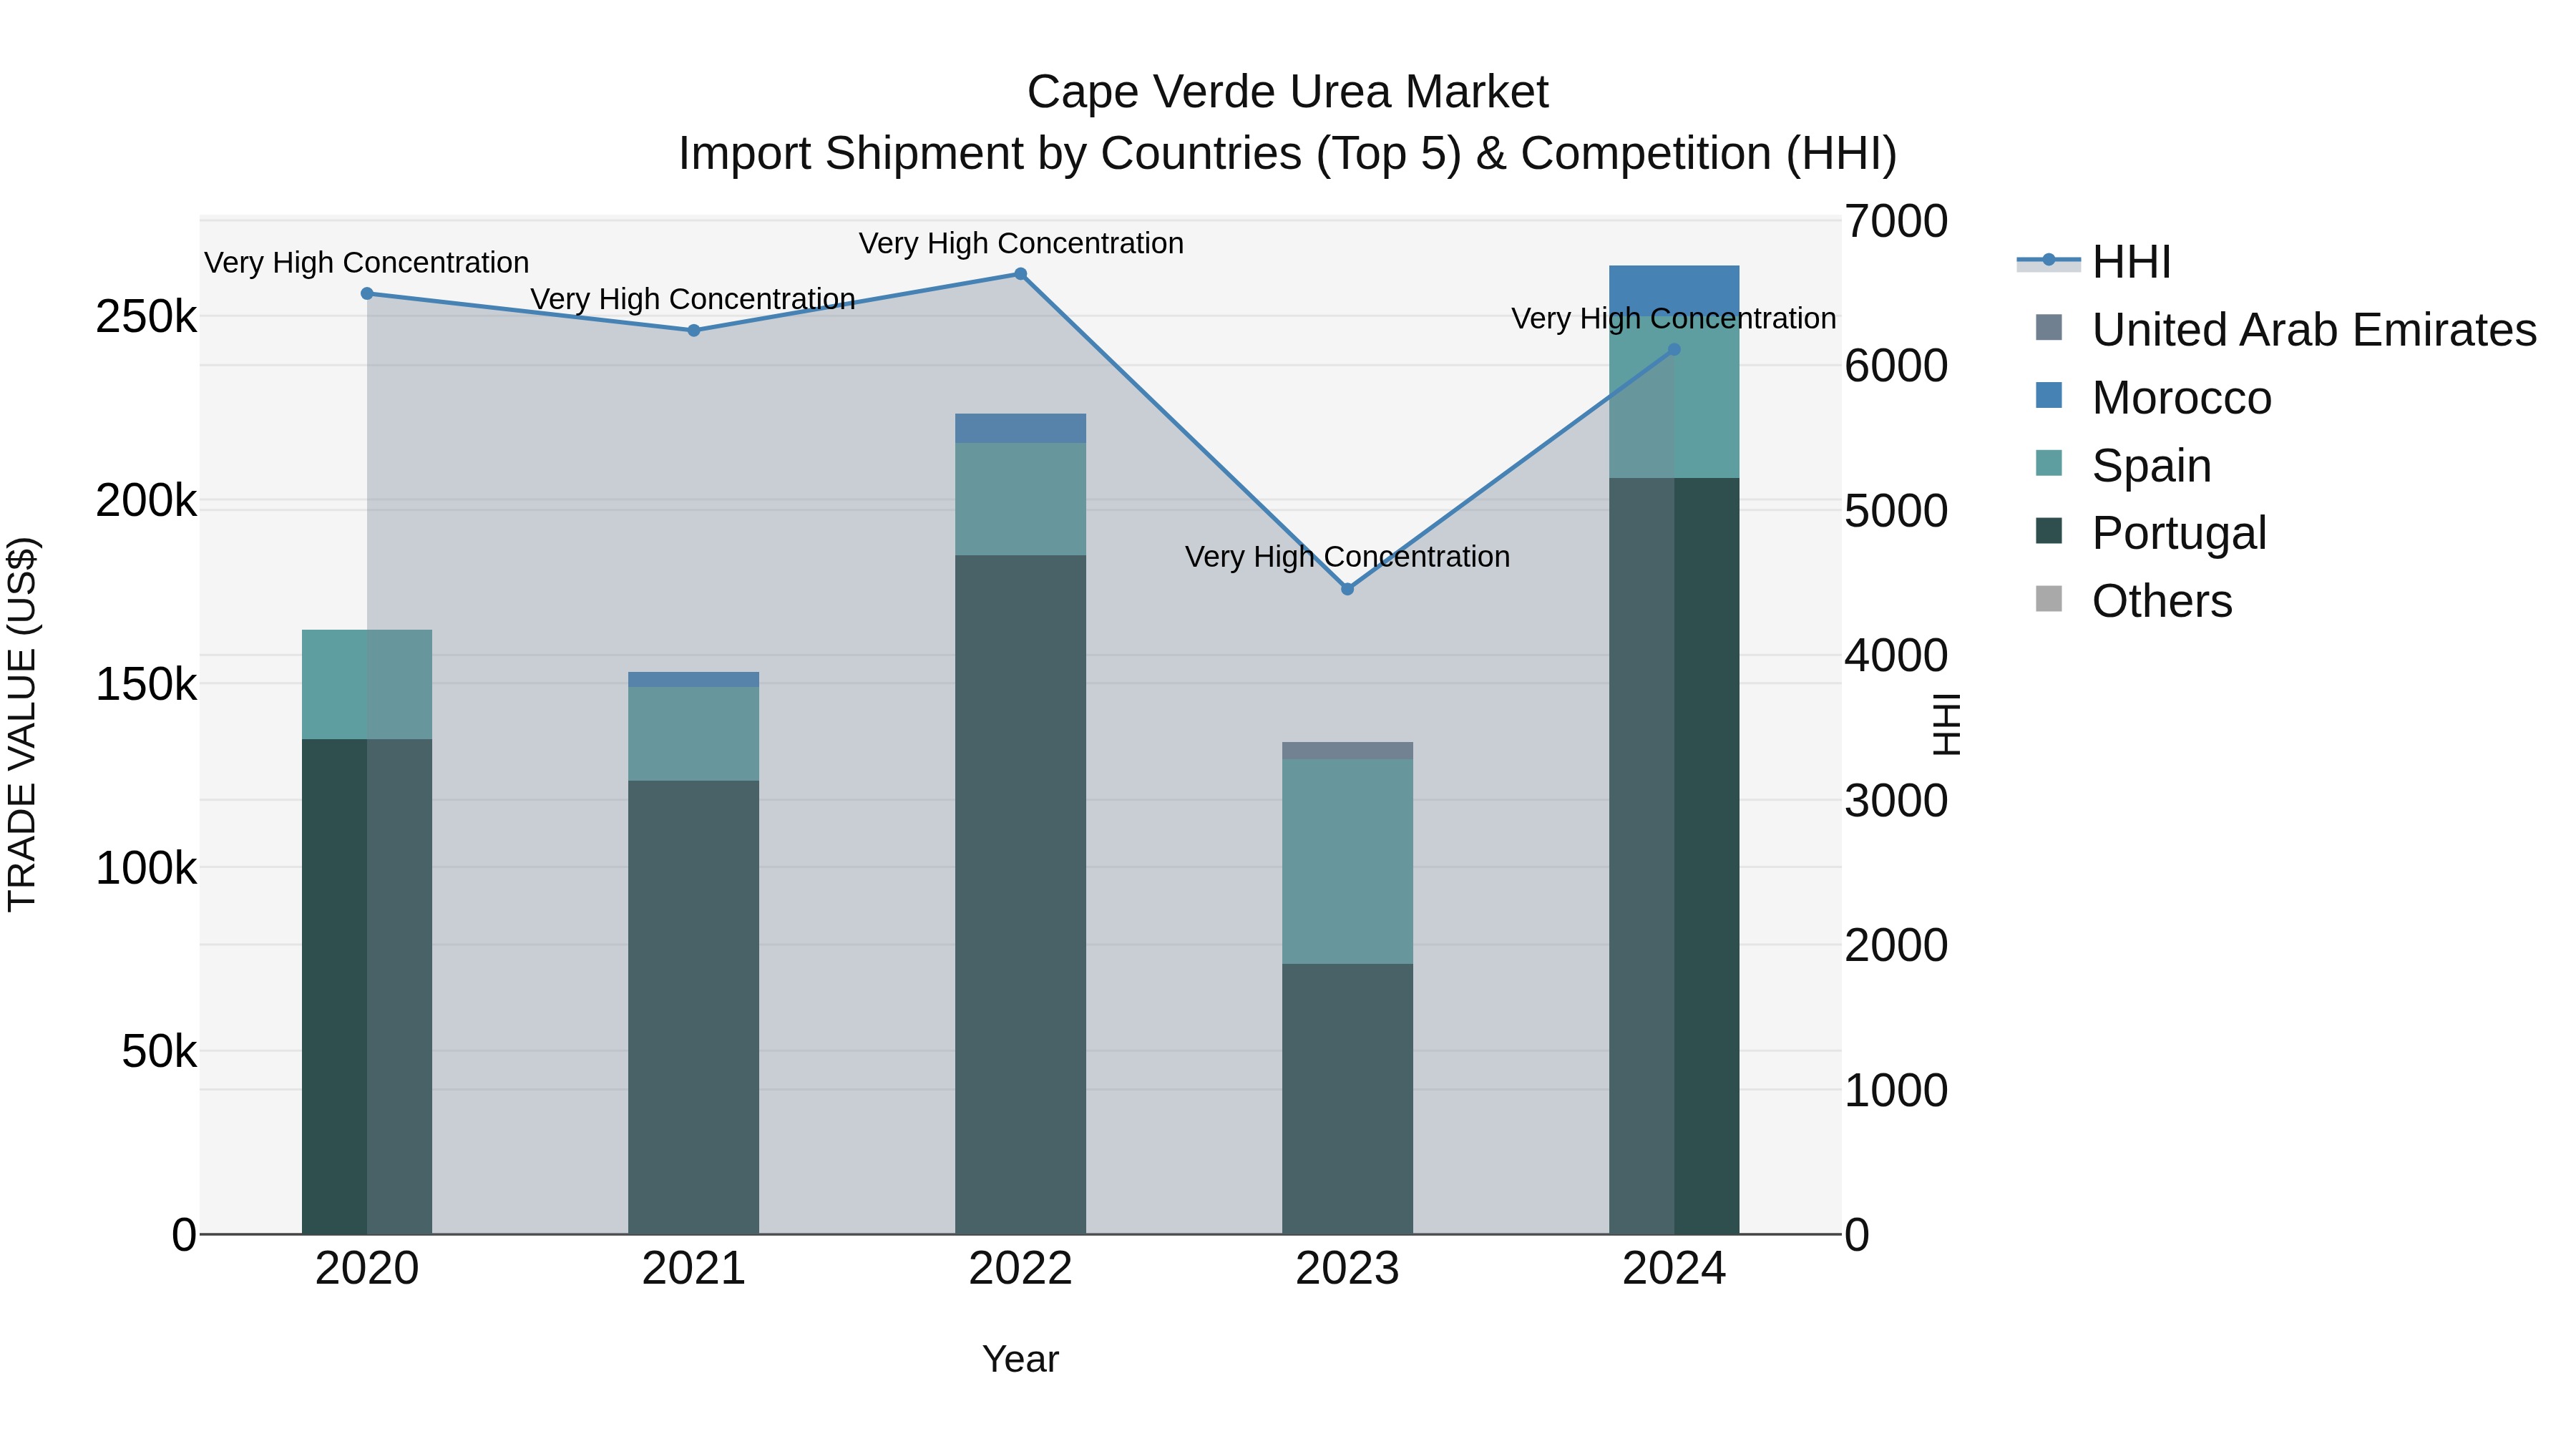
Cape Verde Urea Market: Top 5 Importing Countries and Market Competition (HHI) Analysis
Cape Verde`s urea import market in 2024 continued to see strong concentration, with top exporting countries being Portugal, Spain, Morocco, and the United Arab Emirates. The high Herfindahl-Hirschman Index (HHI) suggests a consolidated market. The compound annual growth rate (CAGR) over the period 2020-2024 was robust at 12.51%, indicating sustained expansion. Notably, the growth rate from 2023 to 2024 spiked significantly by 96.84%, indicating a surge in urea import shipments into Cape Verde. This data points to a dynamic and competitive market landscape in the urea import sector for the country.
Cape Verde Urea Market Overview
The urea market in Cape Verde focuses on the production and distribution of urea, a key component in fertilizers and industrial chemicals. Urea is essential for agriculture and has applications in various industrial processes. As agricultural productivity and industrial activities grow, the demand for urea is anticipated to increase.
Drivers of the market
The urea market in Cape Verde is largely driven by the agricultural sector`s need for effective nitrogen fertilizers to enhance crop yields. Urea, a key component in many fertilizers, helps in improving soil fertility and plant growth. As agriculture remains a critical part of the country`s economy, the demand for urea is supported by efforts to increase agricultural productivity and ensure food security. Additionally, the growth in industrial applications and the need for efficient nitrogen sources in various processes contribute to the market`s expansion.
Challenges of the market
The urea market in Cape Verde faces several challenges, primarily due to limited local agricultural activity and low demand for fertilizers. High import costs, coupled with a lack of local production facilities, further constrain the market. Additionally, there is insufficient awareness among local farmers about the benefits of urea as a high-efficiency nitrogen fertilizer, which hampers market growth and reduces the competitiveness of suppliers.
Government Policy of the market
The urea market in Cape Verde is influenced by government policies aimed at supporting the agricultural sector, where urea is widely used as a nitrogen fertilizer. The government promotes the use of urea through subsidies and tax incentives for local producers and farmers. Regulations ensure the quality and safety of urea products to enhance agricultural productivity. Despite these supportive measures, challenges such as high production costs and reliance on international suppliers persist. Government efforts to improve local manufacturing capabilities and reduce import dependencies are crucial for the market`s growth.
Key Highlights of the Report:
- Cape Verde Urea Market Outlook
- Market Size of Cape Verde Urea Market, 2024
- Forecast of Cape Verde Urea Market, 2031
- Historical Data and Forecast of Cape Verde Urea Revenues & Volume for the Period 2021-2031
- Cape Verde Urea Market Trend Evolution
- Cape Verde Urea Market Drivers and Challenges
- Cape Verde Urea Price Trends
- Cape Verde Urea Porter`s Five Forces
- Cape Verde Urea Industry Life Cycle
- Historical Data and Forecast of Cape Verde Urea Market Revenues & Volume By Grade for the Period 2021-2031
- Historical Data and Forecast of Cape Verde Urea Market Revenues & Volume By Fertilizer for the Period 2021-2031
- Historical Data and Forecast of Cape Verde Urea Market Revenues & Volume By Feed for the Period 2021-2031
- Historical Data and Forecast of Cape Verde Urea Market Revenues & Volume By Technical for the Period 2021-2031
- Historical Data and Forecast of Cape Verde Urea Market Revenues & Volume By End-user Industry for the Period 2021-2031
- Historical Data and Forecast of Cape Verde Urea Market Revenues & Volume By Agriculture for the Period 2021-2031
- Historical Data and Forecast of Cape Verde Urea Market Revenues & Volume By Chemical for the Period 2021-2031
- Historical Data and Forecast of Cape Verde Urea Market Revenues & Volume By Automotive for the Period 2021-2031
- Historical Data and Forecast of Cape Verde Urea Market Revenues & Volume By Medical for the Period 2021-2031
- Historical Data and Forecast of Cape Verde Urea Market Revenues & Volume By Others for the Period 2021-2031
- Cape Verde Urea Import Export Trade Statistics
- Market Opportunity Assessment By Grade
- Market Opportunity Assessment By End-user Industry
- Cape Verde Urea Top Companies Market Share
- Cape Verde Urea Competitive Benchmarking By Technical and Operational Parameters
- Cape Verde Urea Company Profiles
- Cape Verde Urea Key Strategic Recommendations
Frequently Asked Questions About the Market Study (FAQs):
6Wresearch actively monitors the Cape Verde Urea Market and publishes its comprehensive annual report, highlighting emerging trends, growth drivers, revenue analysis, and forecast outlook. Our insights help businesses to make data-backed strategic decisions with ongoing market dynamics. Our analysts track relevent industries related to the Cape Verde Urea Market, allowing our clients with actionable intelligence and reliable forecasts tailored to emerging regional needs.
Yes, we provide customisation as per your requirements. To learn more, feel free to contact us on sales@6wresearch.com
1 Executive Summary |
2 Introduction |
2.1 Key Highlights of the Report |
2.2 Report Description |
2.3 Market Scope & Segmentation |
2.4 Research Methodology |
2.5 Assumptions |
3 Cape Verde Urea Market Overview |
3.1 Cape Verde Country Macro Economic Indicators |
3.2 Cape Verde Urea Market Revenues & Volume, 2021 & 2031F |
3.3 Cape Verde Urea Market - Industry Life Cycle |
3.4 Cape Verde Urea Market - Porter's Five Forces |
3.5 Cape Verde Urea Market Revenues & Volume Share, By Grade, 2021 & 2031F |
3.6 Cape Verde Urea Market Revenues & Volume Share, By End-user Industry, 2021 & 2031F |
4 Cape Verde Urea Market Dynamics |
4.1 Impact Analysis |
4.2 Market Drivers |
4.3 Market Restraints |
5 Cape Verde Urea Market Trends |
6 Cape Verde Urea Market Segmentations |
6.1 Cape Verde Urea Market, By Grade |
6.1.1 Overview and Analysis |
6.1.2 Cape Verde Urea Market Revenues & Volume, By Fertilizer, 2021-2031F |
6.1.3 Cape Verde Urea Market Revenues & Volume, By Feed, 2021-2031F |
6.1.4 Cape Verde Urea Market Revenues & Volume, By Technical, 2021-2031F |
6.2 Cape Verde Urea Market, By End-user Industry |
6.2.1 Overview and Analysis |
6.2.2 Cape Verde Urea Market Revenues & Volume, By Agriculture, 2021-2031F |
6.2.3 Cape Verde Urea Market Revenues & Volume, By Chemical, 2021-2031F |
6.2.4 Cape Verde Urea Market Revenues & Volume, By Automotive, 2021-2031F |
6.2.5 Cape Verde Urea Market Revenues & Volume, By Medical, 2021-2031F |
6.2.6 Cape Verde Urea Market Revenues & Volume, By Others, 2021-2031F |
7 Cape Verde Urea Market Import-Export Trade Statistics |
7.1 Cape Verde Urea Market Export to Major Countries |
7.2 Cape Verde Urea Market Imports from Major Countries |
8 Cape Verde Urea Market Key Performance Indicators |
9 Cape Verde Urea Market - Opportunity Assessment |
9.1 Cape Verde Urea Market Opportunity Assessment, By Grade, 2021 & 2031F |
9.2 Cape Verde Urea Market Opportunity Assessment, By End-user Industry, 2021 & 2031F |
10 Cape Verde Urea Market - Competitive Landscape |
10.1 Cape Verde Urea Market Revenue Share, By Companies, 2024 |
10.2 Cape Verde Urea Market Competitive Benchmarking, By Operating and Technical Parameters |
11 Company Profiles |
12 Recommendations | 13 Disclaimer |
Export potential assessment - trade Analytics for 2030
Export potential enables firms to identify high-growth global markets with greater confidence by combining advanced trade intelligence with a structured quantitative methodology. The framework analyzes emerging demand trends and country-level import patterns while integrating macroeconomic and trade datasets such as GDP and population forecasts, bilateral import–export flows, tariff structures, elasticity differentials between developed and developing economies, geographic distance, and import demand projections. Using weighted trade values from 2020–2024 as the base period to project country-to-country export potential for 2030, these inputs are operationalized through calculated drivers such as gravity model parameters, tariff impact factors, and projected GDP per-capita growth. Through an analysis of hidden potentials, demand hotspots, and market conditions that are most favorable to success, this method enables firms to focus on target countries, maximize returns, and global expansion with data, backed by accuracy.
By factoring in the projected importer demand gap that is currently unmet and could be potential opportunity, it identifies the potential for the Exporter (Country) among 190 countries, against the general trade analysis, which identifies the biggest importer or exporter.
To discover high-growth global markets and optimize your business strategy:
Click Here
Pricing
- Single User License$ 1,995
- Department License$ 2,400
- Site License$ 3,120
- Global License$ 3,795

Search
Thought Leadership and Analyst Meet


Our Clients
Latest Reports
- Taiwan Food Delivery Platform Market (2026-2032) | Companies, Outlook, Analysis, Trends, Value, Revenue, Segmentation, Share, Forecast, Competitive Landscape, Growth, Size & Forecast
- United Kingdom (UK) Long-term Care Insurance Market (2026-2032) | Growth, Share, Consumer Insights, Drivers, Opportunities, Competition, Pricing Analysis, Segments, Restraints, Companies, Competitive, Value, Outlook, Size, Demand, Analysis, Challenges, Strategic Insights, Investment Trends, Revenue, Trends, Supply, Forecast
- United Kingdom (UK) Long Term Care Market (2026-2032) | Companies, Outlook, Analysis, Trends, Value, Revenue, Segmentation, Share, Forecast, Competitive Landscape, Growth, Size & Forecast
- Iraq Insulation and Waterproofing Market (2026-2032) | Outlook, Drivers, Growth, Size, Share, Industry, Revenue, Trends, Demand, Competitive, Strategic Insights, Opportunities, Segments, Companies, Challenges, Strategy, Consumer Insights, Analysis, Investment Trends, Value, Segmentation, Forecast, Restraints
- India Switchgear Market Outlook (2026-2032) | Size, Share, Trends, Growth, Revenue, Forecast, Analysis, Value, Outlook
- Pakistan Contraceptive Implants Market (2025-2031) | Demand, Growth, Size, Share, Industry, Pricing Analysis, Competitive, Strategic Insights, Strategy, Consumer Insights, Analysis, Investment Trends, Opportunities, Revenue, Segments, Value, Segmentation, Supply, Forecast, Restraints, Outlook, Competition, Drivers, Trends, Companies, Challenges
- Sri Lanka Packaging Market (2026-2032) | Outlook, Competition, Drivers, Trends, Demand, Pricing Analysis, Competitive, Strategic Insights, Companies, Challenges, Strategy, Consumer Insights, Analysis, Investment Trends, Opportunities, Growth, Size, Share, Industry, Revenue, Segments, Value, Segmentation, Supply, Forecast, Restraints
- India Kids Watches Market (2026-2032) | Strategy, Consumer Insights, Analysis, Investment Trends, Opportunities, Growth, Size, Share, Industry, Revenue, Segments, Value, Segmentation, Supply, Forecast, Restraints, Outlook, Competition, Drivers, Trends, Demand, Pricing Analysis, Competitive, Strategic Insights, Companies, Challenges
- Saudi Arabia Core Assurance Service Market (2025-2031) | Strategy, Consumer Insights, Analysis, Investment Trends, Opportunities, Growth, Size, Share, Industry, Revenue, Segments, Value, Segmentation, Supply, Forecast, Restraints, Outlook, Competition, Drivers, Trends, Demand, Pricing Analysis, Competitive, Strategic Insights, Companies, Challenges
- Romania Uninterruptible Power Supply (UPS) Market (2026-2032) | Industry, Analysis, Revenue, Size, Forecast, Outlook, Value, Trends, Share, Growth & Companies
Industry Events and Analyst Meet

India EV Show 2026

EV tech India Expo 2026

Auto Tech Asia 2026

Battery Tech India 2026

Smart Production Solutions Guangzhou 2026
Whitepaper
- Middle East & Africa Commercial Security Market Click here to view more.
- Middle East & Africa Fire Safety Systems & Equipment Market Click here to view more.
- GCC Drone Market Click here to view more.
- Middle East Lighting Fixture Market Click here to view more.
- GCC Physical & Perimeter Security Market Click here to view more.
6WResearch In News
- Doha a strategic location for EV manufacturing hub: IPA Qatar
- Demand for luxury TVs surging in the GCC, says Samsung
- Empowering Growth: The Thriving Journey of Bangladesh’s Cable Industry
- Demand for luxury TVs surging in the GCC, says Samsung
- Video call with a traditional healer? Once unthinkable, it’s now common in South Africa
- Intelligent Buildings To Smooth GCC’s Path To Net Zero