Chile Chemotherapy Market (2026-2032) | Companies, Industry, Analysis, Trends, Value, Size, Growth, Share, Forecast, Revenue & Outlook
Market Forecast By Drug Class (Alkylating Agents, Mitotic Inhibitors, Antimetabolites, Topoisomerase Inhibitors, Antitumor Antibiotic), By Indication (Lung Cancer, Breast Cancer, Colorectal Cancer, Prostate Cancer, Stomach Cancer, Lymphoma, Leukemia, Ovarian Cancer), By Route of Drug Administration (Intravenous, Oral, Subcutaneous, Intra-Muscular, Intravesicular, Topical, Intraperitoneal, Intraventricular/Intrathecal), By End-Users (Specialty Centers, Hospitals & Clinics) And Competitive Landscape
| Product Code: ETC044928 | Publication Date: Jan 2021 | Updated Date: Jun 2026 | Product Type: Report | |
| Publisher: 6Wresearch | Author: Ravi Bhandari | No. of Pages: 70 | No. of Figures: 35 | No. of Tables: 5 |
Chile Chemotherapy Market Summary
The chile chemotherapy market was estimated at USD 293 Million in 2025 and is projected to reach USD 393 Million by 2032, growing at a CAGR of 5.0% from 2026 to 2032.
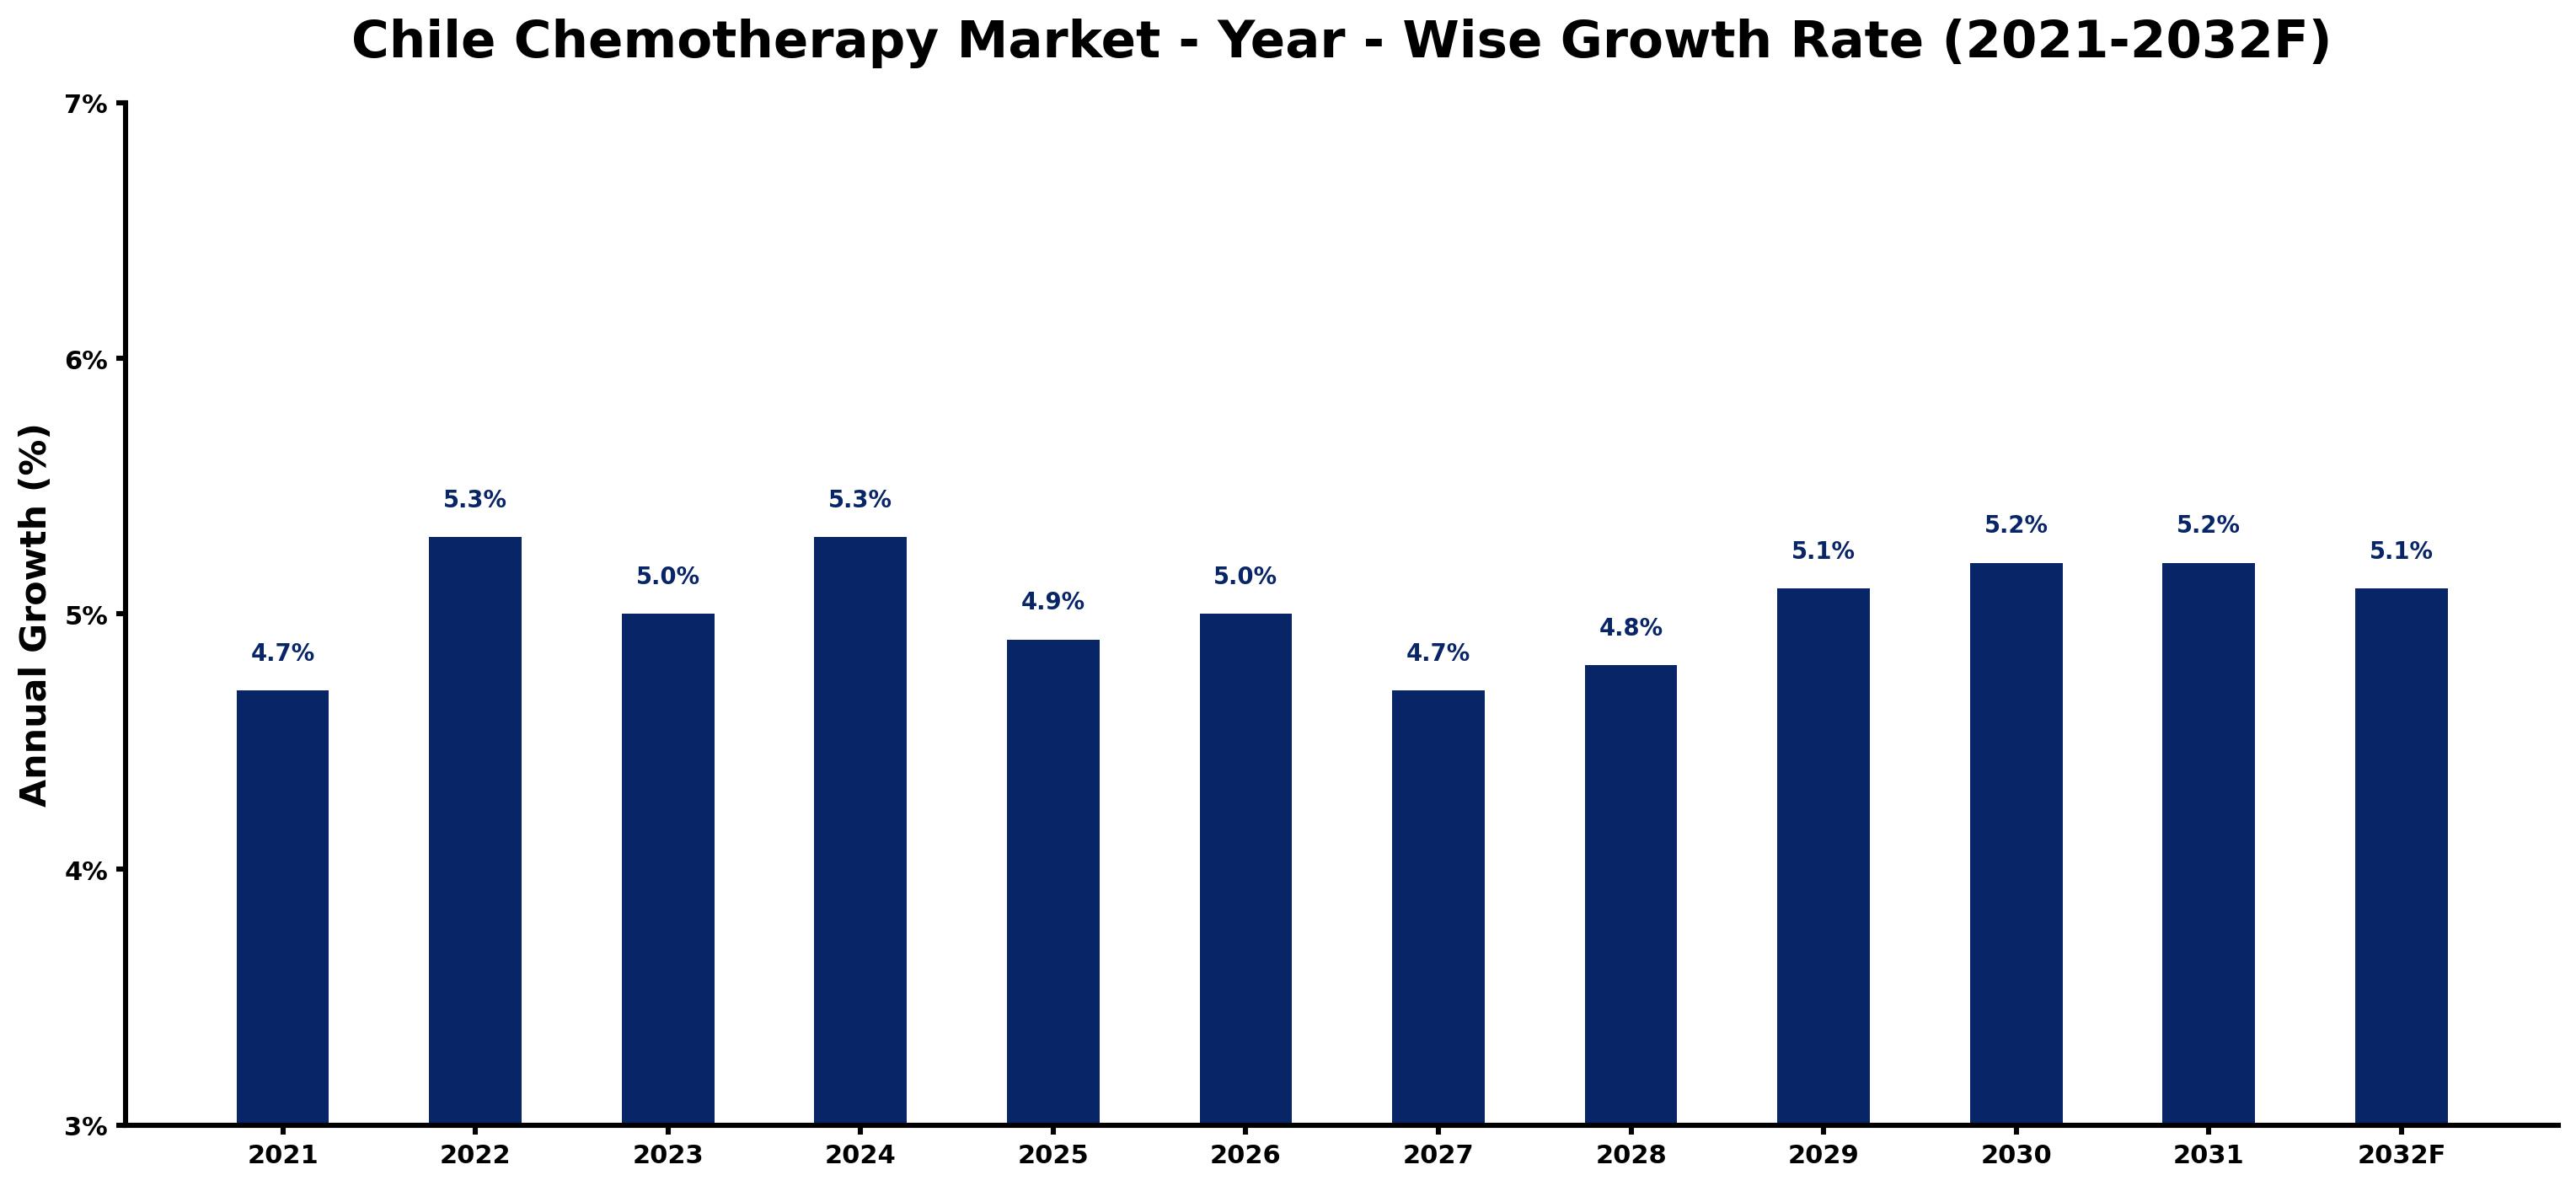
Chile Chemotherapy Market Growth Rate Analysis (2021-2032)
The Chile chemotherapy market has shown consistent growth, with rates peaking at 5.3% in both 2022 and 2024, reflecting rising oncology treatment needs and increased healthcare investment. A notable demand was observed in 2023, where growth stabilized at 5.0%, driven by advancements in treatment protocols and increased accessibility to innovative therapies. The market is supported by a robust healthcare infrastructure and governmental policies aimed at enhancing cancer care. As we look toward 2029 and beyond, projections indicate a sustained growth of approximately 5.1% to 5.2%, underpinned by continuous technological advancements and a proactive response to evolving consumer demands in cancer treatment.
Chile Chemotherapy Market Year-wise Growth Rate and Key Drivers
This graph highlights how the Chile Chemotherapy Market has steadily grown over the past five years, supported by major growth factors.
The table below presents the year wise growth rates along with the key drivers influencing the market
| Year | Growth Rate | Major Drivers |
| 2021 | 4.7% | Cancer incidence rates in Chile demand advanced chemotherapy treatment options. |
| 2022 | 5.3% | New healthcare policies prioritize access to oncology drugs across the nation. |
| 2023 | 5.0% | Increased investment in innovative cancer therapies attracts both local and international firms. |
| 2024 | 5.3% | Healthcare accessibility improvements expand chemotherapy availability in urban and rural areas. |
| 2025 | 4.9% | Emerging biotechnology firms introduce personalized medicine, reshaping treatment paradigms. |
| 2026 | 5.0% | Collaborations between universities and hospitals enhance research in chemotherapy advancements. |
| 2027 | 4.7% | Patient advocacy groups amplify voices for better cancer care and treatment options. |
| 2028 | 4.8% | Telemedicine growth streamlines patient consultations, improving treatment initiation rates. |
| 2029 | 5.1% | Economic recovery facilitates increased healthcare spending and investment in oncology. |
| 2030 | 5.2% | Aging population drives a higher prevalence of cancer, increasing treatment demand. |
| 2031 | 5.2% | Biopharmaceutical innovations result in more effective chemotherapy regimens gaining traction. |
| 2032 | 5.1% | Public awareness campaigns educate on cancer prevention and early detection initiatives. |
Note - Market size estimations and growth projections presented in this report are based on 6Wresearch's advanced forecasting approach, validated with industry datasets as of June 2026.
Chile Chemotherapy Market Synopsis
The Chile Chemotherapy Market is projected to reach 5.0% and witness significant growth during the forecast period (2026-2032). This growth is primarily driven by the increasing incidence of cancer within the country, coupled with advancements in cancer treatment technologies. The Chilean market is diversified, featuring an extensive range of chemotherapy drugs, which include both branded and generic formulations. A combination of government initiatives, improved healthcare access, and the proliferation of private healthcare facilities is further propelling market growth. Nonetheless, the market faces inherent challenges such as high treatment costs and the side effects associated with chemotherapy drugs, necessitating a focus on innovative therapies to enhance patient outcomes.
Chile Chemotherapy Market Growth Drivers
Several factors are driving the growth of the Chile chemotherapy market. The first is the rising rate of cancer diagnoses, which is prompting a greater demand for chemotherapy treatments. As Chile's population ages, the incidence of cancer is expected to rise, thereby intensifying the need for effective therapies.
- Advancements in cancer treatment technologies are improving patient outcomes and expanding the available therapeutic options. Innovations in drug development are leading to more effective chemotherapy regimens.
- The increasing number of healthcare facilities, especially private ones, is enhancing access to chemotherapy treatments throughout the country.
- Government policies aimed at enhancing healthcare access are contributing to an improved environment for cancer treatment, thus attracting more patients.
- There is a growing trend towards personalized medicine and targeted therapies, which are becoming integral components of contemporary chemotherapy regimens.
Chile Chemotherapy Market Trends and Opportunities
The Chile Chemotherapy Market is witnessing several notable trends and opportunities. The demand for personalized medicine and targeted therapies is on the rise, indicating a shift towards more individualized treatment approaches.
- Immunotherapy advancements are transforming treatment methodologies, leading to more effective and less toxic chemotherapy options.
- Combination therapy approaches are increasingly being adopted to enhance efficacy while minimizing adverse side effects.
- The adoption of biosimilars is becoming prominent in chemotherapy regimens, providing cost-effective alternatives that maintain therapeutic effectiveness.
- Collaborations between pharmaceutical companies and research institutions are fostering innovation in chemotherapy drug development, focusing on improving patient outcomes.
Chile Chemotherapy Market Challenges and Restraints
Despite the growth drivers, the Chile chemotherapy market grapples with various challenges that could hinder its progress. A significant barrier includes limited access to advanced chemotherapy treatments, particularly for patients in rural areas or those from lower socioeconomic backgrounds.
- Inconsistencies in treatment quality stem from the lack of standardized guidelines for chemotherapy administration across different healthcare facilities.
- Issues concerning drug shortages compromise treatment availability, making it challenging for healthcare providers to offer timely and effective care.
- The high costs associated with advanced chemotherapy treatments may deter patients from opting for necessary therapies, leading to poorer health outcomes.
- Improving infrastructure and resources is essential to meet the growing demand for chemotherapy services in Chile.
Chile Chemotherapy Market Investment Opportunities
The Chile chemotherapy market presents lucrative investment opportunities driven by the increasing prevalence of cancer and a corresponding demand for innovative chemotherapy drugs. With aging populations and various lifestyle factors influencing cancer rates, the need for effective treatments is expected to remain strong.
- Investing in pharmaceutical companies focused on oncology can yield substantial returns as they develop new therapies to meet market demand.
- Healthcare providers offering advanced chemotherapy services are prime candidates for investment, given the growing patient base.
- There exists considerable potential for research and development in personalized chemotherapy treatments, allowing for tailored approaches that enhance efficacy.
- Public-private partnerships aimed at improving healthcare infrastructure can accelerate access to essential chemotherapy services.
Chile Chemotherapy Market Government Investment and Initiatives
The Chilean government has implemented various investment initiatives to bolster the chemotherapy market. These initiatives are centered on ensuring affordable access to essential chemotherapy medications through price controls and reimbursement schemes for cancer treatment.
- Quality control measures have been instituted to maintain the safety and efficacy of chemotherapy drugs available in the market.
- The government has developed guidelines outlining the appropriate use of chemotherapy treatments, supporting healthcare providers in delivering consistent care.
- Investment in healthcare infrastructure aims to enhance service delivery and ensure that adequate resources are available for chemotherapy care.
- Training programs for healthcare professionals are being expanded to better equip them in managing chemotherapy treatments and improving patient care.
Chile Chemotherapy Market Latest Developments (May 2025 - June 2026)
The latest developments in the Chile chemotherapy market from May 2025 to June 2026 indicate significant progress in treatment approaches and healthcare access. There are ongoing efforts to refine chemotherapy protocols to enhance efficacy and patient safety, reflecting broader trends in oncology.
- Research institutions are increasingly engaged in collaborative projects aimed at developing innovative drug therapies that target specific cancer types more effectively.
- Enhanced training for oncologists and chemotherapy nurses is being prioritized to improve patient management strategies and treatment outcomes.
- Public awareness campaigns are being conducted to educate patients about available chemotherapy options and access points, thereby increasing treatment utilization.
- The market is seeing a surge in the adoption of telemedicine, providing remote consultations for chemotherapy management to reach underserved populations.
Chile Chemotherapy Market - Key Attractiveness of the Report
- 10 Years of Market Numbers
- Historical Data Starting from 2022 to 2025
- Base Year: 2025
- Forecast Data until 2032
- Key Performance Indicators Impacting the Market
- Major Upcoming Developments and Projects
Key Highlights of the Report:
- Chile Chemotherapy? Market Outlook
- Market Size of Chile Chemotherapy? Market, 2025
- Forecast of Chile Chemotherapy? Market, 2032
- Historical Data and Forecast of Chile Chemotherapy? Revenues & Volume for the Period 2022-2032F
- Chile Chemotherapy? Market Trend Evolution
- Chile Chemotherapy? Market Drivers and Challenges
- Chile Chemotherapy? Price Trends
- Chile Chemotherapy? Porter's Five Forces
- Chile Chemotherapy? Industry Life Cycle
- Historical Data and Forecast of Chile Chemotherapy? Market Revenues & Volume By Drug Class for the Period 2022-2032F
- Historical Data and Forecast of Chile Chemotherapy? Market Revenues & Volume By Alkylating Agents for the Period 2022-2032F
- Historical Data and Forecast of Chile Chemotherapy? Market Revenues & Volume By Mitotic Inhibitors for the Period 2022-2032F
- Historical Data and Forecast of Chile Chemotherapy? Market Revenues & Volume By Antimetabolites for the Period 2022-2032F
- Historical Data and Forecast of Chile Chemotherapy? Market Revenues & Volume By Topoisomerase Inhibitors for the Period 2022-2032F
- Historical Data and Forecast of Chile Chemotherapy? Market Revenues & Volume By Antitumor Antibiotic for the Period 2022-2032F
- Historical Data and Forecast of Chile Chemotherapy? Market Revenues & Volume By Indication for the Period 2022-2032F
- Historical Data and Forecast of Chile Chemotherapy? Market Revenues & Volume By Lung Cancer for the Period 2022-2032F
- Historical Data and Forecast of Chile Chemotherapy? Market Revenues & Volume By Breast Cancer for the Period 2022-2032F
- Historical Data and Forecast of Chile Chemotherapy? Market Revenues & Volume By Colorectal Cancer for the Period 2022-2032F
- Historical Data and Forecast of Chile Chemotherapy? Market Revenues & Volume By Prostate Cancer for the Period 2022-2032F
- Historical Data and Forecast of Chile Chemotherapy? Market Revenues & Volume By Stomach Cancer for the Period 2022-2032F
- Historical Data and Forecast of Chile Chemotherapy? Market Revenues & Volume By Lymphoma for the Period 2022-2032F
- Historical Data and Forecast of Chile Chemotherapy? Market Revenues & Volume By Leukemia for the Period 2022-2032F
- Historical Data and Forecast of Chile Chemotherapy? Market Revenues & Volume By Ovarian Cancer for the Period 2022-2032F
- Historical Data and Forecast of Chile Chemotherapy? Market Revenues & Volume By Route of Drug Administration for the Period 2022-2032F
- Historical Data and Forecast of Chile Chemotherapy? Market Revenues & Volume By Intravenous for the Period 2022-2032F
- Historical Data and Forecast of Chile Chemotherapy? Market Revenues & Volume By Oral for the Period 2022-2032F
- Historical Data and Forecast of Chile Chemotherapy? Market Revenues & Volume By Subcutaneous for the Period 2022-2032F
- Historical Data and Forecast of Chile Chemotherapy? Market Revenues & Volume By Intra-Muscular for the Period 2022-2032F
- Historical Data and Forecast of Chile Chemotherapy? Market Revenues & Volume By Intravesicular for the Period 2022-2032F
- Historical Data and Forecast of Chile Chemotherapy? Market Revenues & Volume By Topical for the Period 2022-2032F
- Historical Data and Forecast of Chile Chemotherapy? Market Revenues & Volume By Intraperitoneal for the Period 2022-2032F
- Historical Data and Forecast of Chile Chemotherapy? Market Revenues & Volume By Intraventricular/Intrathecal for the Period 2022-2032F
- Historical Data and Forecast of Chile Chemotherapy? Market Revenues & Volume By End-Users for the Period 2022-2032F
- Historical Data and Forecast of Chile Chemotherapy? Market Revenues & Volume By Specialty Centers for the Period 2022-2032F
- Historical Data and Forecast of Chile Chemotherapy? Market Revenues & Volume By Hospitals & Clinics for the Period 2022-2032F
- Chile Chemotherapy? Import Export Trade Statistics
- Market Opportunity Assessment By Drug Class
- Market Opportunity Assessment By Indication
- Market Opportunity Assessment By Route of Drug Administration
- Market Opportunity Assessment By End-Users
- Chile Chemotherapy? Top Companies Market Share
- Chile Chemotherapy? Competitive Benchmarking By Technical and Operational Parameters
- Chile Chemotherapy? Company Profiles
- Chile Chemotherapy? Key Strategic Recommendations
Frequently Asked Questions About the Market Study (FAQs):
The growth is primarily driven by the rising incidence of cancer, advancements in cancer treatments, and enhanced healthcare access through government initiatives.
Key challenges include high treatment costs, limited access to advanced therapies for some populations, and variations in treatment quality among healthcare facilities.
Yes, the growing demand for innovative chemotherapy treatments and the increasing prevalence of cancer create several lucrative investment opportunities in the pharmaceutical and healthcare sectors.
The Chilean government is implementing price controls, reimbursement schemes, and quality control measures to ensure that patients have access to safe and effective chemotherapy treatments.
6Wresearch actively monitors the Chile Chemotherapy Market and publishes its comprehensive annual report, highlighting emerging trends, growth drivers, revenue analysis, and forecast outlook. Our insights help businesses to make data-backed strategic decisions with ongoing market dynamics. Our analysts track relevent industries related to the Chile Chemotherapy Market, allowing our clients with actionable intelligence and reliable forecasts tailored to emerging regional needs.
Yes, we provide customisation as per your requirements. To learn more, feel free to contact us on sales@6wresearch.com
1 Executive Summary |
2 Introduction |
2.1 Key Highlights of the Report |
2.2 Report Description |
2.3 Market Scope & Segmentation |
2.4 Research Methodology |
2.5 Assumptions |
3 Chile Chemotherapy Market Overview |
3.1 Chile Country Macro Economic Indicators |
3.2 Chile Chemotherapy Market Revenues & Volume, 2022 & 2032F |
3.3 Chile Chemotherapy Market - Industry Life Cycle |
3.4 Chile Chemotherapy Market - Porter's Five Forces |
3.5 Chile Chemotherapy Market Revenues & Volume Share, By Drug Class, 2022 & 2032F |
3.6 Chile Chemotherapy Market Revenues & Volume Share, By Indication, 2022 & 2032F |
3.7 Chile Chemotherapy Market Revenues & Volume Share, By Route of Drug Administration, 2022 & 2032F |
3.8 Chile Chemotherapy Market Revenues & Volume Share, By End-Users, 2022 & 2032F |
4 Chile Chemotherapy Market Dynamics |
4.1 Impact Analysis |
4.2 Market Drivers |
4.3 Market Restraints |
5 Chile Chemotherapy Market Trends |
6 Chile Chemotherapy Market, By Types |
6.1 Chile Chemotherapy Market, By Drug Class |
6.1.1 Overview and Analysis |
6.1.2 Chile Chemotherapy Market Revenues & Volume, By Drug Class, 2022-2032F |
6.1.3 Chile Chemotherapy Market Revenues & Volume, By Alkylating Agents, 2022-2032F |
6.1.4 Chile Chemotherapy Market Revenues & Volume, By Mitotic Inhibitors, 2022-2032F |
6.1.5 Chile Chemotherapy Market Revenues & Volume, By Antimetabolites, 2022-2032F |
6.1.6 Chile Chemotherapy Market Revenues & Volume, By Topoisomerase Inhibitors, 2022-2032F |
6.1.7 Chile Chemotherapy Market Revenues & Volume, By Antitumor Antibiotic, 2022-2032F |
6.2 Chile Chemotherapy Market, By Indication |
6.2.1 Overview and Analysis |
6.2.2 Chile Chemotherapy Market Revenues & Volume, By Lung Cancer, 2022-2032F |
6.2.3 Chile Chemotherapy Market Revenues & Volume, By Breast Cancer, 2022-2032F |
6.2.4 Chile Chemotherapy Market Revenues & Volume, By Colorectal Cancer, 2022-2032F |
6.2.5 Chile Chemotherapy Market Revenues & Volume, By Prostate Cancer, 2022-2032F |
6.2.6 Chile Chemotherapy Market Revenues & Volume, By Stomach Cancer, 2022-2032F |
6.2.7 Chile Chemotherapy Market Revenues & Volume, By Lymphoma, 2022-2032F |
6.2.8 Chile Chemotherapy Market Revenues & Volume, By Ovarian Cancer, 2022-2032F |
6.2.9 Chile Chemotherapy Market Revenues & Volume, By Ovarian Cancer, 2022-2032F |
6.3 Chile Chemotherapy Market, By Route of Drug Administration |
6.3.1 Overview and Analysis |
6.3.2 Chile Chemotherapy Market Revenues & Volume, By Intravenous, 2022-2032F |
6.3.3 Chile Chemotherapy Market Revenues & Volume, By Oral, 2022-2032F |
6.3.4 Chile Chemotherapy Market Revenues & Volume, By Subcutaneous, 2022-2032F |
6.3.5 Chile Chemotherapy Market Revenues & Volume, By Intra-Muscular, 2022-2032F |
6.3.6 Chile Chemotherapy Market Revenues & Volume, By Intravesicular, 2022-2032F |
6.3.7 Chile Chemotherapy Market Revenues & Volume, By Topical, 2022-2032F |
6.3.8 Chile Chemotherapy Market Revenues & Volume, By Intraventricular/Intrathecal, 2022-2032F |
6.3.9 Chile Chemotherapy Market Revenues & Volume, By Intraventricular/Intrathecal, 2022-2032F |
6.4 Chile Chemotherapy Market, By End-Users |
6.4.1 Overview and Analysis |
6.4.2 Chile Chemotherapy Market Revenues & Volume, By Specialty Centers, 2022-2032F |
6.4.3 Chile Chemotherapy Market Revenues & Volume, By Hospitals & Clinics, 2022-2032F |
7 Chile Chemotherapy Market Import-Export Trade Statistics |
7.1 Chile Chemotherapy Market Export to Major Countries |
7.2 Chile Chemotherapy Market Imports from Major Countries |
8 Chile Chemotherapy Market Key Performance Indicators |
9 Chile Chemotherapy Market - Opportunity Assessment |
9.1 Chile Chemotherapy Market Opportunity Assessment, By Drug Class, 2022 & 2032F |
9.2 Chile Chemotherapy Market Opportunity Assessment, By Indication, 2022 & 2032F |
9.3 Chile Chemotherapy Market Opportunity Assessment, By Route of Drug Administration, 2022 & 2032F |
9.4 Chile Chemotherapy Market Opportunity Assessment, By End-Users, 2022 & 2032F |
10 Chile Chemotherapy Market - Competitive Landscape |
10.1 Chile Chemotherapy Market Revenue Share, By Companies, 2025 |
10.2 Chile Chemotherapy Market Competitive Benchmarking, By Operating and Technical Parameters |
11 Company Profiles |
12 Recommendations |
13 Disclaimer |
Global Go To Market Strategy - 2030
Export potential enables firms to identify high-growth global markets with greater confidence by combining advanced trade intelligence with a structured quantitative methodology. The framework analyzes emerging demand trends and country-level import patterns while integrating macroeconomic and trade datasets such as GDP and population forecasts, bilateral import–export flows, tariff structures, elasticity differentials between developed and developing economies, geographic distance, and import demand projections. Using weighted trade values from 2020–2024 as the base period to project country-to-country export potential for 2030, these inputs are operationalized through calculated drivers such as gravity model parameters, tariff impact factors, and projected GDP per-capita growth. Through an analysis of hidden potentials, demand hotspots, and market conditions that are most favorable to success, this method enables firms to focus on target countries, maximize returns, and global expansion with data, backed by accuracy.
By factoring in the projected importer demand gap that is currently unmet and could be potential opportunity, it identifies the potential for the Exporter (Country) among 190 countries, against the general trade analysis, which identifies the biggest importer or exporter.
To discover high-growth global markets and optimize your business strategy:
Click Here
Pricing
- Single User License$ 1,995
- Department License$ 2,400
- Site License$ 3,120
- Global License$ 3,795

Leadership Perspectives from Industry Events
Search
Thought Leadership and Analyst Meet


Our Clients
6WResearch In News
- India Air Conditioner Market Set for Strong Rebound in 2026 After Weather-Led Correction and GST-Driven Recovery: 6Wresearch
- ADAS in India: How Automatic Emergency Braking, Blind Spot Detection & Driver Monitoring are Transforming Road Safety
- Doha a strategic location for EV manufacturing hub: IPA Qatar
- Demand for luxury TVs surging in the GCC, says Samsung
- Empowering Growth: The Thriving Journey of Bangladesh’s Cable Industry
- Demand for luxury TVs surging in the GCC, says Samsung
Latest Reports
- Poland Fire Protection Systems Market (2026-2032)
- Cape Verde Portable Hand-Thrown Extinguisher Market (2026-2032)
- Canada Portable Hand-Thrown Extinguisher Market (2026-2032)
- Cameroon Portable Hand-Thrown Extinguisher Market (2026-2032)
- Burundi Portable Hand-Thrown Extinguisher Market (2026-2032)
- Burkina Faso Portable Hand-Thrown Extinguisher Market (2026-2032)
- Bulgaria Portable Hand-Thrown Extinguisher Market (2026-2032)
- Brunei Portable Hand-Thrown Extinguisher Market (2026-2032)
- Botswana Portable Hand-Thrown Extinguisher Market (2026-2032)
- Bosnia and Herzegovina Portable Hand-Thrown Extinguisher Market (2026-2032)
Industry Events and Analyst Meet

HIMTEX 2026

India Refining Summit 2026

India EV Show 2026

EV tech India Expo 2026

Auto Tech Asia 2026
Whitepaper
- Middle East & Africa Commercial Security Market Click here to view more.
- Middle East & Africa Fire Safety Systems & Equipment Market Click here to view more.
- GCC Drone Market Click here to view more.
- Middle East Lighting Fixture Market Click here to view more.
- GCC Physical & Perimeter Security Market Click here to view more.