Chile Interactive Tables Market (2025-2031) Outlook | Industry, Companies, Forecast, Share, Analysis, Trends, Value, Revenue, Growth & Size
Market Forecast By Technology (LCD, LED, Capacitive, Others), By Screen Size (32-65 Inch, 65 Inch & Above), By Application (Exhibition & Trade Shows, Education, Retail, Control Room, Hospitality, Transportation, Others) And Competitive Landscape
| Product Code: ETC275048 | Publication Date: Aug 2022 | Updated Date: Oct 2025 | Product Type: Market Research Report | |
| Publisher: 6Wresearch | Author: Ravi Bhandari | No. of Pages: 75 | No. of Figures: 35 | No. of Tables: 20 |
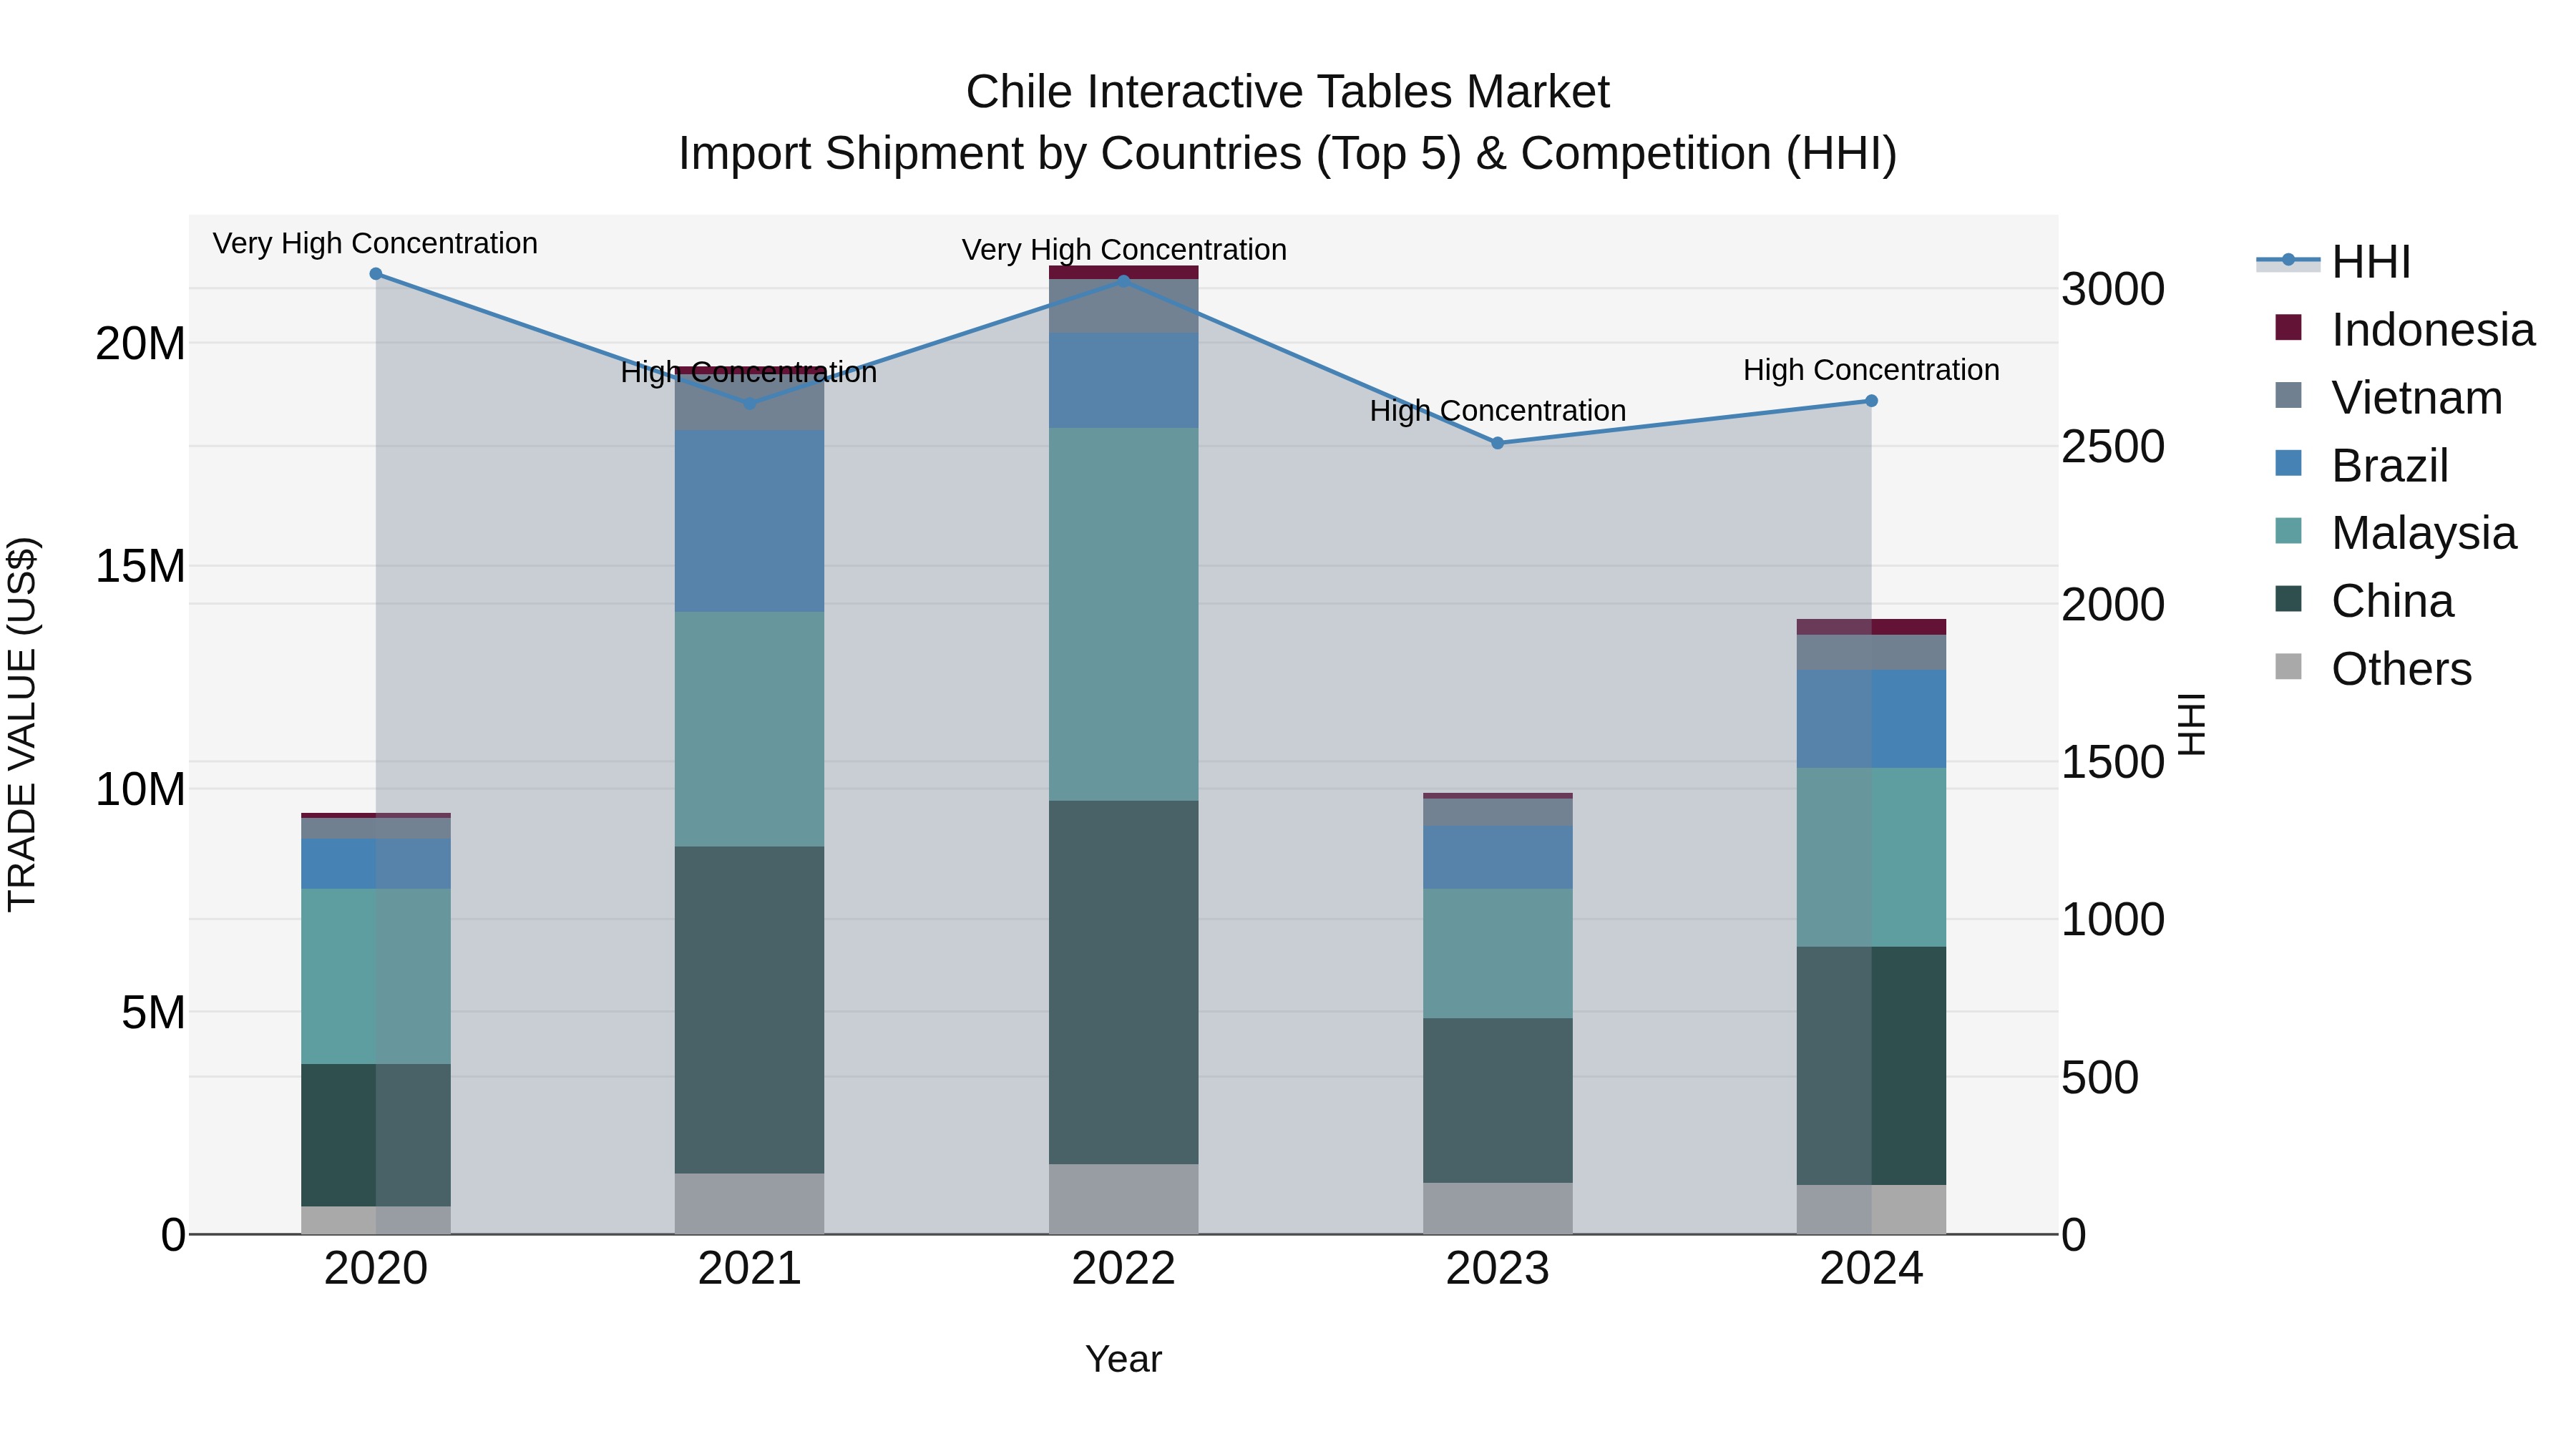
Chile Interactive Tables Market Top 5 Importing Countries and Market Competition (HHI) Analysis
In 2024, Chile continued to experience a strong demand for interactive tables, with top importing countries being China, Malaysia, Brazil, Vietnam, and Indonesia. The market remained highly concentrated, as indicated by the high Herfindahl-Hirschman Index (HHI). The industry exhibited robust growth, with a notable Compound Annual Growth Rate (CAGR) of 9.94% from 2020 to 2024. Moreover, the growth rate surged even further in 2024, reaching 39.39%, reflecting a promising outlook for interactive tables imports in Chile.
Chile Interactive Tables Market Overview
The Chile Interactive Tables market involves the adoption of interactive tabletop display systems equipped with touch or multi-touch capabilities for collaborative learning, interactive gaming, and customer engagement in education, entertainment, hospitality, and retail environments. Interactive tables enable multiple users to interact simultaneously with digital content, applications, and games, fostering collaboration, creativity, and social interaction. With businesses seeking to enhance customer experiences, engage audiences, and differentiate their offerings, the market for interactive tables is witnessing growth, driven by demand for interactive display technologies, touch-sensitive surfaces, and customizable interactive table solutions that enable immersive and interactive experiences in public spaces, retail stores, and entertainment venues.
Drivers of the market
The interactive tables market in Chile is witnessing steady growth driven by the increasing demand for interactive learning environments, collaborative workspaces, and customer engagement solutions in education, retail, hospitality, and entertainment sectors. Interactive tables integrate touchscreen displays, multimedia content, and interactive software applications to provide users with immersive experiences, information access, and interactive entertainment options. Factors such as the shift towards digitalization, the demand for experiential retail concepts, and advancements in display technology are driving market growth in Chile.
Challenges of the market
The interactive tables market in Chile confronts challenges related to market education and product differentiation. While interactive tables offer opportunities for collaborative learning and interactive experiences, there is a need to raise awareness about the benefits and applications of this technology. Moreover, competition from alternative interactive solutions and budget constraints pose challenges for table manufacturers, requiring creativity and innovation to stand out in the market. Additionally, ensuring durability and reliability in diverse usage environments adds complexity to table design and production efforts. Successfully addressing these challenges requires collaboration between table vendors, educational institutions, and commercial clients to develop solutions that meet specific needs and deliver tangible value.
Government Policy of the market
The government promotes the adoption of interactive tables for collaborative learning, interactive presentations, and customer engagement. Policies may include investment in educational technology, support for digital content development, and initiatives to enhance digital literacy.
Key Highlights of the Report:
- Chile Interactive Tables Market Outlook
- Market Size of Chile Interactive Tables Market, 2024
- Forecast of Chile Interactive Tables Market, 2031
- Historical Data and Forecast of Chile Interactive Tables Revenues & Volume for the Period 2021-2031
- Chile Interactive Tables Market Trend Evolution
- Chile Interactive Tables Market Drivers and Challenges
- Chile Interactive Tables Price Trends
- Chile Interactive Tables Porter's Five Forces
- Chile Interactive Tables Industry Life Cycle
- Historical Data and Forecast of Chile Interactive Tables Market Revenues & Volume By Technology for the Period 2021-2031
- Historical Data and Forecast of Chile Interactive Tables Market Revenues & Volume By LCD for the Period 2021-2031
- Historical Data and Forecast of Chile Interactive Tables Market Revenues & Volume By LED for the Period 2021-2031
- Historical Data and Forecast of Chile Interactive Tables Market Revenues & Volume By Capacitive for the Period 2021-2031
- Historical Data and Forecast of Chile Interactive Tables Market Revenues & Volume By Others for the Period 2021-2031
- Historical Data and Forecast of Chile Interactive Tables Market Revenues & Volume By Screen Size for the Period 2021-2031
- Historical Data and Forecast of Chile Interactive Tables Market Revenues & Volume By 32-65 Inch for the Period 2021-2031
- Historical Data and Forecast of Chile Interactive Tables Market Revenues & Volume By 65 Inch & Above for the Period 2021-2031
- Historical Data and Forecast of Chile Interactive Tables Market Revenues & Volume By Application for the Period 2021-2031
- Historical Data and Forecast of Chile Interactive Tables Market Revenues & Volume By Exhibition & Trade Shows for the Period 2021-2031
- Historical Data and Forecast of Chile Interactive Tables Market Revenues & Volume By Education for the Period 2021-2031
- Historical Data and Forecast of Chile Interactive Tables Market Revenues & Volume By Retail for the Period 2021-2031
- Historical Data and Forecast of Chile Interactive Tables Market Revenues & Volume By Control Room for the Period 2021-2031
- Historical Data and Forecast of Chile Interactive Tables Market Revenues & Volume By Hospitality for the Period 2021-2031
- Historical Data and Forecast of Chile Interactive Tables Market Revenues & Volume By Transportation for the Period 2021-2031
- Historical Data and Forecast of Chile Interactive Tables Market Revenues & Volume By Others for the Period 2021-2031
- Chile Interactive Tables Import Export Trade Statistics
- Market Opportunity Assessment By Technology
- Market Opportunity Assessment By Screen Size
- Market Opportunity Assessment By Application
- Chile Interactive Tables Top Companies Market Share
- Chile Interactive Tables Competitive Benchmarking By Technical and Operational Parameters
- Chile Interactive Tables Company Profiles
- Chile Interactive Tables Key Strategic Recommendations
Frequently Asked Questions About the Market Study (FAQs):
6Wresearch actively monitors the Chile Interactive Tables Market and publishes its comprehensive annual report, highlighting emerging trends, growth drivers, revenue analysis, and forecast outlook. Our insights help businesses to make data-backed strategic decisions with ongoing market dynamics. Our analysts track relevent industries related to the Chile Interactive Tables Market, allowing our clients with actionable intelligence and reliable forecasts tailored to emerging regional needs.
Yes, we provide customisation as per your requirements. To learn more, feel free to contact us on sales@6wresearch.com
1 Executive Summary |
2 Introduction |
2.1 Key Highlights of the Report |
2.2 Report Description |
2.3 Market Scope & Segmentation |
2.4 Research Methodology |
2.5 Assumptions |
3 Chile Interactive Tables Market Overview |
3.1 Chile Country Macro Economic Indicators |
3.2 Chile Interactive Tables Market Revenues & Volume, 2021 & 2031F |
3.3 Chile Interactive Tables Market - Industry Life Cycle |
3.4 Chile Interactive Tables Market - Porter's Five Forces |
3.5 Chile Interactive Tables Market Revenues & Volume Share, By Technology, 2021 & 2031F |
3.6 Chile Interactive Tables Market Revenues & Volume Share, By Screen Size, 2021 & 2031F |
3.7 Chile Interactive Tables Market Revenues & Volume Share, By Application, 2021 & 2031F |
4 Chile Interactive Tables Market Dynamics |
4.1 Impact Analysis |
4.2 Market Drivers |
4.2.1 Increasing demand for interactive technology solutions in educational institutions and corporate offices |
4.2.2 Growing trend of digital transformation in various industries, driving the adoption of interactive tables for efficient collaboration and communication |
4.2.3 Rising popularity of interactive tables in the hospitality and entertainment sectors for enhancing customer experience |
4.3 Market Restraints |
4.3.1 High initial investment cost associated with interactive table technology, limiting adoption especially among small and medium-sized enterprises |
4.3.2 Concerns regarding data security and privacy issues related to the use of interactive tables, leading to hesitancy in adoption by some organizations |
5 Chile Interactive Tables Market Trends |
6 Chile Interactive Tables Market, By Types |
6.1 Chile Interactive Tables Market, By Technology |
6.1.1 Overview and Analysis |
6.1.2 Chile Interactive Tables Market Revenues & Volume, By Technology, 2021-2031F |
6.1.3 Chile Interactive Tables Market Revenues & Volume, By LCD, 2021-2031F |
6.1.4 Chile Interactive Tables Market Revenues & Volume, By LED, 2021-2031F |
6.1.5 Chile Interactive Tables Market Revenues & Volume, By Capacitive, 2021-2031F |
6.1.6 Chile Interactive Tables Market Revenues & Volume, By Others, 2021-2031F |
6.2 Chile Interactive Tables Market, By Screen Size |
6.2.1 Overview and Analysis |
6.2.2 Chile Interactive Tables Market Revenues & Volume, By 32-65 Inch, 2021-2031F |
6.2.3 Chile Interactive Tables Market Revenues & Volume, By 65 Inch & Above, 2021-2031F |
6.3 Chile Interactive Tables Market, By Application |
6.3.1 Overview and Analysis |
6.3.2 Chile Interactive Tables Market Revenues & Volume, By Exhibition & Trade Shows, 2021-2031F |
6.3.3 Chile Interactive Tables Market Revenues & Volume, By Education, 2021-2031F |
6.3.4 Chile Interactive Tables Market Revenues & Volume, By Retail, 2021-2031F |
6.3.5 Chile Interactive Tables Market Revenues & Volume, By Control Room, 2021-2031F |
6.3.6 Chile Interactive Tables Market Revenues & Volume, By Hospitality, 2021-2031F |
6.3.7 Chile Interactive Tables Market Revenues & Volume, By Transportation, 2021-2031F |
7 Chile Interactive Tables Market Import-Export Trade Statistics |
7.1 Chile Interactive Tables Market Export to Major Countries |
7.2 Chile Interactive Tables Market Imports from Major Countries |
8 Chile Interactive Tables Market Key Performance Indicators |
8.1 Average time spent by users on interactive tables per session |
8.2 Rate of return customers in establishments using interactive tables |
8.3 Number of new applications and software developed for interactive table platforms |
8.4 Level of user engagement and interaction with content on interactive tables |
9 Chile Interactive Tables Market - Opportunity Assessment |
9.1 Chile Interactive Tables Market Opportunity Assessment, By Technology, 2021 & 2031F |
9.2 Chile Interactive Tables Market Opportunity Assessment, By Screen Size, 2021 & 2031F |
9.3 Chile Interactive Tables Market Opportunity Assessment, By Application, 2021 & 2031F |
10 Chile Interactive Tables Market - Competitive Landscape |
10.1 Chile Interactive Tables Market Revenue Share, By Companies, 2024 |
10.2 Chile Interactive Tables Market Competitive Benchmarking, By Operating and Technical Parameters |
11 Company Profiles |
12 Recommendations |
13 Disclaimer |
Export potential assessment - trade Analytics for 2030
Export potential enables firms to identify high-growth global markets with greater confidence by combining advanced trade intelligence with a structured quantitative methodology. The framework analyzes emerging demand trends and country-level import patterns while integrating macroeconomic and trade datasets such as GDP and population forecasts, bilateral import–export flows, tariff structures, elasticity differentials between developed and developing economies, geographic distance, and import demand projections. Using weighted trade values from 2020–2024 as the base period to project country-to-country export potential for 2030, these inputs are operationalized through calculated drivers such as gravity model parameters, tariff impact factors, and projected GDP per-capita growth. Through an analysis of hidden potentials, demand hotspots, and market conditions that are most favorable to success, this method enables firms to focus on target countries, maximize returns, and global expansion with data, backed by accuracy.
By factoring in the projected importer demand gap that is currently unmet and could be potential opportunity, it identifies the potential for the Exporter (Country) among 190 countries, against the general trade analysis, which identifies the biggest importer or exporter.
To discover high-growth global markets and optimize your business strategy:
Click Here
Pricing
- Single User License$ 1,995
- Department License$ 2,400
- Site License$ 3,120
- Global License$ 3,795

Search
Thought Leadership and Analyst Meet


Our Clients
Latest Reports
- Philippines Polyhydroxybutyrate-co-Hydroxyvalerate Market (2026-2032) | Trends, Insights, Challenges, Restraints, Competition, Size, Value, Forecast, Pricing, Share, Outlook, Revenue, Investment Opportunities, Strategy, Drivers, Demand, Growth, segmentation, Analysis, Companies
- Peru Polyhydroxybutyrate-co-Hydroxyvalerate Market (2026-2032) | Growth, Demand, Challenges, Share, Trends, Analysis, Pricing, Investment Opportunities, Drivers, Value, Forecast, Competition, Size, Companies, Insights, Outlook, Restraints, segmentation, Revenue, Strategy
- Pakistan Polyhydroxybutyrate-co-Hydroxyvalerate Market (2026-2032) | Restraints, segmentation, Pricing, Forecast, Share, Strategy, Competition, Trends, Insights, Drivers, Challenges, Growth, Revenue, Outlook, Value, Investment Opportunities, Companies, Size, Analysis, Demand
- Oman Polyhydroxybutyrate-co-Hydroxyvalerate Market (2026-2032) | Drivers, segmentation, Insights, Competition, Pricing, Outlook, Size, Revenue, Challenges, Forecast, Analysis, Growth, Value, Share, Trends, Investment Opportunities, Strategy, Restraints, Companies, Demand
- Nigeria Polyhydroxybutyrate-co-Hydroxyvalerate Market (2026-2032) | Value, Investment Opportunities, Analysis, Revenue, Restraints, Pricing, Outlook, Competition, Demand, Growth, Forecast, Companies, Trends, Challenges, segmentation, Drivers, Insights, Share, Size, Strategy
- Nepal Polyhydroxybutyrate-co-Hydroxyvalerate Market (2026-2032) | Insights, Analysis, Drivers, Share, Revenue, Demand, segmentation, Investment Opportunities, Competition, Forecast, Growth, Pricing, Companies, Strategy, Trends, Restraints, Challenges, Outlook, Size, Value
- Myanmar Polyhydroxybutyrate-co-Hydroxyvalerate Market (2026-2032) | Outlook, Revenue, Strategy, Restraints, Drivers, segmentation, Share, Forecast, Competition, Insights, Growth, Pricing, Size, Demand, Value, Companies, Trends, Challenges, Investment Opportunities, Analysis
- Morocco Polyhydroxybutyrate-co-Hydroxyvalerate Market (2026-2032) | Outlook, Investment Opportunities, Restraints, Strategy, Forecast, Challenges, Drivers, Growth, Companies, segmentation, Trends, Size, Competition, Revenue, Demand, Insights, Share, Analysis, Value, Pricing
- Mexico Polyhydroxybutyrate-co-Hydroxyvalerate Market (2026-2032) | Size, Drivers, Outlook, Share, Strategy, Growth, Pricing, Challenges, Companies, Demand, Value, Investment Opportunities, Restraints, Trends, Forecast, segmentation, Analysis, Insights, Competition, Revenue
- Malaysia Polyhydroxybutyrate-co-Hydroxyvalerate Market (2026-2032) | Share, segmentation, Size, Companies, Analysis, Insights, Forecast, Value, Revenue, Drivers, Restraints, Challenges, Investment Opportunities, Trends, Competition, Strategy, Demand, Growth, Outlook, Pricing
Industry Events and Analyst Meet

HIMTEX 2026

India Refining Summit 2026

India EV Show 2026

EV tech India Expo 2026

Auto Tech Asia 2026
Whitepaper
- Middle East & Africa Commercial Security Market Click here to view more.
- Middle East & Africa Fire Safety Systems & Equipment Market Click here to view more.
- GCC Drone Market Click here to view more.
- Middle East Lighting Fixture Market Click here to view more.
- GCC Physical & Perimeter Security Market Click here to view more.
6WResearch In News
- Doha a strategic location for EV manufacturing hub: IPA Qatar
- Demand for luxury TVs surging in the GCC, says Samsung
- Empowering Growth: The Thriving Journey of Bangladesh’s Cable Industry
- Demand for luxury TVs surging in the GCC, says Samsung
- Video call with a traditional healer? Once unthinkable, it’s now common in South Africa
- Intelligent Buildings To Smooth GCC’s Path To Net Zero