China Electric Conductors Market (2026-2032) | Share, Analysis, Size, Value, Outlook, Revenue, Growth, Forecast, Companies, Industry & Trends
Market Forecast By Product Types (AAC (All Aluminum Conductor), AAAC (All Aluminum Alloy Conductor), ACSR (Aluminum Conductor Steel Reinforced), ACAR (Aluminum Conductor Aluminum Alloy Reinforced)), By Applications (Power Cables, Transformer, Busbars, Submarine Power Cables) And Competitive Landscape
| Product Code: ETC006341 | Publication Date: Sep 2020 | Updated Date: Jun 2026 | Product Type: Report | |
| Publisher: 6Wresearch | Author: Ravi Bhandari | No. of Pages: 70 | No. of Figures: 35 | No. of Tables: 5 |
China Electric Conductors Market Summary
The china electric conductors market was estimated at USD 226 Million in 2025 and is projected to reach USD 261 Million by 2032, growing at a CAGR of 3.9% from 2026 to 2032.
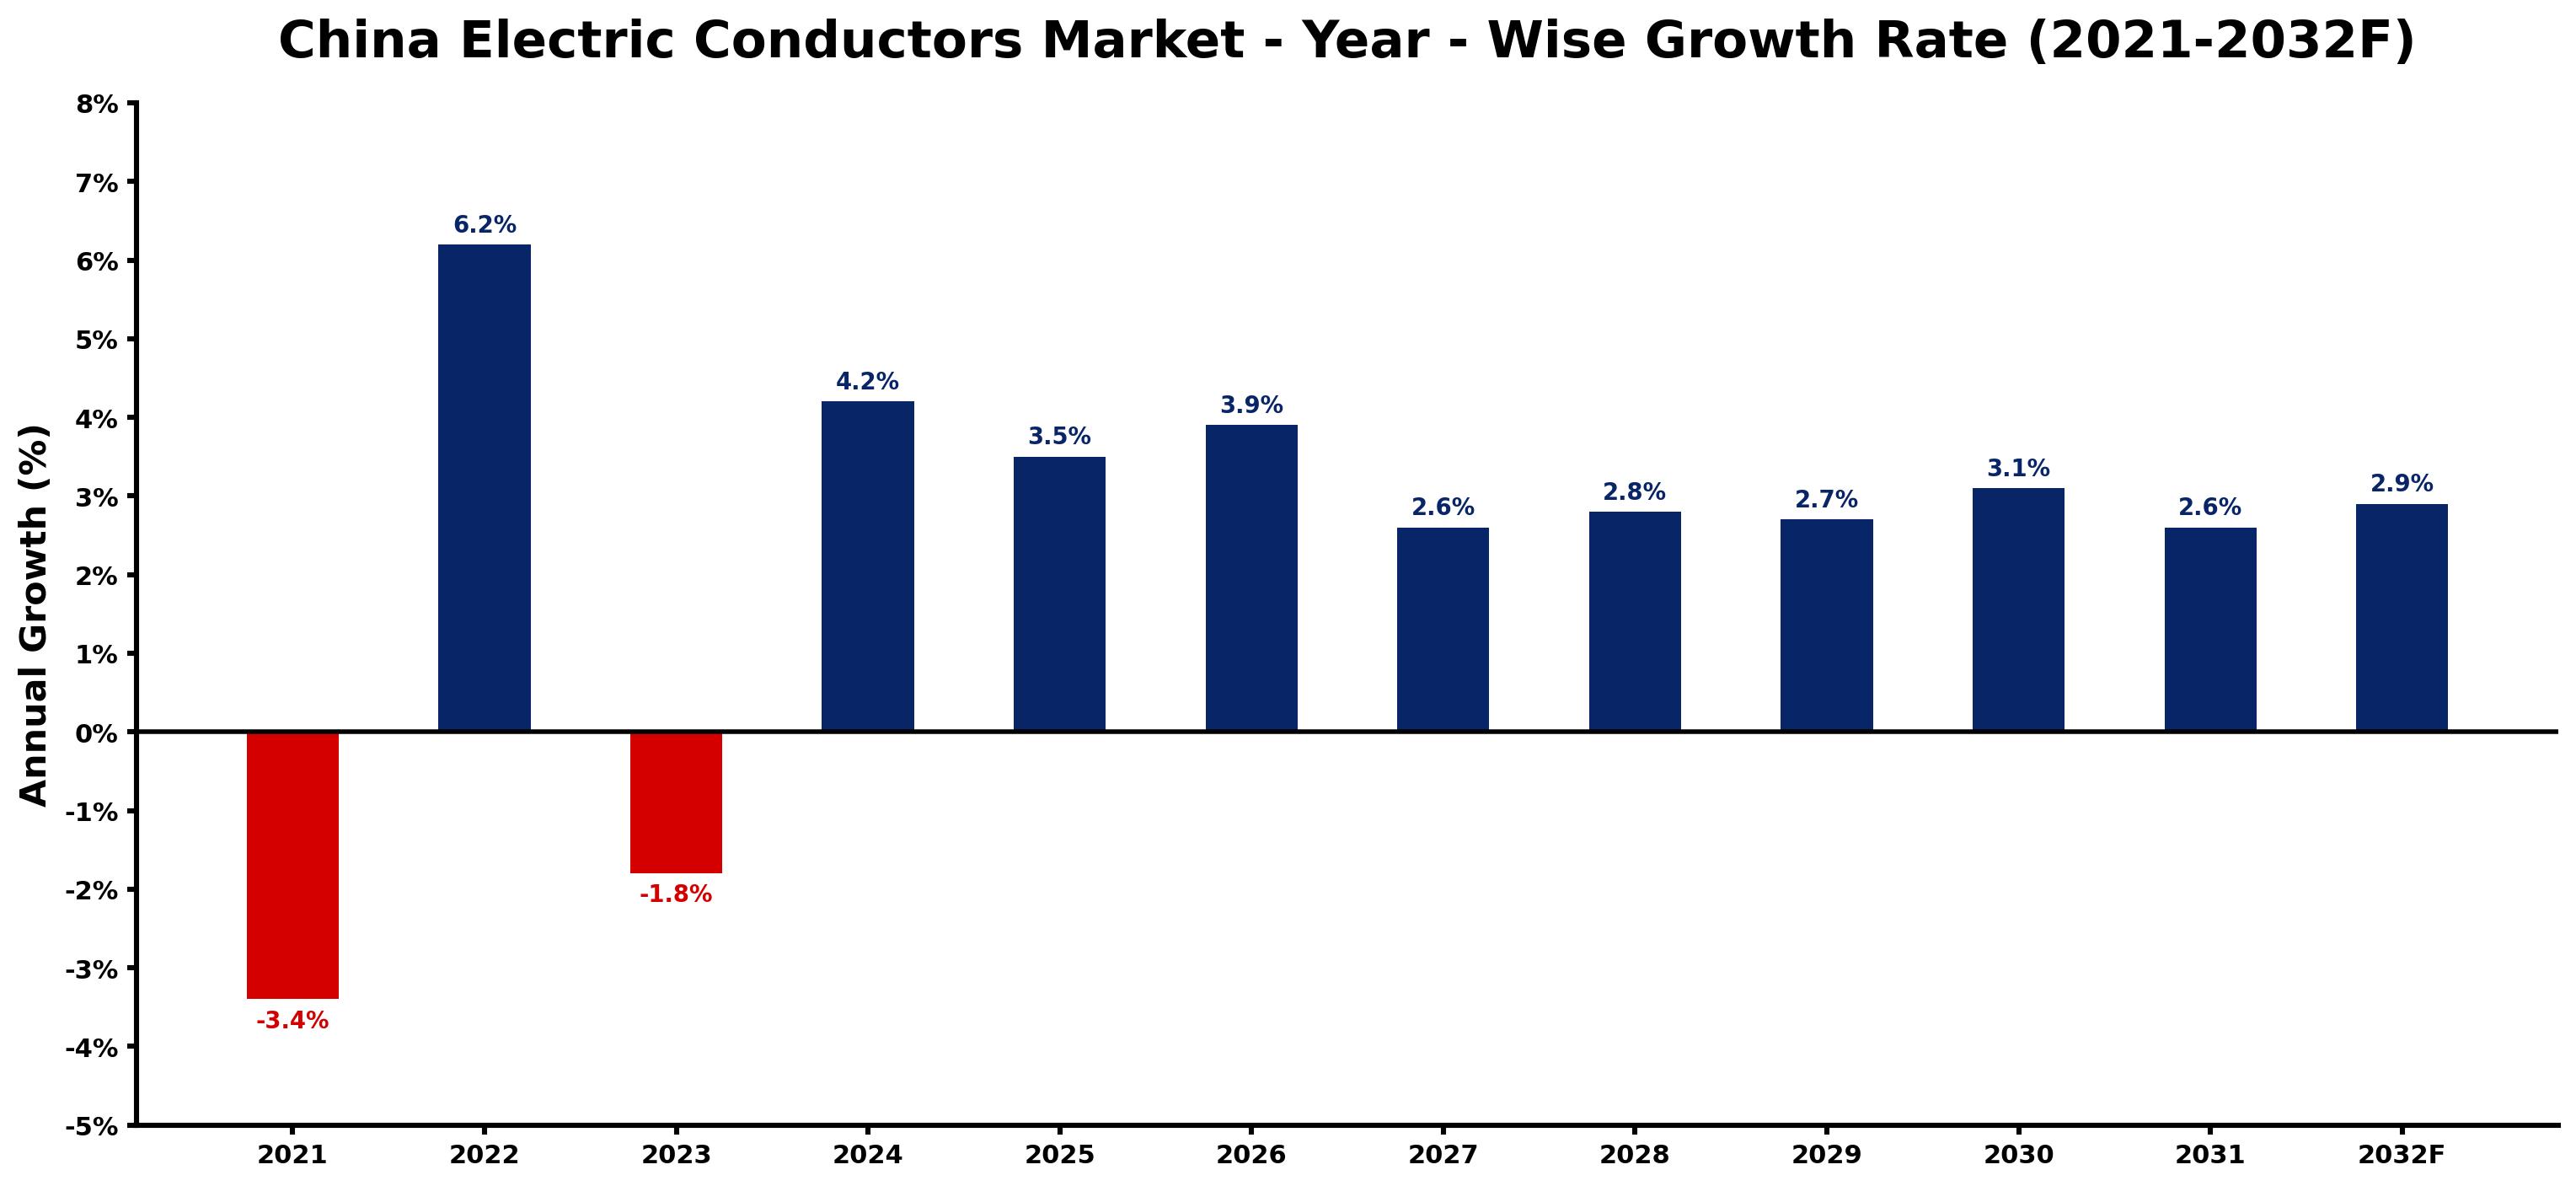
China Electric Conductors Market Growth Rate Analysis (2021-2032)
The China Electric Conductors Market has experienced notable fluctuations over recent years, highlighted by a 3.4% decline in 2021, attributed to supply chain disruptions and economic slowdowns. However, 2022 marked a resurgence, with growth of 6.2%, driven by increased investments in renewable energy infrastructure and robust consumer demand for cleaner energy solutions. While 2023 saw another dip at -1.8%, the market is poised for recovery, projecting a steady growth of 4.2% in 2024 and an average of 2.8% through 2028. This upward trend is supported by advancements in technology and ongoing digitalization efforts, as China accelerates its energy transition policies to meet ambitious carbon neutrality goals.
China Electric Conductors Market Year-wise Growth Rate and Key Drivers
This graph highlights how the China Electric Conductors Market has steadily grown over the past five years, supported by major growth factors.
The table below presents the year wise growth rates along with the key drivers influencing the market
| Year | Growth Rate | Major Drivers |
| 2021 | -3.4% | Intensified competition from alternative energy sources eroded market share for traditional electric conductors. |
| 2022 | 6.2% | Renewable energy projects multiplied, significantly boosting demand for advanced electrical conductors. |
| 2023 | -1.8% | Increased geopolitical tensions hindered investments, leading to reduced infrastructure development and lower demand for electric conductors. |
| 2024 | 4.2% | Electric vehicle production ramped up, driving the need for specialized electrical components. |
| 2025 | 3.5% | Construction booms in tier-one cities expanded demand for efficient conductor solutions. |
| 2026 | 3.9% | Industrial automation enhancements necessitated robust conductors for energy-intensive processes. |
| 2027 | 2.6% | Regional focus on electric heating solutions fueled growth in conductor applications. |
| 2028 | 2.8% | International partnerships in technology transfer increased innovation in conductor materials and designs. |
| 2029 | 2.7% | Emerging sectors like AI and IoT demanded high-performance conductors for connectivity. |
| 2030 | 3.1% | Aging infrastructure led to retrofitting initiatives, elevating the need for advanced conductors. |
| 2031 | 2.6% | Rural electrification efforts gained momentum, expanding markets for affordable electrical solutions. |
| 2032 | 2.9% | Sustainable manufacturing practices reshaped supply chains, prioritizing eco-friendly conductor options. |
Note - Market size estimations and growth projections presented in this report are based on 6Wresearch's advanced forecasting approach, validated with industry datasets as of June 2026.
Key Highlights of the Report:
- China Electric Conductors Market Outlook
- Market Size of China Electric Conductors Market, 2025
- Forecast of China Electric Conductors Market, 2032F
- Historical Data and Forecast of China Electric Conductors Revenues & Volume for the Period 2022-2032F
- China Electric Conductors Market Trend Evolution
- China Electric Conductors Market Drivers and Challenges
- China Electric Conductors Price Trends
- China Electric Conductors Porter's Five Forces
- China Electric Conductors Industry Life Cycle
- Historical Data and Forecast of China Electric Conductors Market Revenues & Volume By Product Types for the Period 2022-2032F
- Historical Data and Forecast of China Electric Conductors Market Revenues & Volume By AAC (All Aluminum Conductor) for the Period 2022-2032F
- Historical Data and Forecast of China Electric Conductors Market Revenues & Volume By AAAC (All Aluminum Alloy Conductor) for the Period 2022-2032F
- Historical Data and Forecast of China Electric Conductors Market Revenues & Volume By ACSR (Aluminum Conductor Steel Reinforced) for the Period 2022-2032F
- Historical Data and Forecast of China Electric Conductors Market Revenues & Volume By ACAR (Aluminum Conductor Aluminum Alloy Reinforced) for the Period 2022-2032F
- Historical Data and Forecast of China Electric Conductors Market Revenues & Volume By Applications for the Period 2022-2032F
- Historical Data and Forecast of China Electric Conductors Market Revenues & Volume By Power Cables for the Period 2022-2032F
- Historical Data and Forecast of China Electric Conductors Market Revenues & Volume By Transformer for the Period 2022-2032F
- Historical Data and Forecast of China Electric Conductors Market Revenues & Volume By Busbars for the Period 2022-2032F
- Historical Data and Forecast of China Electric Conductors Market Revenues & Volume By Submarine Power Cables for the Period 2022-2032F
- China Electric Conductors Import Export Trade Statistics
- Market Opportunity Assessment By Product Types
- Market Opportunity Assessment By Applications
- China Electric Conductors Top Companies Market Share
- China Electric Conductors Competitive Benchmarking By Technical and Operational Parameters
- China Electric Conductors Company Profiles
- China Electric Conductors Key Strategic Recommendations
Frequently Asked Questions About the Market Study (FAQs):
6Wresearch actively monitors the China Electric Conductors Market and publishes its comprehensive annual report, highlighting emerging trends, growth drivers, revenue analysis, and forecast outlook. Our insights help businesses to make data-backed strategic decisions with ongoing market dynamics. Our analysts track relevent industries related to the China Electric Conductors Market, allowing our clients with actionable intelligence and reliable forecasts tailored to emerging regional needs.
Yes, we provide customisation as per your requirements. To learn more, feel free to contact us on sales@6wresearch.com
1 Executive Summary |
2 Introduction |
2.1 Key Highlights of the Report |
2.2 Report Description |
2.3 Market Scope & Segmentation |
2.4 Research Methodology |
2.5 Assumptions |
3 China Electric Conductors Market Overview |
3.1 China Country Macro Economic Indicators |
3.2 China Electric Conductors Market Revenues & Volume, 2022 & 2032F |
3.3 China Electric Conductors Market - Industry Life Cycle |
3.4 China Electric Conductors Market - Porter's Five Forces |
3.5 China Electric Conductors Market Revenues & Volume Share, By Product Types, 2022 & 2032F |
3.6 China Electric Conductors Market Revenues & Volume Share, By Applications, 2022 & 2032F |
4 China Electric Conductors Market Dynamics |
4.1 Impact Analysis |
4.2 Market Drivers |
4.2.1 Increasing demand for electricity in China due to urbanization and industrialization |
4.2.2 Government initiatives promoting the use of renewable energy sources |
4.2.3 Technological advancements in the electric conductors industry |
4.3 Market Restraints |
4.3.1 Fluctuating prices of raw materials such as copper and aluminum |
4.3.2 Competition from alternative materials like fiber optics |
4.3.3 Stringent regulations related to environmental impact and safety standards |
5 China Electric Conductors Market Trends |
6 China Electric Conductors Market, By Types |
6.1 China Electric Conductors Market, By Product Types |
6.1.1 Overview and Analysis |
6.1.2 China Electric Conductors Market Revenues & Volume, By Product Types, 2022 - 2032F |
6.1.3 China Electric Conductors Market Revenues & Volume, By AAC (All Aluminum Conductor), 2022 - 2032F |
6.1.4 China Electric Conductors Market Revenues & Volume, By AAAC (All Aluminum Alloy Conductor), 2022 - 2032F |
6.1.5 China Electric Conductors Market Revenues & Volume, By ACSR (Aluminum Conductor Steel Reinforced), 2022 - 2032F |
6.1.6 China Electric Conductors Market Revenues & Volume, By ACAR (Aluminum Conductor Aluminum Alloy Reinforced), 2022 - 2032F |
6.2 China Electric Conductors Market, By Applications |
6.2.1 Overview and Analysis |
6.2.2 China Electric Conductors Market Revenues & Volume, By Power Cables, 2022 - 2032F |
6.2.3 China Electric Conductors Market Revenues & Volume, By Transformer, 2022 - 2032F |
6.2.4 China Electric Conductors Market Revenues & Volume, By Busbars, 2022 - 2032F |
6.2.5 China Electric Conductors Market Revenues & Volume, By Submarine Power Cables, 2022 - 2032F |
7 China Electric Conductors Market Import-Export Trade Statistics |
7.1 China Electric Conductors Market Export to Major Countries |
7.2 China Electric Conductors Market Imports from Major Countries |
8 China Electric Conductors Market Key Performance Indicators |
8.1 Average selling price of electric conductors |
8.2 Percentage of electric conductors produced using sustainable materials |
8.3 Number of patents filed for new electric conductor technologies |
8.4 Percentage of energy generated from renewable sources in China |
8.5 Investment in research and development for electric conductor innovations |
9 China Electric Conductors Market - Opportunity Assessment |
9.1 China Electric Conductors Market Opportunity Assessment, By Product Types, 2022 & 2032F |
9.2 China Electric Conductors Market Opportunity Assessment, By Applications, 2022 & 2032F |
10 China Electric Conductors Market - Competitive Landscape |
10.1 China Electric Conductors Market Revenue Share, By Companies, 2025 |
10.2 China Electric Conductors Market Competitive Benchmarking, By Operating and Technical Parameters |
11 Company Profiles |
12 Recommendations |
13 Disclaimer |
Global Go To Market Strategy - 2030
Export potential enables firms to identify high-growth global markets with greater confidence by combining advanced trade intelligence with a structured quantitative methodology. The framework analyzes emerging demand trends and country-level import patterns while integrating macroeconomic and trade datasets such as GDP and population forecasts, bilateral import–export flows, tariff structures, elasticity differentials between developed and developing economies, geographic distance, and import demand projections. Using weighted trade values from 2020–2024 as the base period to project country-to-country export potential for 2030, these inputs are operationalized through calculated drivers such as gravity model parameters, tariff impact factors, and projected GDP per-capita growth. Through an analysis of hidden potentials, demand hotspots, and market conditions that are most favorable to success, this method enables firms to focus on target countries, maximize returns, and global expansion with data, backed by accuracy.
By factoring in the projected importer demand gap that is currently unmet and could be potential opportunity, it identifies the potential for the Exporter (Country) among 190 countries, against the general trade analysis, which identifies the biggest importer or exporter.
To discover high-growth global markets and optimize your business strategy:
Click Here
Pricing
- Single User License$ 1,995
- Department License$ 2,400
- Site License$ 3,120
- Global License$ 3,795

Leadership Perspectives from Industry Events
Search
Thought Leadership and Analyst Meet


Our Clients
6WResearch In News
- India Air Conditioner Market Set for Strong Rebound in 2026 After Weather-Led Correction and GST-Driven Recovery: 6Wresearch
- ADAS in India: How Automatic Emergency Braking, Blind Spot Detection & Driver Monitoring are Transforming Road Safety
- Doha a strategic location for EV manufacturing hub: IPA Qatar
- Demand for luxury TVs surging in the GCC, says Samsung
- Empowering Growth: The Thriving Journey of Bangladesh’s Cable Industry
- Demand for luxury TVs surging in the GCC, says Samsung
Latest Reports
- Nicaragua RPG Gaming Market (2026-2032)
- New Zealand RPG Gaming Market (2026-2032)
- Netherlands RPG Gaming Market (2026-2032)
- Nauru RPG Gaming Market (2026-2032)
- Namibia RPG Gaming Market (2026-2032)
- Mozambique RPG Gaming Market (2026-2032)
- Montenegro RPG Gaming Market (2026-2032)
- Mongolia RPG Gaming Market (2026-2032)
- Monaco RPG Gaming Market (2026-2032)
- Micronesia RPG Gaming Market (2026-2032)
Industry Events and Analyst Meet

HIMTEX 2026

India Refining Summit 2026

India EV Show 2026

EV tech India Expo 2026

Auto Tech Asia 2026
Whitepaper
- Middle East & Africa Commercial Security Market Click here to view more.
- Middle East & Africa Fire Safety Systems & Equipment Market Click here to view more.
- GCC Drone Market Click here to view more.
- Middle East Lighting Fixture Market Click here to view more.
- GCC Physical & Perimeter Security Market Click here to view more.