China industrial vehicles Market (2026-2032) | Companies, Value, Trends, Revenue, Share, Size, Analysis, Outlook, Industry, Growth & Forecast
Market Forecast By Product Type (Forklift, Aisle Truck, Tow Tractor, Container Handler), By Drive Type (Internal Combustion Engine, Battery-Operated, Gas-Powered), By Application (Industrial , Cargo) And Competitive Landscape
| Product Code: ETC029741 | Publication Date: Oct 2020 | Updated Date: Jun 2026 | Product Type: Report | |
| Publisher: 6Wresearch | Author: Ravi Bhandari | No. of Pages: 70 | No. of Figures: 35 | No. of Tables: 5 |
China industrial vehicles Market Summary
The china industrial vehicles market was estimated at USD 248 Million in 2025 and is projected to reach USD 285 Million by 2032, growing at a CAGR of 4.0% from 2026 to 2032.
China industrial vehicles Market Growth Rate Analysis (2021-2032)
The China industrial vehicles market has exhibited a fluctuating growth pattern in recent years. After a decline of 3.9% in 2021 and a modest bounce back of 5.9% in 2022, the market faced another contraction of 1.5% in 2023, largely due to supply chain disruptions and shifting technological demands amid an evolving landscape. However, a recovery phase began in 2024, with a projected growth of 4.3%, driven by increased government investments in infrastructure and a strong push towards energy transition technologies. As the domestic economy stabilizes, growth rates are expected to gradually normalize, with annual increases around 3% from 2025 to 2032, reflecting sustained consumer demand and digitalization trends within the sector.
China industrial vehicles Market Year-wise Growth Rate and Key Drivers
This graph highlights how the China industrial vehicles Market has steadily grown over the past five years, supported by major growth factors.
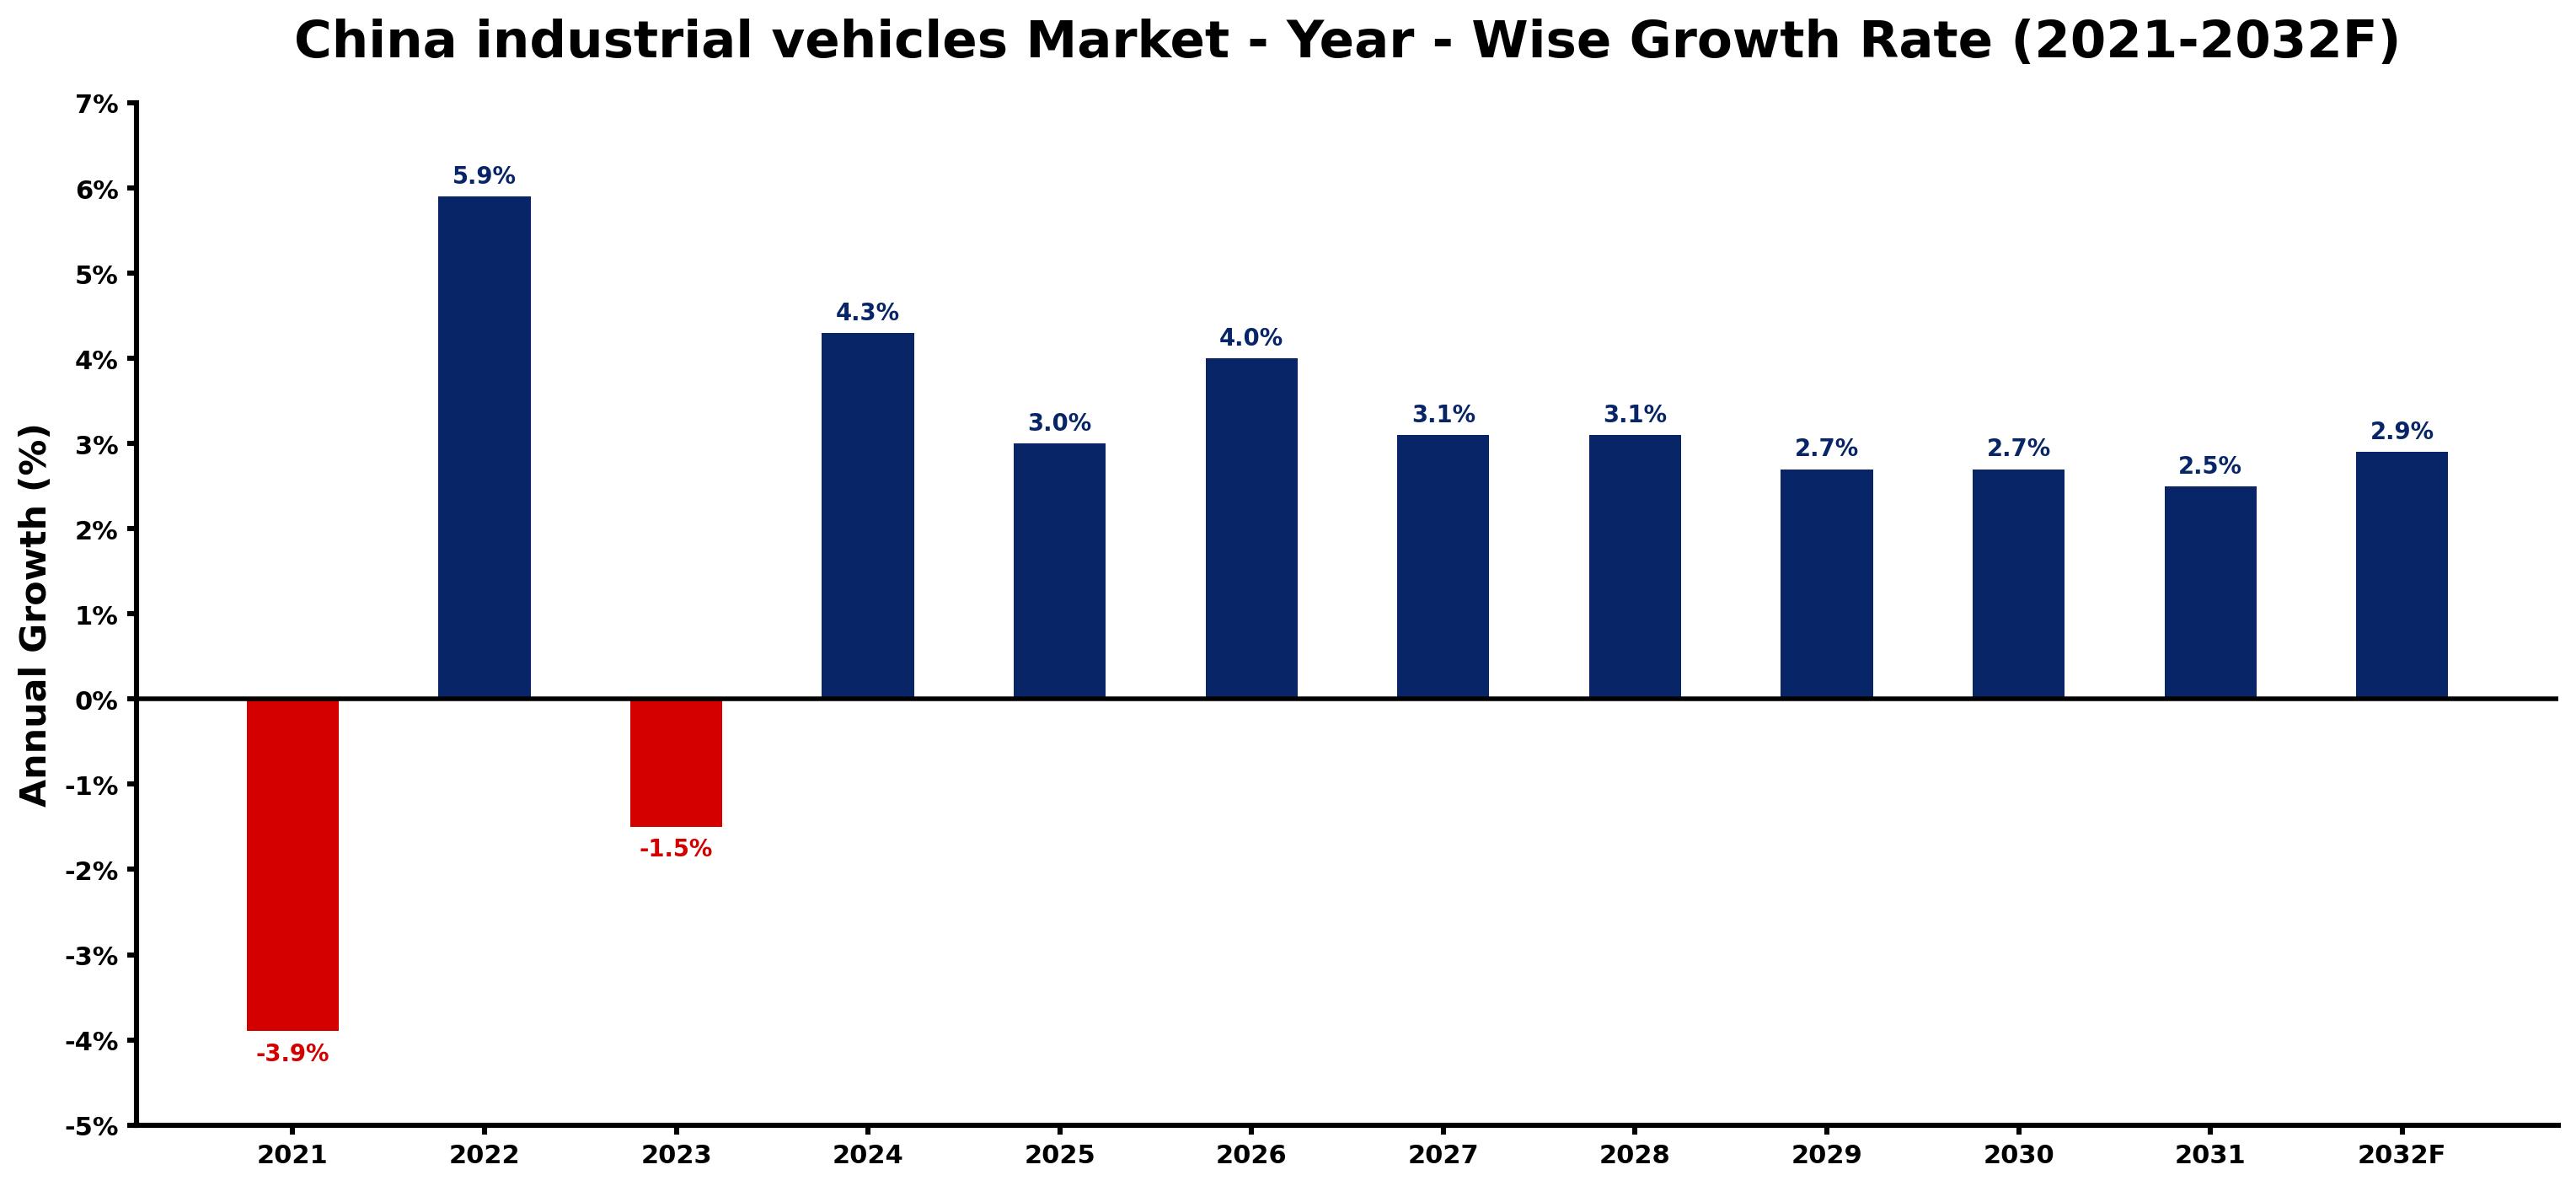
The table below presents the year wise growth rates along with the key drivers influencing the market
| Year | Growth Rate | Major Drivers |
| 2021 | -3.9% | Supply chain disruptions from ongoing pandemic effects hindered vehicle production and delayed market recovery in China. |
| 2022 | 5.9% | Supply chain disruptions highlighted the need for reliable logistics and transportation solutions. |
| 2023 | -1.5% | Increased environmental regulations compelled manufacturers to adapt, leading to higher costs and reduced competitiveness. |
| 2024 | 4.3% | Technological innovations in electric vehicles transformed traditional industrial vehicle manufacturing approaches. |
| 2025 | 3.0% | The shift towards automation in factories necessitated greater utilization of industrial vehicles. |
| 2026 | 4.0% | Emerging environmental considerations prompted industries to explore more sustainable vehicle options. |
| 2027 | 3.1% | Rapid urban expansion created additional requirements for waste management and transport vehicles. |
| 2028 | 3.1% | Competitive pricing in the local market stimulated consumer interest and purchasing decisions. |
| 2029 | 2.7% | Partnerships between tech firms and vehicle manufacturers enhanced operational efficiencies and capabilities. |
| 2030 | 2.7% | Rising labor costs led companies to increasingly invest in automated industrial vehicle solutions. |
| 2031 | 2.5% | Expansion of logistics parks across China drove demand for versatile industrial vehicle fleets. |
| 2032 | 2.9% | Increased emphasis on safety standards required upgrades in industrial vehicle designs and technology. |
Note - Market size estimations and growth projections presented in this report are based on 6Wresearch's advanced forecasting approach, validated with industry datasets as of June 2026.
China industrial vehicles Market Synopsis
The China industrial vehicles Market is projected to reach 4.0% and witness significant growth during the forecast period (2026-2032). This growth is attributed to the increasing investments made by various industries in robust material handling solutions, which are essential for optimizing logistics and operational efficiencies within warehouses and manufacturing environments. Key products in this market include forklifts, pallet trucks, and automated guided vehicles (AGVs), all of which play a crucial role in improving the overall productivity of industrial applications.
China industrial vehicles Market Growth Drivers
The expansion of the China industrial vehicles Market is primarily propelled by several key factors:
- The surging demand for specialized industrial vehicles across various applications such as material handling, construction, and logistics is a major driver of market growth. Forklifts, cranes, and trolleys have become indispensable for transporting and managing heavy loads in industrial settings.
- Rapid industrial activities and the ongoing infrastructure development across China have led to an increased requirement for advanced industrial vehicles. This trend signifies the importance of efficient transportation solutions in supporting economic progress.
- Technological advancements in industrial vehicles, which include improved safety features, automation capabilities, and energy efficiency, are contributing to market momentum and attracting investments.
- As industries strive for higher operational efficiency and productivity, the adoption of cutting-edge industrial vehicles appears increasingly appealing. This trend is expected to sustain market growth.
- The growing emphasis on enhancing material handling capabilities across various sectors further supports the demand for innovative industrial vehicles, enabling companies to streamline their supply chains.
China industrial vehicles Market Challenges and Restraints
Despite the positive outlook for the China industrial vehicles Market, several challenges pose risks to its growth:
- The complexity of developing industrial vehicles that comply with the latest technological advancements while ensuring safety and efficiency remains a significant challenge for manufacturers.
- Regulatory compliance related to environmental and safety standards can hinder the pace of innovation, as companies must invest time and resources to meet these requirements.
- Production costs are under constant pressure, driven by the need to integrate advanced technologies while maintaining competitive pricing, thus affecting profit margins.
- The dynamic nature of market competition necessitates ongoing adaptation and innovation from manufacturers to remain relevant, further stretching resources and capabilities.
- Market fluctuations and uncertainties in demand can impact the planning and production cycles, posing risks to sustained growth and profitability.
China industrial vehicles Market Government Investment and Initiatives
Government policies play a pivotal role in shaping the landscape of the China industrial vehicles Market. The focus on energy efficiency and emissions reduction has led to a series of initiatives aimed at transitioning the industrial sector towards sustainability:
- Regulatory frameworks are being established to promote the adoption of low-emission and electric industrial vehicles within various sectors, contributing to a reduction in environmental impact.
- The Chinese government is offering incentives and subsidies for companies investing in the development and implementation of green vehicle technologies, aiming to facilitate a shift towards more sustainable solutions.
- Public spending on research and development in the industrial vehicle sector is being prioritized to foster innovation, helping manufacturers to develop cutting-edge technologies that align with environmental goals.
- Strategic development plans are being rolled out to encourage infrastructure upgrades necessary for supporting the use of advanced industrial vehicles, thus enhancing overall operational capacities.
- Collaboration between government entities and the private sector is being encouraged to drive progressive changes in industrial vehicle standards and practices, promoting a competitive edge in the global market.
China industrial vehicles Market Latest Developments (May 2025 - June 2026)
During the period from May 2025 to June 2026, the China industrial vehicles Market has witnessed several significant developments that reflect the ongoing evolution of the industry:
- There has been a marked increase in research and development activities, leading to the introduction of advanced technical features in industrial vehicles, enhancing their safety and efficiency.
- Industry players are increasingly exploring partnerships and collaborations to leverage complementary strengths and expedite innovation cycles within the market.
- The focus on automation has intensified, with more companies investing in automated guided vehicles (AGVs) to optimize material handling processes in warehouses and production facilities.
- Electric industrial vehicles are gaining traction, driven by government incentives and an increasing awareness of sustainability among consumers and businesses.
- Regulatory changes aimed at improving workplace safety and environmental standards have prompted manufacturers to accelerate the development of compliant industrial vehicles, further shaping market dynamics.
China industrial vehicles Market - Key Attractiveness of the Report
- 10 Years of Market Numbers
- Historical Data Starting from 2022 to 2025
- Base Year: 2025
- Forecast Data until 2032
- Key Performance Indicators Impacting the Market
- Major Upcoming Developments and Projects
Key Highlights of the Report:
- China industrial vehicles Market Outlook
- Market Size of China industrial vehicles Market, 2025
- Forecast of China industrial vehicles Market, 2032
- Historical Data and Forecast of China industrial vehicles Revenues & Volume for the Period 2022-2032F
- China industrial vehicles Market Trend Evolution
- China industrial vehicles Market Drivers and Challenges
- China industrial vehicles Price Trends
- China industrial vehicles Porter's Five Forces
- China industrial vehicles Industry Life Cycle
- Historical Data and Forecast of China industrial vehicles Market Revenues & Volume By Product Type for the Period 2022-2032F
- Historical Data and Forecast of China industrial vehicles Market Revenues & Volume By Forklift for the Period 2022-2032F
- Historical Data and Forecast of China industrial vehicles Market Revenues & Volume By Aisle Truck for the Period 2022-2032F
- Historical Data and Forecast of China industrial vehicles Market Revenues & Volume By Tow Tractor for the Period 2022-2032F
- Historical Data and Forecast of China industrial vehicles Market Revenues & Volume By Container Handler for the Period 2022-2032F
- Historical Data and Forecast of China industrial vehicles Market Revenues & Volume By Drive Type for the Period 2022-2032F
- Historical Data and Forecast of China industrial vehicles Market Revenues & Volume By Internal Combustion Engine for the Period 2022-2032F
- Historical Data and Forecast of China industrial vehicles Market Revenues & Volume By Battery-Operated for the Period 2022-2032F
- Historical Data and Forecast of China industrial vehicles Market Revenues & Volume By Gas-Powered for the Period 2022-2032F
- Historical Data and Forecast of China industrial vehicles Market Revenues & Volume By Application for the Period 2022-2032F
- Historical Data and Forecast of China industrial vehicles Market Revenues & Volume By Industrial for the Period 2022-2032F
- Historical Data and Forecast of China industrial vehicles Market Revenues & Volume By Cargo for the Period 2022-2032F
- China industrial vehicles Import Export Trade Statistics
- Market Opportunity Assessment By Product Type
- Market Opportunity Assessment By Drive Type
- Market Opportunity Assessment By Application
- China industrial vehicles Top Companies Market Share
- China industrial vehicles Competitive Benchmarking By Technical and Operational Parameters
- China industrial vehicles Company Profiles
- China industrial vehicles Key Strategic Recommendations
Frequently Asked Questions About the Market Study (FAQs):
The market growth is primarily driven by rising demand for specialized vehicles, technological advancements, increased industrial activities, and a focus on operational efficiency.
Government policies that promote energy efficiency and emissions reduction greatly influence the market, with incentives commemorating the adoption of green technologies and low-emission vehicles.
Challenges include the complexities of regulatory compliance, production cost management, competition, and the need for ongoing innovation to meet industry demands.
Emerging trends include a greater emphasis on automation, the rise of electric vehicles, and increased investments in research and development for advanced vehicle technologies.
6Wresearch actively monitors the China industrial vehicles Market and publishes its comprehensive annual report, highlighting emerging trends, growth drivers, revenue analysis, and forecast outlook. Our insights help businesses to make data-backed strategic decisions with ongoing market dynamics. Our analysts track relevent industries related to the China industrial vehicles Market, allowing our clients with actionable intelligence and reliable forecasts tailored to emerging regional needs.
Yes, we provide customisation as per your requirements. To learn more, feel free to contact us on sales@6wresearch.com
1 Executive Summary |
2 Introduction |
2.1 Key Highlights of the Report |
2.2 Report Description |
2.3 Market Scope & Segmentation |
2.4 Research Methodology |
2.5 Assumptions |
3 China industrial vehicles Market Overview |
3.1 China Country Macro Economic Indicators |
3.2 China industrial vehicles Market Revenues & Volume, 2022 & 2032F |
3.3 China industrial vehicles Market - Industry Life Cycle |
3.4 China industrial vehicles Market - Porter's Five Forces |
3.5 China industrial vehicles Market Revenues & Volume Share, By Product Type, 2022 & 2032F |
3.6 China industrial vehicles Market Revenues & Volume Share, By Drive Type, 2022 & 2032F |
3.7 China industrial vehicles Market Revenues & Volume Share, By Application, 2022 & 2032F |
4 China industrial vehicles Market Dynamics |
4.1 Impact Analysis |
4.2 Market Drivers |
4.2.1 Increasing industrialization and infrastructure development in China |
4.2.2 Growing demand for efficient material handling and logistics solutions |
4.2.3 Government initiatives promoting the adoption of electric and eco-friendly industrial vehicles |
4.3 Market Restraints |
4.3.1 High initial costs associated with advanced industrial vehicles |
4.3.2 Economic fluctuations impacting investment decisions in the industrial sector |
4.3.3 Challenges related to battery technology and charging infrastructure for electric vehicles |
5 China industrial vehicles Market Trends |
6 China industrial vehicles Market, By Types |
6.1 China industrial vehicles Market, By Product Type |
6.1.1 Overview and Analysis |
6.1.2 China industrial vehicles Market Revenues & Volume, By Product Type, 2022-2032F |
6.1.3 China industrial vehicles Market Revenues & Volume, By Forklift, 2022-2032F |
6.1.4 China industrial vehicles Market Revenues & Volume, By Aisle Truck, 2022-2032F |
6.1.5 China industrial vehicles Market Revenues & Volume, By Tow Tractor, 2022-2032F |
6.1.6 China industrial vehicles Market Revenues & Volume, By Container Handler, 2022-2032F |
6.2 China industrial vehicles Market, By Drive Type |
6.2.1 Overview and Analysis |
6.2.2 China industrial vehicles Market Revenues & Volume, By Internal Combustion Engine, 2022-2032F |
6.2.3 China industrial vehicles Market Revenues & Volume, By Battery-Operated, 2022-2032F |
6.2.4 China industrial vehicles Market Revenues & Volume, By Gas-Powered, 2022-2032F |
6.3 China industrial vehicles Market, By Application |
6.3.1 Overview and Analysis |
6.3.2 China industrial vehicles Market Revenues & Volume, By Industrial , 2022-2032F |
6.3.3 China industrial vehicles Market Revenues & Volume, By Cargo, 2022-2032F |
7 China industrial vehicles Market Import-Export Trade Statistics |
7.1 China industrial vehicles Market Export to Major Countries |
7.2 China industrial vehicles Market Imports from Major Countries |
8 China industrial vehicles Market Key Performance Indicators |
8.1 Average utilization rate of industrial vehicles in key sectors |
8.2 Adoption rate of eco-friendly industrial vehicles |
8.3 Rate of investment in RD for innovative industrial vehicle technologies |
9 China industrial vehicles Market - Opportunity Assessment |
9.1 China industrial vehicles Market Opportunity Assessment, By Product Type, 2022 & 2032F |
9.2 China industrial vehicles Market Opportunity Assessment, By Drive Type, 2022 & 2032F |
9.3 China industrial vehicles Market Opportunity Assessment, By Application, 2022 & 2032F |
10 China industrial vehicles Market - Competitive Landscape |
10.1 China industrial vehicles Market Revenue Share, By Companies, 2025 |
10.2 China industrial vehicles Market Competitive Benchmarking, By Operating and Technical Parameters |
11 Company Profiles |
12 Recommendations |
13 Disclaimer |
Global Go To Market Strategy - 2030
Export potential enables firms to identify high-growth global markets with greater confidence by combining advanced trade intelligence with a structured quantitative methodology. The framework analyzes emerging demand trends and country-level import patterns while integrating macroeconomic and trade datasets such as GDP and population forecasts, bilateral import–export flows, tariff structures, elasticity differentials between developed and developing economies, geographic distance, and import demand projections. Using weighted trade values from 2020–2024 as the base period to project country-to-country export potential for 2030, these inputs are operationalized through calculated drivers such as gravity model parameters, tariff impact factors, and projected GDP per-capita growth. Through an analysis of hidden potentials, demand hotspots, and market conditions that are most favorable to success, this method enables firms to focus on target countries, maximize returns, and global expansion with data, backed by accuracy.
By factoring in the projected importer demand gap that is currently unmet and could be potential opportunity, it identifies the potential for the Exporter (Country) among 190 countries, against the general trade analysis, which identifies the biggest importer or exporter.
To discover high-growth global markets and optimize your business strategy:
Click Here
Pricing
- Single User License$ 1,995
- Department License$ 2,400
- Site License$ 3,120
- Global License$ 3,795

Leadership Perspectives from Industry Events
Search
Thought Leadership and Analyst Meet


Our Clients
6WResearch In News
- India Air Conditioner Market Set for Strong Rebound in 2026 After Weather-Led Correction and GST-Driven Recovery: 6Wresearch
- ADAS in India: How Automatic Emergency Braking, Blind Spot Detection & Driver Monitoring are Transforming Road Safety
- Doha a strategic location for EV manufacturing hub: IPA Qatar
- Demand for luxury TVs surging in the GCC, says Samsung
- Empowering Growth: The Thriving Journey of Bangladesh’s Cable Industry
- Demand for luxury TVs surging in the GCC, says Samsung
Latest Reports
- Nicaragua RPG Gaming Market (2026-2032)
- New Zealand RPG Gaming Market (2026-2032)
- Netherlands RPG Gaming Market (2026-2032)
- Nauru RPG Gaming Market (2026-2032)
- Namibia RPG Gaming Market (2026-2032)
- Mozambique RPG Gaming Market (2026-2032)
- Montenegro RPG Gaming Market (2026-2032)
- Mongolia RPG Gaming Market (2026-2032)
- Monaco RPG Gaming Market (2026-2032)
- Micronesia RPG Gaming Market (2026-2032)
Industry Events and Analyst Meet

HIMTEX 2026

India Refining Summit 2026

India EV Show 2026

EV tech India Expo 2026

Auto Tech Asia 2026
Whitepaper
- Middle East & Africa Commercial Security Market Click here to view more.
- Middle East & Africa Fire Safety Systems & Equipment Market Click here to view more.
- GCC Drone Market Click here to view more.
- Middle East Lighting Fixture Market Click here to view more.
- GCC Physical & Perimeter Security Market Click here to view more.