China Protective Case Market (2026-2032) | Opportunities, Value, Companies, Segmentation, Forecast, Drivers, Restraints, Strategic Insights, Competitive, Supply, Strategy, Share, Consumer Insights, Demand, Challenges, Outlook, Segments, Pricing Analysis, Industry, Competition, Investment Trends, Revenue, Growth, Trends, Size, Analysis
Market Forecast By Type (Hard Cases, Soft Cases, Waterproof Cases, Custom Cases), By Material (Plastic, Aluminum, Carbon Fiber, Foam), By End-Use (Electronics, Medical Equipment, Photography Gear, Industrial Instruments), By Application (Travel Cases, Tool Protection, Military Equipment, Storage Solutions) And Competitive Landscape
| Product Code: ETC10225221 | Publication Date: Apr 2025 | Updated Date: Apr 2026 | Product Type: Market Research Report | |
| Publisher: 6Wresearch | Author: Bhawna Singh | No. of Pages: 65 | No. of Figures: 34 | No. of Tables: 19 |
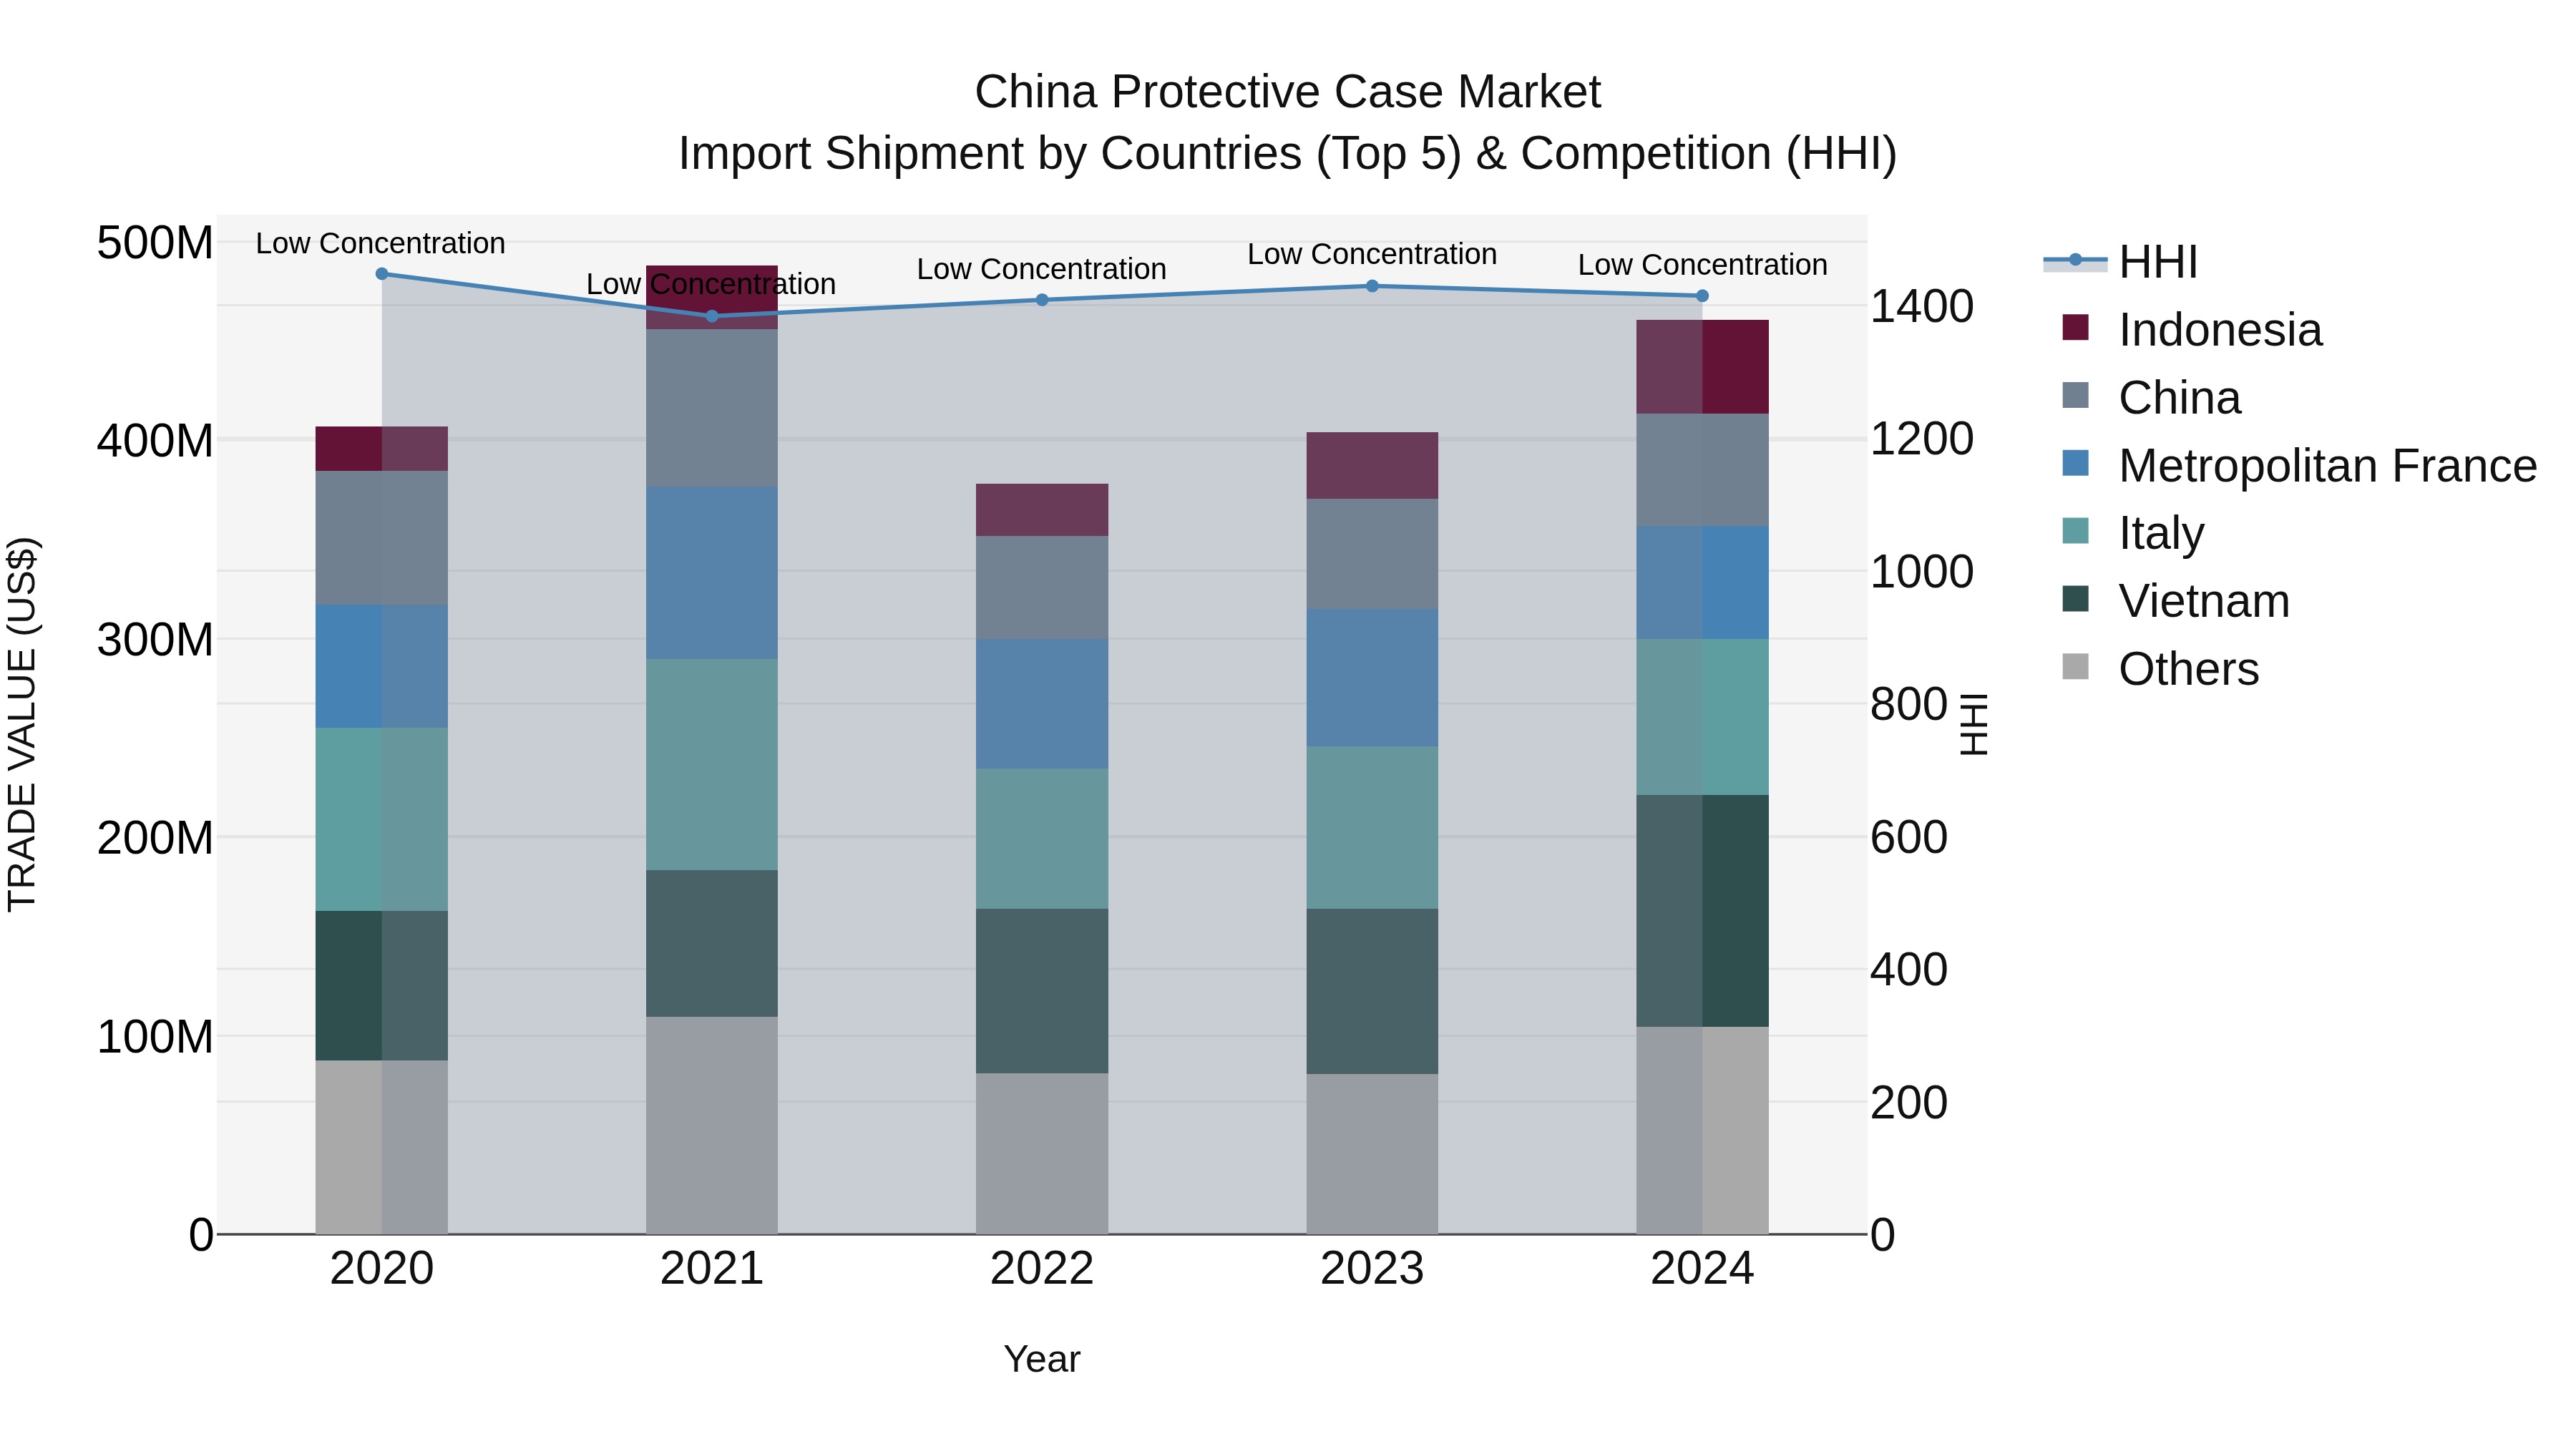
China Protective Case Market Top 5 Importing Countries and Market Competition (HHI) Analysis
In 2024, China continues to see a diverse mix of protective case imports from top countries including Vietnam, Italy, and Metropolitan France. The low Herfindahl-Hirschman Index (HHI) concentration indicates a competitive market landscape. With a steady compound annual growth rate (CAGR) of 3.14% from 2020 to 2024 and a notable growth rate of 13.97% from 2023 to 2024, the protective case import sector in China is showing promising expansion opportunities and sustained interest from key exporting nations.
Key Highlights of the Report:
- China Protective Case Market Outlook
- Market Size of China Protective Case Market, 2025
- Forecast of China Protective Case Market, 2032
- Historical Data and Forecast of China Protective Case Revenues & Volume for the Period 2022 - 2032F
- China Protective Case Market Trend Evolution
- China Protective Case Market Drivers and Challenges
- China Protective Case Price Trends
- China Protective Case Porter's Five Forces
- China Protective Case Industry Life Cycle
- Historical Data and Forecast of China Protective Case Market Revenues & Volume By Type for the Period 2022 - 2032F
- Historical Data and Forecast of China Protective Case Market Revenues & Volume By Hard Cases for the Period 2022 - 2032F
- Historical Data and Forecast of China Protective Case Market Revenues & Volume By Soft Cases for the Period 2022 - 2032F
- Historical Data and Forecast of China Protective Case Market Revenues & Volume By Waterproof Cases for the Period 2022 - 2032F
- Historical Data and Forecast of China Protective Case Market Revenues & Volume By Custom Cases for the Period 2022 - 2032F
- Historical Data and Forecast of China Protective Case Market Revenues & Volume By Material for the Period 2022 - 2032F
- Historical Data and Forecast of China Protective Case Market Revenues & Volume By Plastic for the Period 2022 - 2032F
- Historical Data and Forecast of China Protective Case Market Revenues & Volume By Aluminum for the Period 2022 - 2032F
- Historical Data and Forecast of China Protective Case Market Revenues & Volume By Carbon Fiber for the Period 2022 - 2032F
- Historical Data and Forecast of China Protective Case Market Revenues & Volume By Foam for the Period 2022 - 2032F
- Historical Data and Forecast of China Protective Case Market Revenues & Volume By End-Use for the Period 2022 - 2032F
- Historical Data and Forecast of China Protective Case Market Revenues & Volume By Electronics for the Period 2022 - 2032F
- Historical Data and Forecast of China Protective Case Market Revenues & Volume By Medical Equipment for the Period 2022 - 2032F
- Historical Data and Forecast of China Protective Case Market Revenues & Volume By Photography Gear for the Period 2022 - 2032F
- Historical Data and Forecast of China Protective Case Market Revenues & Volume By Industrial Instruments for the Period 2022 - 2032F
- Historical Data and Forecast of China Protective Case Market Revenues & Volume By Application for the Period 2022 - 2032F
- Historical Data and Forecast of China Protective Case Market Revenues & Volume By Travel Cases for the Period 2022 - 2032F
- Historical Data and Forecast of China Protective Case Market Revenues & Volume By Tool Protection for the Period 2022 - 2032F
- Historical Data and Forecast of China Protective Case Market Revenues & Volume By Military Equipment for the Period 2022 - 2032F
- Historical Data and Forecast of China Protective Case Market Revenues & Volume By Storage Solutions for the Period 2022 - 2032F
- China Protective Case Import Export Trade Statistics
- Market Opportunity Assessment By Type
- Market Opportunity Assessment By Material
- Market Opportunity Assessment By End-Use
- Market Opportunity Assessment By Application
- China Protective Case Top Companies Market Share
- China Protective Case Competitive Benchmarking By Technical and Operational Parameters
- China Protective Case Company Profiles
- China Protective Case Key Strategic Recommendations
Frequently Asked Questions About the Market Study (FAQs):
6Wresearch actively monitors the China Protective Case Market and publishes its comprehensive annual report, highlighting emerging trends, growth drivers, revenue analysis, and forecast outlook. Our insights help businesses to make data-backed strategic decisions with ongoing market dynamics. Our analysts track relevent industries related to the China Protective Case Market, allowing our clients with actionable intelligence and reliable forecasts tailored to emerging regional needs.
Yes, we provide customisation as per your requirements. To learn more, feel free to contact us on sales@6wresearch.com
1 Executive Summary |
2 Introduction |
2.1 Key Highlights of the Report |
2.2 Report Description |
2.3 Market Scope & Segmentation |
2.4 Research Methodology |
2.5 Assumptions |
3 China Protective Case Market Overview |
3.1 China Country Macro Economic Indicators |
3.2 China Protective Case Market Revenues & Volume, 2022 & 2032F |
3.3 China Protective Case Market - Industry Life Cycle |
3.4 China Protective Case Market - Porter's Five Forces |
3.5 China Protective Case Market Revenues & Volume Share, By Type, 2022 & 2032F |
3.6 China Protective Case Market Revenues & Volume Share, By Material, 2022 & 2032F |
3.7 China Protective Case Market Revenues & Volume Share, By End-Use, 2022 & 2032F |
3.8 China Protective Case Market Revenues & Volume Share, By Application, 2022 & 2032F |
4 China Protective Case Market Dynamics |
4.1 Impact Analysis |
4.2 Market Drivers |
4.2.1 Increasing adoption of smartphones and other electronic devices in China leading to a higher demand for protective cases. |
4.2.2 Growing awareness among consumers about the importance of protecting their expensive electronic devices. |
4.2.3 Rising disposable income and changing lifestyle preferences driving the purchase of premium and customized protective cases. |
4.3 Market Restraints |
4.3.1 Intense competition among manufacturers and suppliers leading to price wars and margin pressures. |
4.3.2 Availability of low-cost, counterfeit protective cases in the market affecting the sales of genuine products. |
4.3.3 Rapid changes in device designs and sizes making it challenging for protective case manufacturers to keep up with the latest models. |
5 China Protective Case Market Trends |
6 China Protective Case Market, By Types |
6.1 China Protective Case Market, By Type |
6.1.1 Overview and Analysis |
6.1.2 China Protective Case Market Revenues & Volume, By Type, 2022 - 2032F |
6.1.3 China Protective Case Market Revenues & Volume, By Hard Cases, 2022 - 2032F |
6.1.4 China Protective Case Market Revenues & Volume, By Soft Cases, 2022 - 2032F |
6.1.5 China Protective Case Market Revenues & Volume, By Waterproof Cases, 2022 - 2032F |
6.1.6 China Protective Case Market Revenues & Volume, By Custom Cases, 2022 - 2032F |
6.2 China Protective Case Market, By Material |
6.2.1 Overview and Analysis |
6.2.2 China Protective Case Market Revenues & Volume, By Plastic, 2022 - 2032F |
6.2.3 China Protective Case Market Revenues & Volume, By Aluminum, 2022 - 2032F |
6.2.4 China Protective Case Market Revenues & Volume, By Carbon Fiber, 2022 - 2032F |
6.2.5 China Protective Case Market Revenues & Volume, By Foam, 2022 - 2032F |
6.3 China Protective Case Market, By End-Use |
6.3.1 Overview and Analysis |
6.3.2 China Protective Case Market Revenues & Volume, By Electronics, 2022 - 2032F |
6.3.3 China Protective Case Market Revenues & Volume, By Medical Equipment, 2022 - 2032F |
6.3.4 China Protective Case Market Revenues & Volume, By Photography Gear, 2022 - 2032F |
6.3.5 China Protective Case Market Revenues & Volume, By Industrial Instruments, 2022 - 2032F |
6.4 China Protective Case Market, By Application |
6.4.1 Overview and Analysis |
6.4.2 China Protective Case Market Revenues & Volume, By Travel Cases, 2022 - 2032F |
6.4.3 China Protective Case Market Revenues & Volume, By Tool Protection, 2022 - 2032F |
6.4.4 China Protective Case Market Revenues & Volume, By Military Equipment, 2022 - 2032F |
6.4.5 China Protective Case Market Revenues & Volume, By Storage Solutions, 2022 - 2032F |
7 China Protective Case Market Import-Export Trade Statistics |
7.1 China Protective Case Market Export to Major Countries |
7.2 China Protective Case Market Imports from Major Countries |
8 China Protective Case Market Key Performance Indicators |
8.1 Average selling price (ASP) of protective cases indicating the willingness of consumers to invest in higher-quality products. |
8.2 Customer satisfaction levels reflecting the perceived value and effectiveness of protective cases in the market. |
8.3 Number of new product launches and innovations showcasing the industry's ability to cater to changing consumer preferences and technological advancements. |
8.4 Social media engagement and brand sentiment to gauge the market perception and brand loyalty towards protective case manufacturers. |
8.5 Market penetration rate in different consumer segments highlighting the growth potential and expansion opportunities for protective case brands. |
9 China Protective Case Market - Opportunity Assessment |
9.1 China Protective Case Market Opportunity Assessment, By Type, 2022 & 2032F |
9.2 China Protective Case Market Opportunity Assessment, By Material, 2022 & 2032F |
9.3 China Protective Case Market Opportunity Assessment, By End-Use, 2022 & 2032F |
9.4 China Protective Case Market Opportunity Assessment, By Application, 2022 & 2032F |
10 China Protective Case Market - Competitive Landscape |
10.1 China Protective Case Market Revenue Share, By Companies, 2025 |
10.2 China Protective Case Market Competitive Benchmarking, By Operating and Technical Parameters |
11 Company Profiles |
12 Recommendations |
13 Disclaimer |
Export potential assessment - trade Analytics for 2030
Export potential enables firms to identify high-growth global markets with greater confidence by combining advanced trade intelligence with a structured quantitative methodology. The framework analyzes emerging demand trends and country-level import patterns while integrating macroeconomic and trade datasets such as GDP and population forecasts, bilateral import–export flows, tariff structures, elasticity differentials between developed and developing economies, geographic distance, and import demand projections. Using weighted trade values from 2020–2024 as the base period to project country-to-country export potential for 2030, these inputs are operationalized through calculated drivers such as gravity model parameters, tariff impact factors, and projected GDP per-capita growth. Through an analysis of hidden potentials, demand hotspots, and market conditions that are most favorable to success, this method enables firms to focus on target countries, maximize returns, and global expansion with data, backed by accuracy.
By factoring in the projected importer demand gap that is currently unmet and could be potential opportunity, it identifies the potential for the Exporter (Country) among 190 countries, against the general trade analysis, which identifies the biggest importer or exporter.
To discover high-growth global markets and optimize your business strategy:
Click Here
Pricing
- Single User License$ 1,995
- Department License$ 2,400
- Site License$ 3,120
- Global License$ 3,795

Search
Thought Leadership and Analyst Meet


Our Clients
Latest Reports
- Philippines Polyhydroxybutyrate-co-Hydroxyvalerate Market (2026-2032) | Trends, Insights, Challenges, Restraints, Competition, Size, Value, Forecast, Pricing, Share, Outlook, Revenue, Investment Opportunities, Strategy, Drivers, Demand, Growth, segmentation, Analysis, Companies
- Peru Polyhydroxybutyrate-co-Hydroxyvalerate Market (2026-2032) | Growth, Demand, Challenges, Share, Trends, Analysis, Pricing, Investment Opportunities, Drivers, Value, Forecast, Competition, Size, Companies, Insights, Outlook, Restraints, segmentation, Revenue, Strategy
- Pakistan Polyhydroxybutyrate-co-Hydroxyvalerate Market (2026-2032) | Restraints, segmentation, Pricing, Forecast, Share, Strategy, Competition, Trends, Insights, Drivers, Challenges, Growth, Revenue, Outlook, Value, Investment Opportunities, Companies, Size, Analysis, Demand
- Oman Polyhydroxybutyrate-co-Hydroxyvalerate Market (2026-2032) | Drivers, segmentation, Insights, Competition, Pricing, Outlook, Size, Revenue, Challenges, Forecast, Analysis, Growth, Value, Share, Trends, Investment Opportunities, Strategy, Restraints, Companies, Demand
- Nigeria Polyhydroxybutyrate-co-Hydroxyvalerate Market (2026-2032) | Value, Investment Opportunities, Analysis, Revenue, Restraints, Pricing, Outlook, Competition, Demand, Growth, Forecast, Companies, Trends, Challenges, segmentation, Drivers, Insights, Share, Size, Strategy
- Nepal Polyhydroxybutyrate-co-Hydroxyvalerate Market (2026-2032) | Insights, Analysis, Drivers, Share, Revenue, Demand, segmentation, Investment Opportunities, Competition, Forecast, Growth, Pricing, Companies, Strategy, Trends, Restraints, Challenges, Outlook, Size, Value
- Myanmar Polyhydroxybutyrate-co-Hydroxyvalerate Market (2026-2032) | Outlook, Revenue, Strategy, Restraints, Drivers, segmentation, Share, Forecast, Competition, Insights, Growth, Pricing, Size, Demand, Value, Companies, Trends, Challenges, Investment Opportunities, Analysis
- Morocco Polyhydroxybutyrate-co-Hydroxyvalerate Market (2026-2032) | Outlook, Investment Opportunities, Restraints, Strategy, Forecast, Challenges, Drivers, Growth, Companies, segmentation, Trends, Size, Competition, Revenue, Demand, Insights, Share, Analysis, Value, Pricing
- Mexico Polyhydroxybutyrate-co-Hydroxyvalerate Market (2026-2032) | Size, Drivers, Outlook, Share, Strategy, Growth, Pricing, Challenges, Companies, Demand, Value, Investment Opportunities, Restraints, Trends, Forecast, segmentation, Analysis, Insights, Competition, Revenue
- Malaysia Polyhydroxybutyrate-co-Hydroxyvalerate Market (2026-2032) | Share, segmentation, Size, Companies, Analysis, Insights, Forecast, Value, Revenue, Drivers, Restraints, Challenges, Investment Opportunities, Trends, Competition, Strategy, Demand, Growth, Outlook, Pricing
Industry Events and Analyst Meet

HIMTEX 2026

India Refining Summit 2026

India EV Show 2026

EV tech India Expo 2026

Auto Tech Asia 2026
Whitepaper
- Middle East & Africa Commercial Security Market Click here to view more.
- Middle East & Africa Fire Safety Systems & Equipment Market Click here to view more.
- GCC Drone Market Click here to view more.
- Middle East Lighting Fixture Market Click here to view more.
- GCC Physical & Perimeter Security Market Click here to view more.
6WResearch In News
- Doha a strategic location for EV manufacturing hub: IPA Qatar
- Demand for luxury TVs surging in the GCC, says Samsung
- Empowering Growth: The Thriving Journey of Bangladesh’s Cable Industry
- Demand for luxury TVs surging in the GCC, says Samsung
- Video call with a traditional healer? Once unthinkable, it’s now common in South Africa
- Intelligent Buildings To Smooth GCC’s Path To Net Zero