China Tables Market (2026-2032) | Trends, Analysis, Revenue, Size, Industry, Value, Growth, Outlook, Forecast, Share & Companies
Market Forecast By Types (Fabric, Leather, Metal, Wooden, Others), By Applications (Family, Office, Others) And Competitive Landscape
| Product Code: ETC034661 | Publication Date: Oct 2020 | Updated Date: Jun 2026 | Product Type: Report | |
| Publisher: 6Wresearch | Author: Dhaval Chaurasia | No. of Pages: 70 | No. of Figures: 35 | No. of Tables: 5 |
China Tables Market Summary
The china tables market was estimated at USD 248 Million in 2025 and is projected to reach USD 286 Million by 2032, growing at a CAGR of 4.2% from 2026 to 2032.
China Tables Market Growth Rate Analysis (2021-2032)
The China tables market has shown notable fluctuations over the past few years, with a sharp decline of 3.8% in 2021, largely due to pandemic-related disruptions and supply chain challenges. However, a rebound was witnessed in 2022 with a growth of 6.2%, driven by surging consumer demand as the economy reopened. Despite a slight contraction of 1.7% in 2023, the sector is positioned for recovery, anticipating a growth of 4% in 2024, supported by increased investments in residential and commercial infrastructure. Additionally, the trend towards digitalization and sustainable practices will further bolster demand, sustaining growth rates of around 2.5% to 3.3% through 2032.
China Tables Market Year-wise Growth Rate and Key Drivers
This graph highlights how the China Tables Market has steadily grown over the past five years, supported by major growth factors.
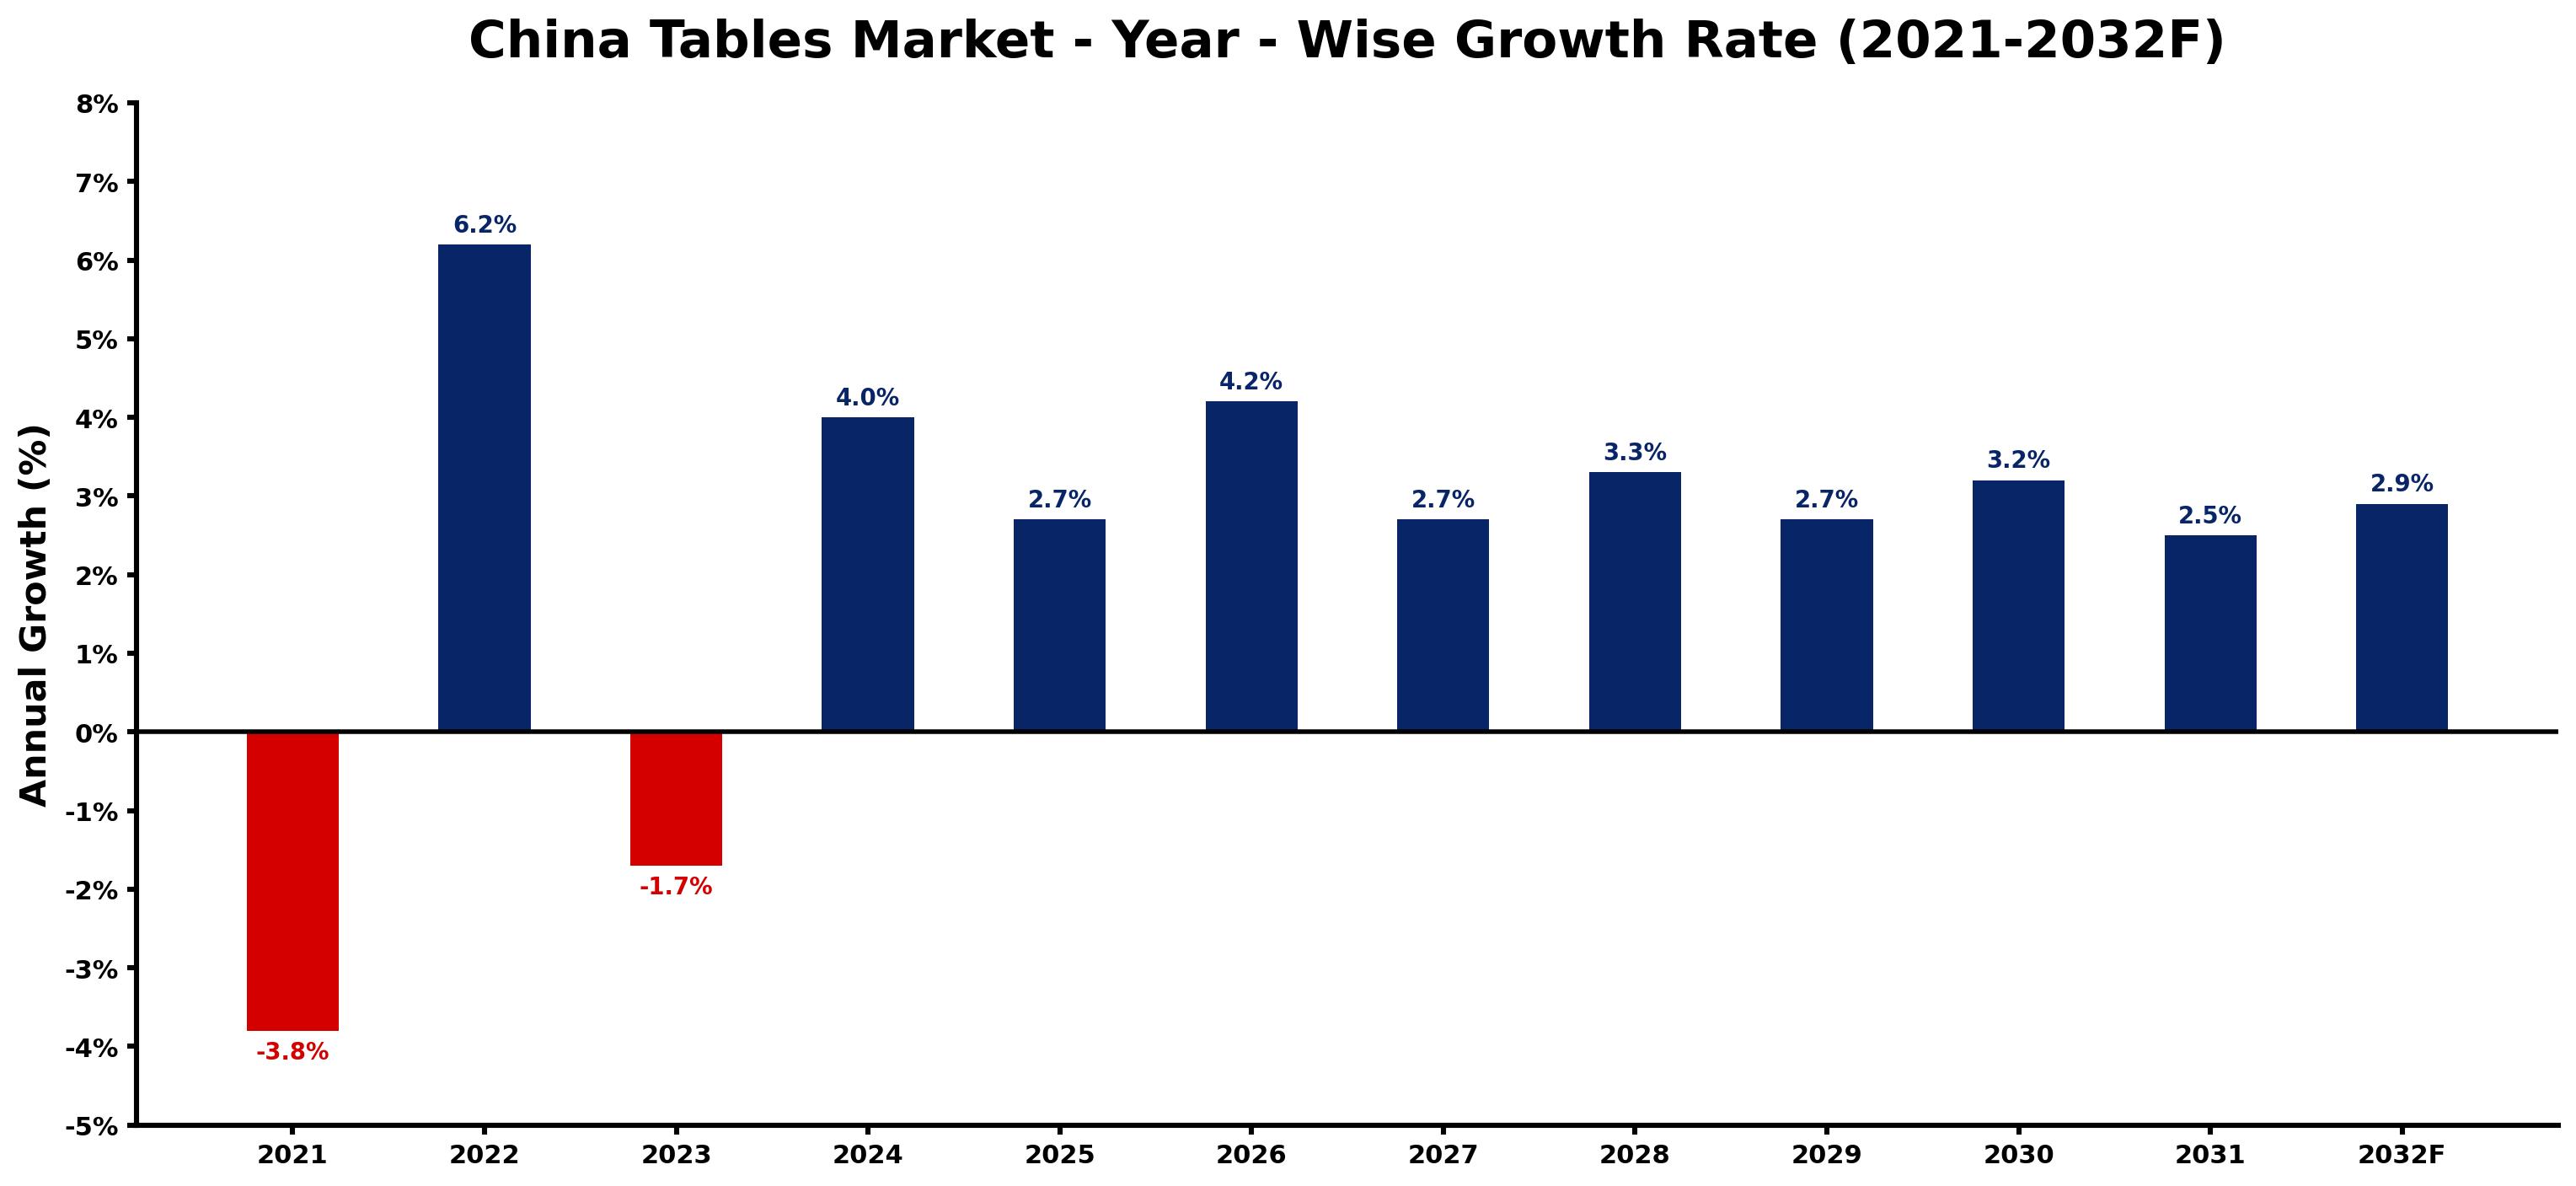
The table below presents the year wise growth rates along with the key drivers influencing the market
| Year | Growth Rate | Major Drivers |
| 2021 | -3.8% | Intensified competition from affordable alternatives led to decreased sales in the China tables market. |
| 2022 | 6.2% | Sustainable materials gain traction, appealing to environmentally conscious Chinese consumers. |
| 2023 | -1.7% | Geopolitical tensions led to reduced imports and exports, hampering market expansion for furniture manufacturers. |
| 2024 | 4.0% | Online retail platforms expand, enhancing accessibility for a wider range of consumers. |
| 2025 | 2.7% | Growing disposable incomes allow consumers to invest in premium table options. |
| 2026 | 4.2% | Lifestyle shifts prioritize home entertainment, boosting sales of dining and coffee tables. |
| 2027 | 2.7% | Technological integration introduces smart furniture features, appealing to tech-savvy buyers. |
| 2028 | 3.3% | Increased focus on home office setups drives demand for versatile working surfaces. |
| 2029 | 2.7% | International design influences inspire unique trends that captivate younger generations. |
| 2030 | 3.2% | Rural-urban migration changes family structures, influencing table size and style preferences. |
| 2031 | 2.5% | Economic recovery post-pandemic fuels home renovation projects, stimulating furniture purchases. |
| 2032 | 2.9% | Emerging market segments, like millennials, prioritize customization and personalization options. |
Note - Market size estimations and growth projections presented in this report are based on 6Wresearch's advanced forecasting approach, validated with industry datasets as of June 2026.
China Tables Market Synopsis
The China Tables Market is projected to reach 4.2% and witness significant growth during the forecast period (2026-2032). The market is underpinned by the rapid economic development of China, which has led to evolving consumer preferences alongside increasing disposable incomes. Various table products, such as dining tables, coffee tables, office desks, and outdoor tables, are experiencing heightened demand, reflecting the diverse requirements of Chinese consumers.
China Tables Market Growth Drivers
Key factors driving the expansion of the China tables market include urbanization, changing lifestyles, and advancing technology. As more individuals migrate to urban settings, space-efficient and multifunctional tables have become increasingly crucial.
- Growing urbanization results in smaller living and working spaces, necessitating the design of more compact and functional table options.
- Consumers are increasingly prioritizing multifunctional furniture that can serve dual purposes, such as dining and work surfaces, leading to innovations in design.
- Technological advances in materials and production methods encourage the use of sustainable, eco-friendly materials, aligning with the rising consumer demand for environmentally conscious products.
- The increasing influence of e-commerce provides consumers with greater access to a wider array of table options, making it easier to compare prices and designs.
- Shifts in consumer preferences towards modern and minimalist aesthetics drive an increase in demand for tables constructed with contemporary materials like metal, glass, and acrylic.
China Tables Market Trends and Opportunities
The China tables market is witnessing a strong inclination towards innovative designs and functionality. As consumer preferences evolve, the demand for contemporary and stylish furniture continues to rise.
- There is a notable trend towards sustainable practices, with consumers favoring tables made from responsibly sourced materials that minimize environmental impact.
- Design innovations, such as expandable and adjustable tables, are gaining traction as they cater to diverse functional needs.
- Customization options are becoming increasingly popular, allowing consumers to select finishes, sizes, and designs that suit their personal preferences.
- The growth of the online retail space facilitates the introduction of niche and bespoke furniture offerings that appeal to specific market segments.
- Urban consumers are increasingly interested in unique, culturally inspired designs that reflect local heritage and trends, presenting opportunities for local artisans and designers.
China Tables Market Challenges and Restraints
Despite the growth opportunities, the China tables market faces several challenges that could hinder its development. Competition among domestic and international manufacturers remains fierce.
- Price competition is intensifying due to the fragmented nature of the market, with numerous players offering varying quality and price ranges.
- Fluctuations in raw material costs can significantly impact production, affecting profit margins for manufacturers.
- Increased labor costs combined with stringent environmental regulations are complicating the operational landscape for manufacturers.
- Shifting consumer preferences may leave companies that fail to innovate in design and functionality at a competitive disadvantage.
- The rise of e-commerce consumption necessitates a strategic approach to online marketing and customer engagement, requiring investments in digital infrastructure.
China Tables Market Government Investment and Initiatives
The role of government policy in the China tables market is significant, with various initiatives aimed at promoting sustainability and consumer safety. The government has implemented quality standards mandating safety regulations for table products.
- Policies encouraging the use of eco-friendly materials in furniture manufacturing reflect the government's commitment to environmental protection.
- Initiatives aimed at improving product labeling enhance transparency, allowing consumers to make informed purchasing decisions.
- The government has been investing in domestic production capabilities, seeking to strengthen local manufacturers and ensure fair competition.
- Support for research and development in furniture design may assist in driving innovation within the industry, fostering a more competitive market.
- Regulations promoting sustainable manufacturing practices are increasingly influencing production strategies, encouraging companies to adopt greener methods.
China Tables Market Latest Developments (May 2025 - June 2026)
Recent developments in the China tables market reflect an ongoing commitment to innovation and sustainability. Industry players have been rapidly adapting their product offerings to meet the evolving needs of consumers.
- Several manufacturers have started launching multifunctional tables that incorporate storage solutions, appealing to urban consumers who prioritize space efficiency.
- Collaborations with designers to create limited-edition collections have become a noteworthy trend, highlighting the cultural significance of furniture in contemporary Chinese lifestyles.
- There has been an increase in promotional campaigns targeting online platforms, enabling brands to reach broader audiences and enhance direct-to-consumer sales.
- Investments in sustainable production techniques are gaining momentum, with companies actively sourcing recyclable materials to appeal to eco-conscious shoppers.
- The trend towards customization has led to more brands offering consumer options for personalization, empowering shoppers to design tables that fit their unique spaces.
China Tables Market - Key Attractiveness of the Report
- 10 Years of Market Numbers
- Historical Data Starting from 2022 to 2025
- Base Year: 2025
- Forecast Data until 2032
- Key Performance Indicators Impacting the Market
- Major Upcoming Developments and Projects
Key Highlights of the Report:
- China Tables Market Outlook
- Market Size of China Tables Market, 2025
- Forecast of China Tables Market, 2032F
- Historical Data and Forecast of China Tables Revenues & Volume for the Period 2022-2032F
- China Tables Market Trend Evolution
- China Tables Market Drivers and Challenges
- China Tables Price Trends
- China Tables Porter's Five Forces
- China Tables Industry Life Cycle
- Historical Data and Forecast of China Tables Market Revenues & Volume By Types for the Period 2022-2032F
- Historical Data and Forecast of China Tables Market Revenues & Volume By Fabric for the Period 2022-2032F
- Historical Data and Forecast of China Tables Market Revenues & Volume By Leather for the Period 2022-2032F
- Historical Data and Forecast of China Tables Market Revenues & Volume By Metal for the Period 2022-2032F
- Historical Data and Forecast of China Tables Market Revenues & Volume By Wooden for the Period 2022-2032F
- Historical Data and Forecast of China Tables Market Revenues & Volume By Others for the Period 2022-2032F
- Historical Data and Forecast of China Tables Market Revenues & Volume By Applications for the Period 2022-2032F
- Historical Data and Forecast of China Tables Market Revenues & Volume By Family for the Period 2022-2032F
- Historical Data and Forecast of China Tables Market Revenues & Volume By Office for the Period 2022-2032F
- Historical Data and Forecast of China Tables Market Revenues & Volume By Others for the Period 2022-2032F
- China Tables Import Export Trade Statistics
- Market Opportunity Assessment By Types
- Market Opportunity Assessment By Applications
- China Tables Top Companies Market Share
- China Tables Competitive Benchmarking By Technical and Operational Parameters
- China Tables Company Profiles
- China Tables Key Strategic Recommendations
Frequently Asked Questions About the Market Study (FAQs):
The main drivers include urbanization, rising disposable incomes, and the increasing demand for multifunctional and sustainable furniture options.
Consumers are increasingly favoring multifunctional designs, eco-friendly materials, and aesthetically modern styles, reflecting a shift towards innovative and sustainable products.
Manufacturers contend with intense competition, fluctuating raw material prices, and the need to adapt to changing consumer preferences while managing production costs.
Government policies promote sustainability, consumer safety, and support for domestic production, which significantly influences manufacturing practices and market dynamics.
6Wresearch actively monitors the China Tables Market and publishes its comprehensive annual report, highlighting emerging trends, growth drivers, revenue analysis, and forecast outlook. Our insights help businesses to make data-backed strategic decisions with ongoing market dynamics. Our analysts track relevent industries related to the China Tables Market, allowing our clients with actionable intelligence and reliable forecasts tailored to emerging regional needs.
Yes, we provide customisation as per your requirements. To learn more, feel free to contact us on sales@6wresearch.com
1 Executive Summary |
2 Introduction |
2.1 Key Highlights of the Report |
2.2 Report Description |
2.3 Market Scope & Segmentation |
2.4 Research Methodology |
2.5 Assumptions |
3 China Tables Market Overview |
3.1 China Country Macro Economic Indicators |
3.2 China Tables Market Revenues & Volume, 2022 & 2032F |
3.3 China Tables Market - Industry Life Cycle |
3.4 China Tables Market - Porter's Five Forces |
3.5 China Tables Market Revenues & Volume Share, By Types, 2022 & 2032F |
3.6 China Tables Market Revenues & Volume Share, By Applications, 2022 & 2032F |
4 China Tables Market Dynamics |
4.1 Impact Analysis |
4.2 Market Drivers |
4.2.1 Increasing urbanization and population growth leading to higher demand for furniture, including tables. |
4.2.2 Growing disposable income and changing lifestyle preferences driving demand for modern and aesthetically pleasing tables. |
4.2.3 Rising trend of home renovation and interior decoration projects boosting the market for tables in China. |
4.3 Market Restraints |
4.3.1 Fluctuations in raw material prices impacting production costs and pricing of tables. |
4.3.2 Intense competition among market players leading to pricing pressures and margin erosion. |
4.3.3 Regulatory challenges and compliance requirements affecting the manufacturing and distribution of tables in China. |
5 China Tables Market Trends |
6 China Tables Market, By Types |
6.1 China Tables Market, By Types |
6.1.1 Overview and Analysis |
6.1.2 China Tables Market Revenues & Volume, By Types, 2022-2032F |
6.1.3 China Tables Market Revenues & Volume, By Fabric, 2022-2032F |
6.1.4 China Tables Market Revenues & Volume, By Leather, 2022-2032F |
6.1.5 China Tables Market Revenues & Volume, By Metal, 2022-2032F |
6.1.6 China Tables Market Revenues & Volume, By Wooden, 2022-2032F |
6.1.7 China Tables Market Revenues & Volume, By Others, 2022-2032F |
6.2 China Tables Market, By Applications |
6.2.1 Overview and Analysis |
6.2.2 China Tables Market Revenues & Volume, By Family, 2022-2032F |
6.2.3 China Tables Market Revenues & Volume, By Office, 2022-2032F |
6.2.4 China Tables Market Revenues & Volume, By Others, 2022-2032F |
7 China Tables Market Import-Export Trade Statistics |
7.1 China Tables Market Export to Major Countries |
7.2 China Tables Market Imports from Major Countries |
8 China Tables Market Key Performance Indicators |
8.1 Average selling price (ASP) of tables in the market. |
8.2 Consumer sentiment and spending on home furnishings. |
8.3 Adoption rate of e-commerce platforms for purchasing tables. |
8.4 Number of new product launches and innovations in the tables market. |
8.5 Average time taken to launch a new table design from concept to market availability. |
9 China Tables Market - Opportunity Assessment |
9.1 China Tables Market Opportunity Assessment, By Types, 2022 & 2032F |
9.2 China Tables Market Opportunity Assessment, By Applications, 2022 & 2032F |
10 China Tables Market - Competitive Landscape |
10.1 China Tables Market Revenue Share, By Companies, 2025 |
10.2 China Tables Market Competitive Benchmarking, By Operating and Technical Parameters |
11 Company Profiles |
12 Recommendations |
13 Disclaimer |
Global Go To Market Strategy - 2030
Export potential enables firms to identify high-growth global markets with greater confidence by combining advanced trade intelligence with a structured quantitative methodology. The framework analyzes emerging demand trends and country-level import patterns while integrating macroeconomic and trade datasets such as GDP and population forecasts, bilateral import–export flows, tariff structures, elasticity differentials between developed and developing economies, geographic distance, and import demand projections. Using weighted trade values from 2020–2024 as the base period to project country-to-country export potential for 2030, these inputs are operationalized through calculated drivers such as gravity model parameters, tariff impact factors, and projected GDP per-capita growth. Through an analysis of hidden potentials, demand hotspots, and market conditions that are most favorable to success, this method enables firms to focus on target countries, maximize returns, and global expansion with data, backed by accuracy.
By factoring in the projected importer demand gap that is currently unmet and could be potential opportunity, it identifies the potential for the Exporter (Country) among 190 countries, against the general trade analysis, which identifies the biggest importer or exporter.
To discover high-growth global markets and optimize your business strategy:
Click Here
Pricing
- Single User License$ 1,995
- Department License$ 2,400
- Site License$ 3,120
- Global License$ 3,795

Leadership Perspectives from Industry Events
Search
Thought Leadership and Analyst Meet


Our Clients
6WResearch In News
- India Air Conditioner Market Set for Strong Rebound in 2026 After Weather-Led Correction and GST-Driven Recovery: 6Wresearch
- ADAS in India: How Automatic Emergency Braking, Blind Spot Detection & Driver Monitoring are Transforming Road Safety
- Doha a strategic location for EV manufacturing hub: IPA Qatar
- Demand for luxury TVs surging in the GCC, says Samsung
- Empowering Growth: The Thriving Journey of Bangladesh’s Cable Industry
- Demand for luxury TVs surging in the GCC, says Samsung
Latest Reports
- Poland Fire Protection Systems Market (2026-2032)
- Cape Verde Portable Hand-Thrown Extinguisher Market (2026-2032)
- Canada Portable Hand-Thrown Extinguisher Market (2026-2032)
- Cameroon Portable Hand-Thrown Extinguisher Market (2026-2032)
- Burundi Portable Hand-Thrown Extinguisher Market (2026-2032)
- Burkina Faso Portable Hand-Thrown Extinguisher Market (2026-2032)
- Bulgaria Portable Hand-Thrown Extinguisher Market (2026-2032)
- Brunei Portable Hand-Thrown Extinguisher Market (2026-2032)
- Botswana Portable Hand-Thrown Extinguisher Market (2026-2032)
- Bosnia and Herzegovina Portable Hand-Thrown Extinguisher Market (2026-2032)
Industry Events and Analyst Meet

HIMTEX 2026

India Refining Summit 2026

India EV Show 2026

EV tech India Expo 2026

Auto Tech Asia 2026
Whitepaper
- Middle East & Africa Commercial Security Market Click here to view more.
- Middle East & Africa Fire Safety Systems & Equipment Market Click here to view more.
- GCC Drone Market Click here to view more.
- Middle East Lighting Fixture Market Click here to view more.
- GCC Physical & Perimeter Security Market Click here to view more.