Croatia Absorbable Fibrin Sealant Patch Market (2026-2032) | Forecast, Consumer Insights, Growth, Value, Strategic Insights, Restraints, Segmentation, Competition, Supply, Segments, Drivers, Investment Trends, Trends, Size, Opportunities, Demand, Outlook, Strategy, Pricing Analysis, Competitive, Companies, Analysis, Share, Industry, Revenue, Challenges
Market Forecast By Patch Type (Liquid Patch, Sheet Patch, Spray Patch, Custom Formulations), By Application (Surgical Hemostasis, Wound Closure, Trauma & Emergency Care, Specialty Surgeries), By End User (Hospitals, Clinics, Emergency Rooms, Research Institutes) And Competitive Landscape
| Product Code: ETC11702741 | Publication Date: Apr 2025 | Updated Date: Apr 2026 | Product Type: Market Research Report | |
| Publisher: 6Wresearch | Author: Sachin Kumar Rai | No. of Pages: 65 | No. of Figures: 34 | No. of Tables: 19 |
Croatia Absorbable Fibrin Sealant Patch Market Size (2020-2030)
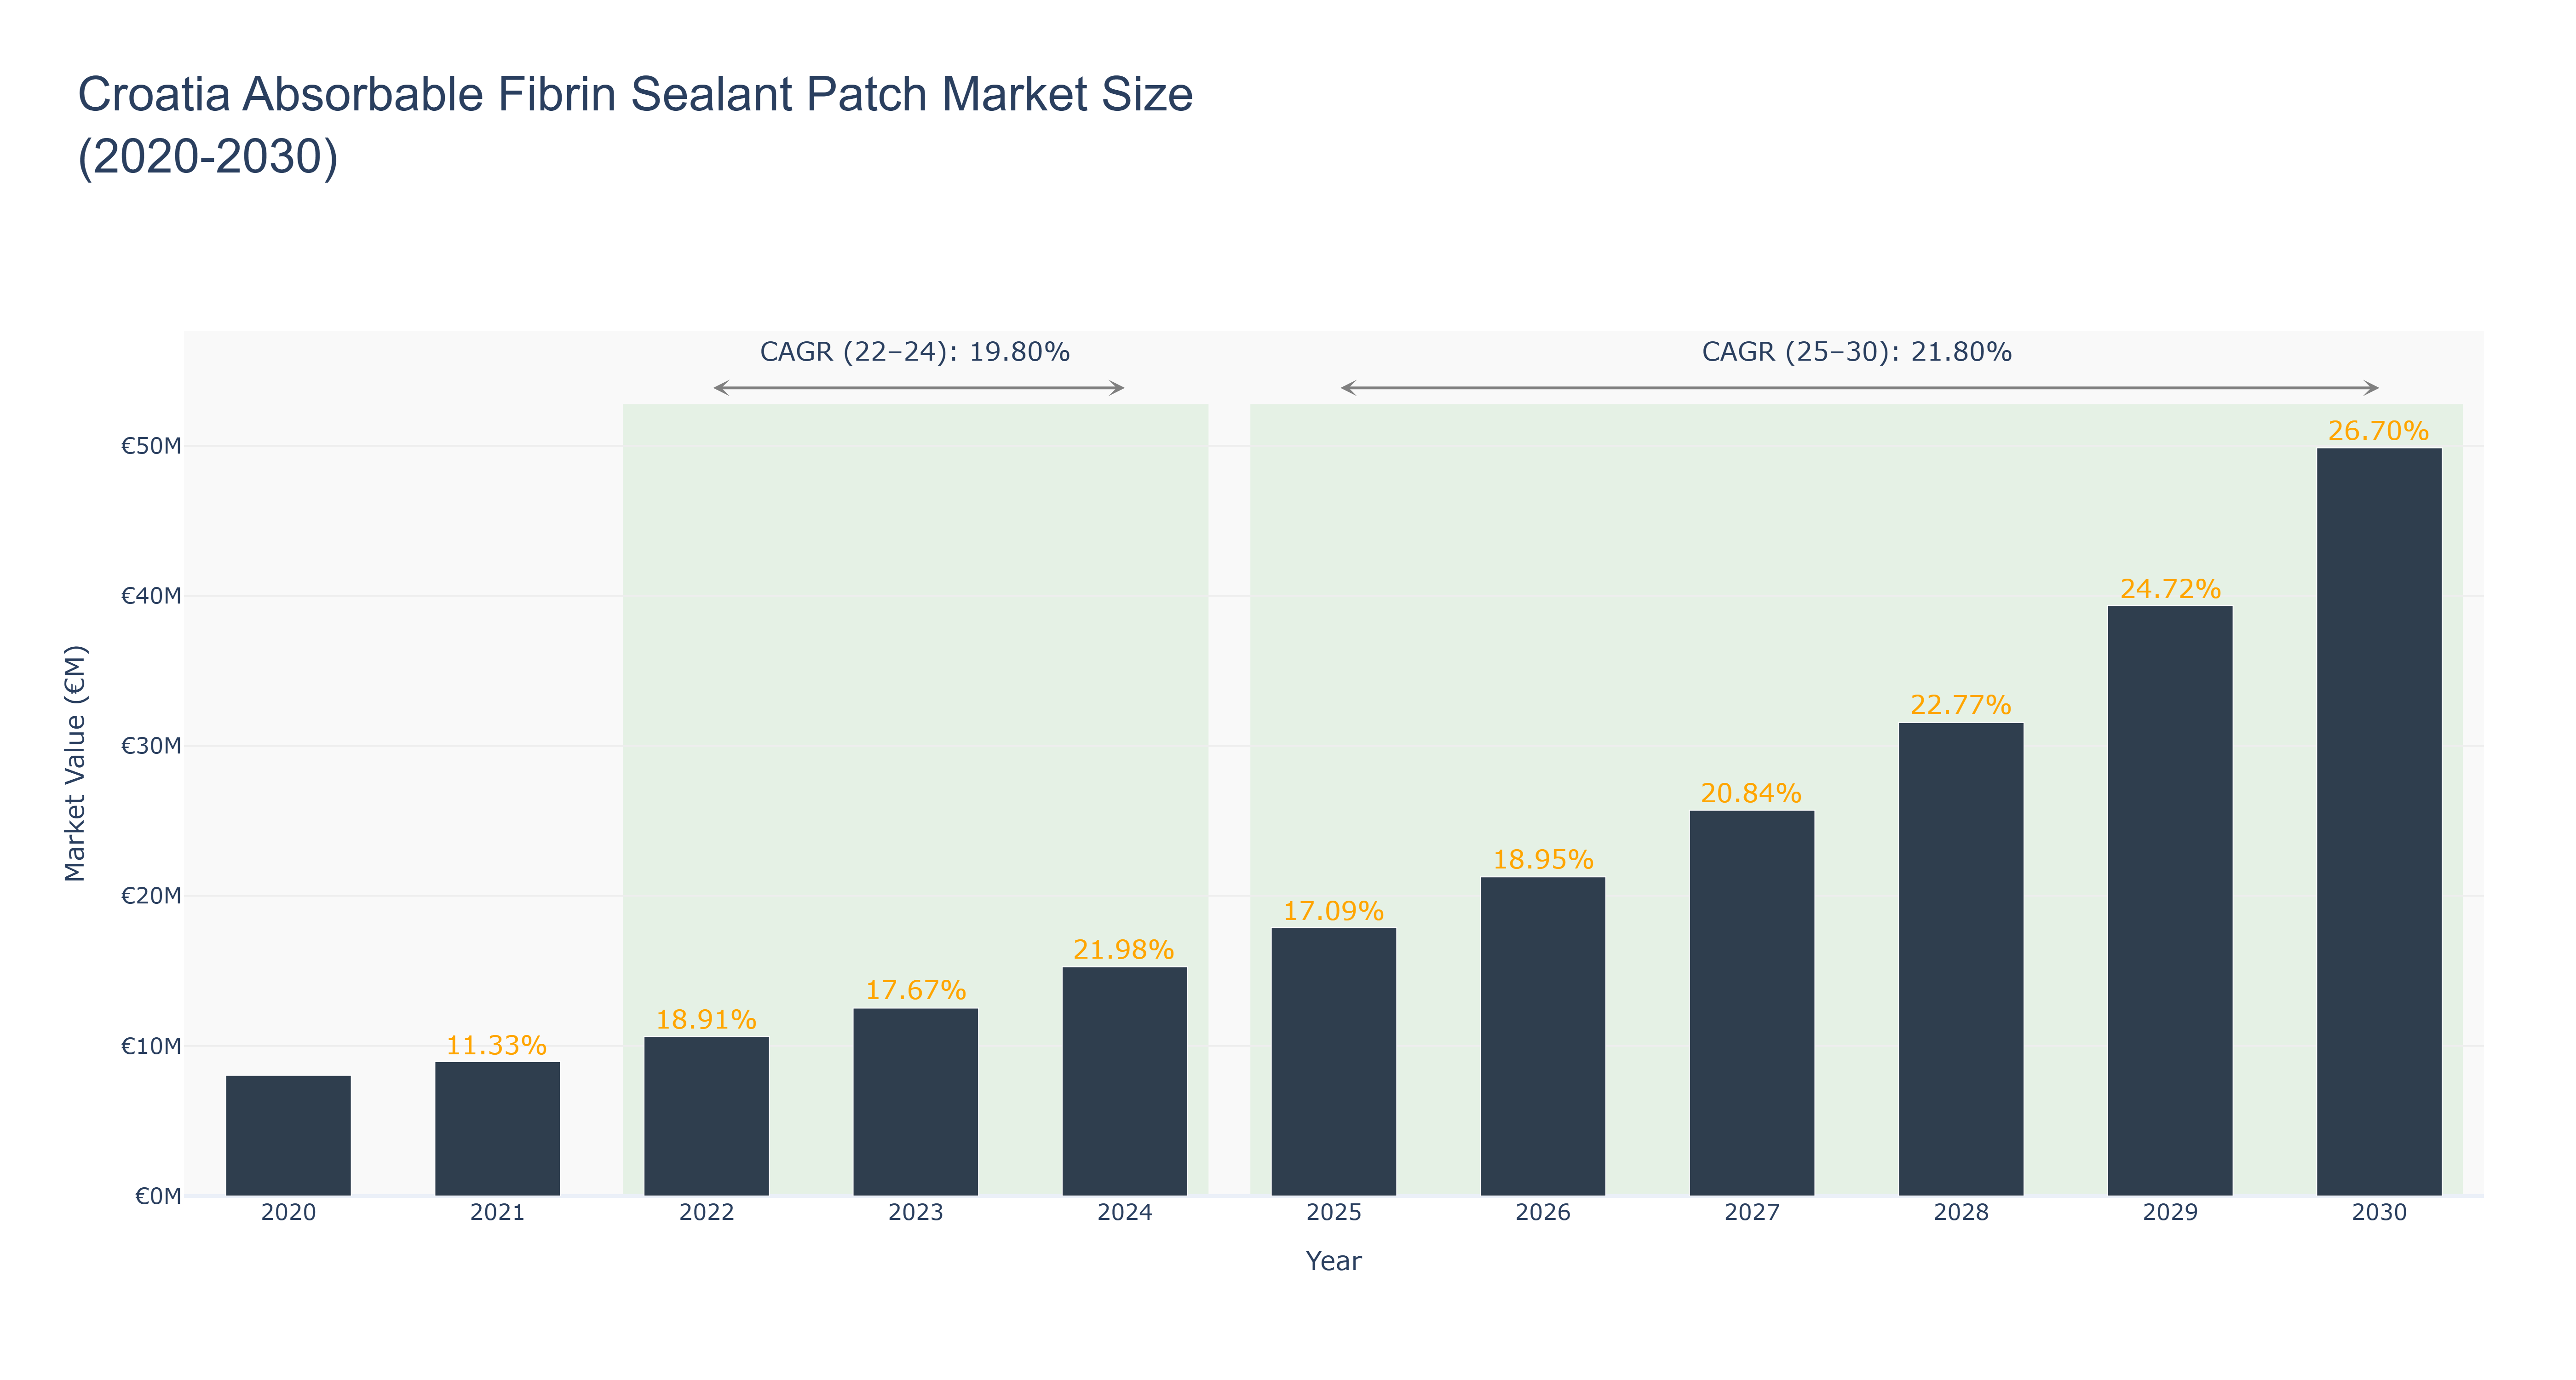
The Croatia Absorbable Fibrin Sealant Patch Market has shown a steady growth trajectory, with a peak market size of €49.86 million in 2030. The market experienced gradual expansion from €8.04 million in 2020 to €15.27 million in 2024, driven by increasing demand for innovative medical solutions. Subsequently, the market is forecasted to continue its upward trend, reaching €49.86 million by 2030, with a CAGR of 21.80% from 2025 to 2030. The notable CAGR of 19.80% from 2022 to 2024 reflects strong market potential and favorable market conditions. Industry drivers such as technological advancements in healthcare and rising awareness about the benefits of fibrin sealant patches are propelling market growth. Looking ahead, upcoming projects in Croatia's healthcare sector, focusing on enhancing surgical procedures, are expected to further boost the market's expansion and solidify its position in the region.
Croatia Absorbable Fibrin Sealant Patch Market: Production & Trade Performance (2019-2025)
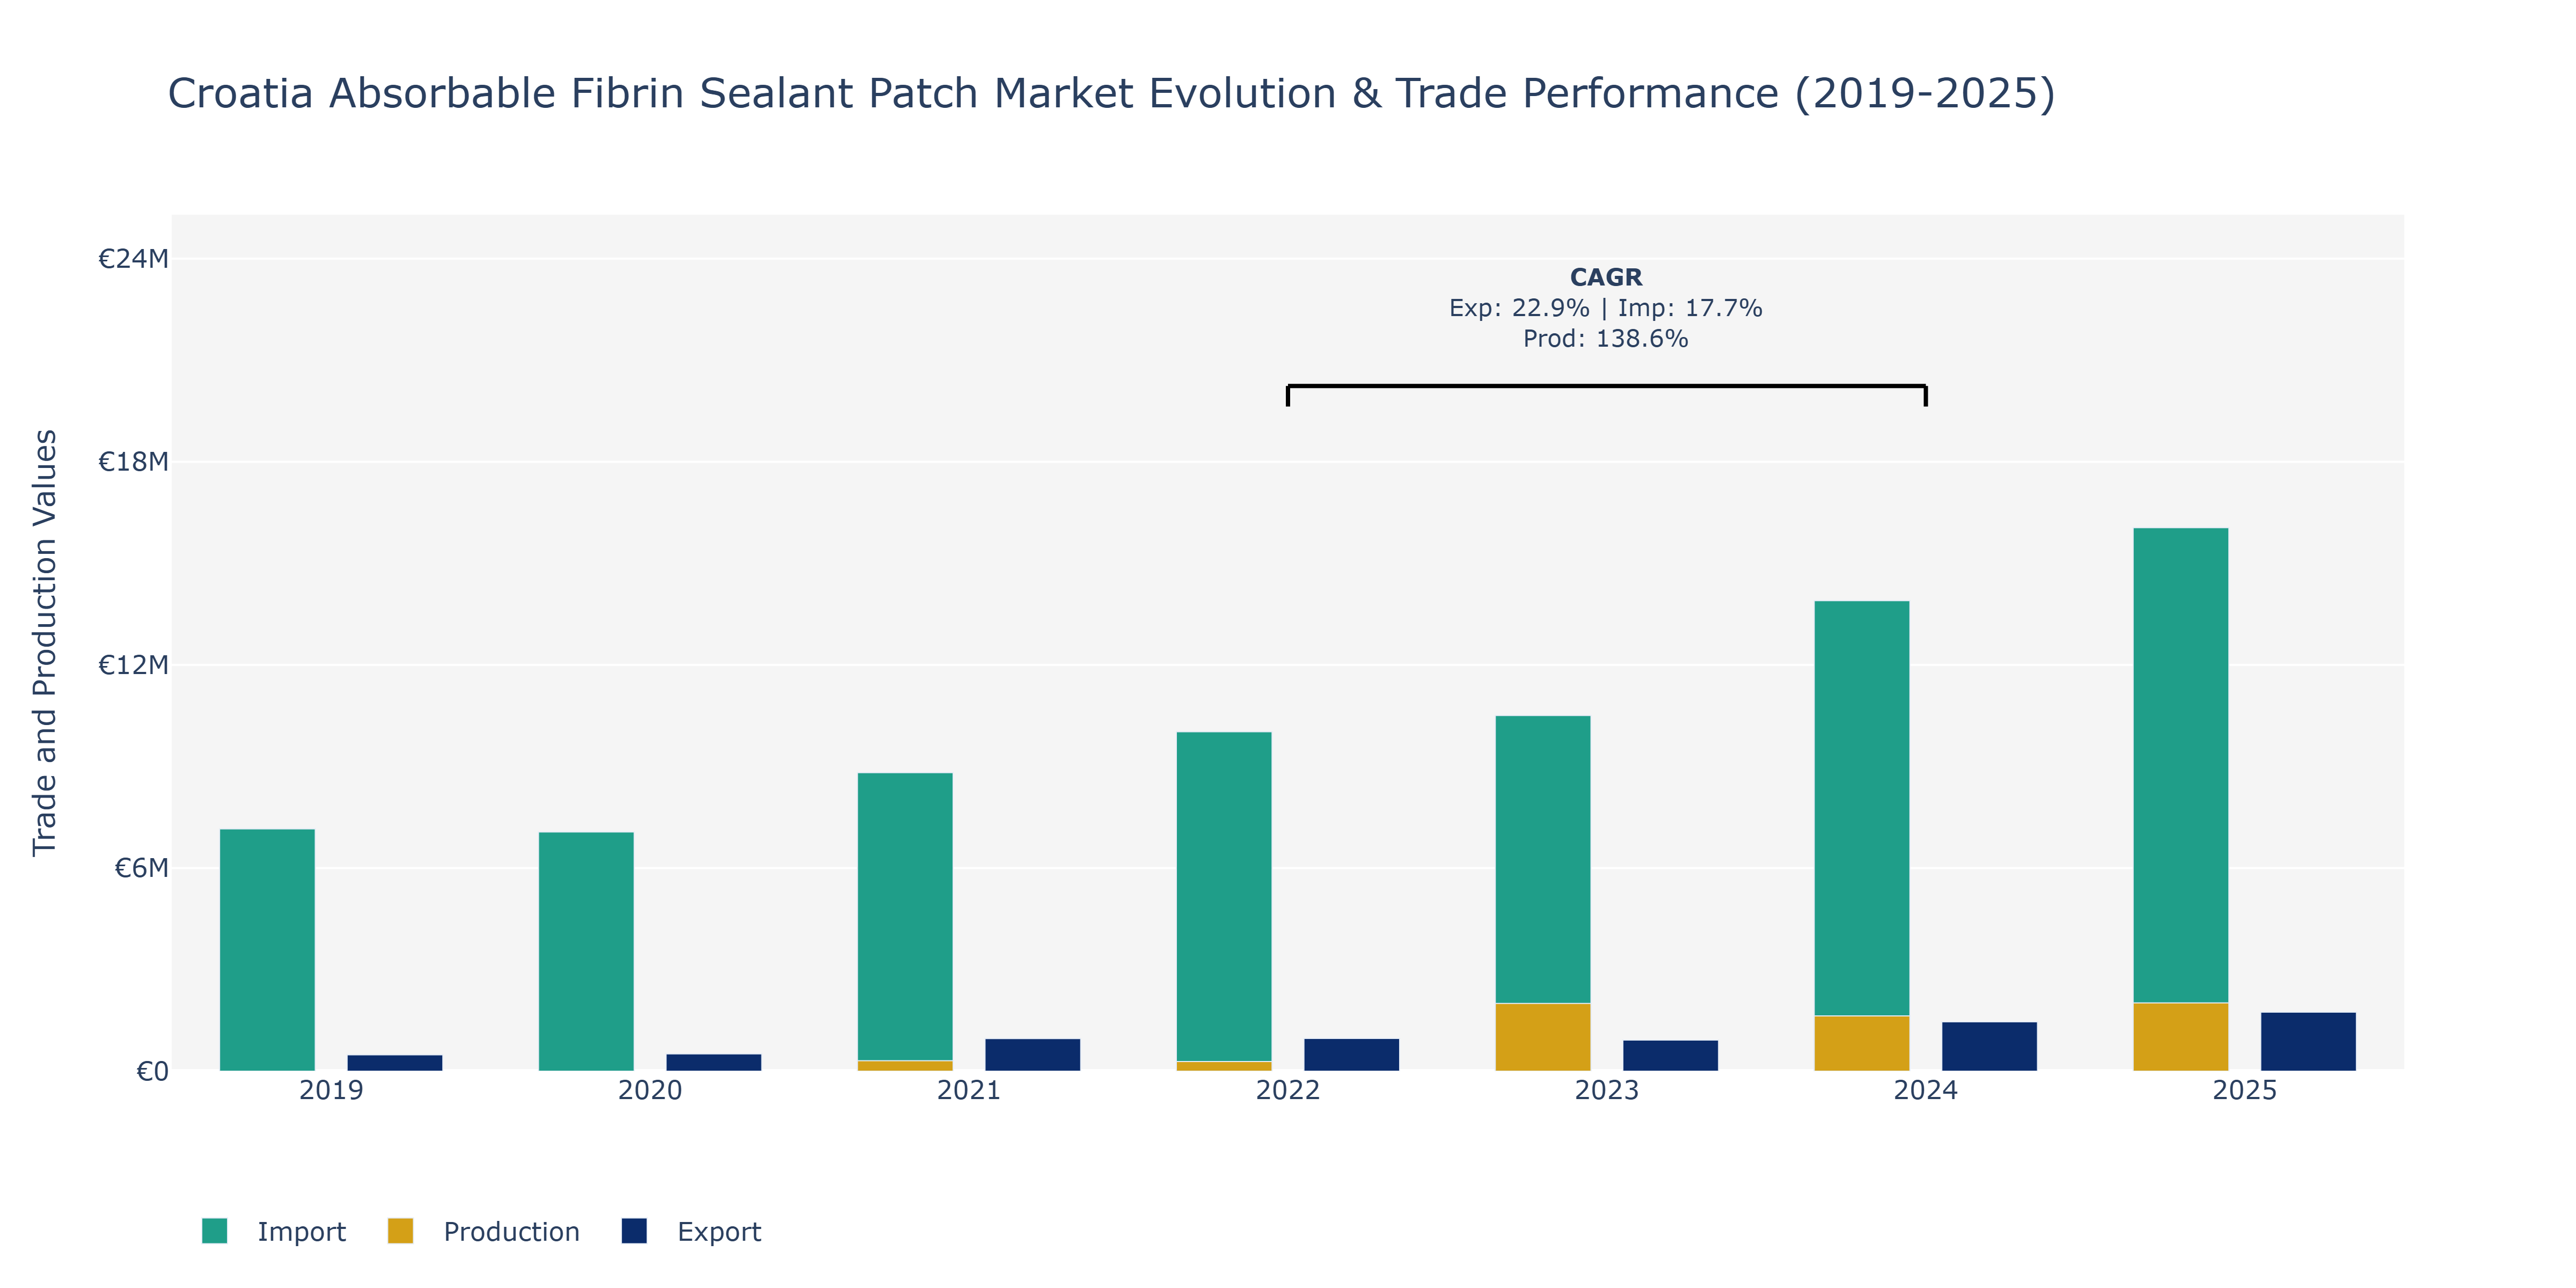
In the Croatia Absorbable Fibrin Sealant Patch Market, from 2019 to 2025, Exports saw a steady rise, reaching €1.74 million by 2025. This growth can be attributed to increased international demand for innovative medical products and Croatia's focus on expanding its export markets. Imports also surged consistently, hitting €16.05 million in 2025, reflecting the market's reliance on imported raw materials and technology. Production, on the other hand, displayed remarkable growth, soaring to €2.02 million in 2025. The substantial increase in production is likely linked to advancements in manufacturing processes and technologies, driving efficiency and scale in local production facilities. Moreover, the high Production CAGR of 138.61% from 2022 to 2024 highlights Croatia's efforts to enhance domestic manufacturing capabilities in the medical sector, aligning with the country's strategic economic goals and potentially reducing import dependency.
Key Highlights of the Report:
- Croatia Absorbable Fibrin Sealant Patch Market Outlook
- Market Size of Croatia Absorbable Fibrin Sealant Patch Market, 2025
- Forecast of Croatia Absorbable Fibrin Sealant Patch Market, 2032
- Historical Data and Forecast of Croatia Absorbable Fibrin Sealant Patch Revenues & Volume for the Period 2022 - 2032F
- Croatia Absorbable Fibrin Sealant Patch Market Trend Evolution
- Croatia Absorbable Fibrin Sealant Patch Market Drivers and Challenges
- Croatia Absorbable Fibrin Sealant Patch Price Trends
- Croatia Absorbable Fibrin Sealant Patch Porter's Five Forces
- Croatia Absorbable Fibrin Sealant Patch Industry Life Cycle
- Historical Data and Forecast of Croatia Absorbable Fibrin Sealant Patch Market Revenues & Volume By Patch Type for the Period 2022 - 2032F
- Historical Data and Forecast of Croatia Absorbable Fibrin Sealant Patch Market Revenues & Volume By Liquid Patch for the Period 2022 - 2032F
- Historical Data and Forecast of Croatia Absorbable Fibrin Sealant Patch Market Revenues & Volume By Sheet Patch for the Period 2022 - 2032F
- Historical Data and Forecast of Croatia Absorbable Fibrin Sealant Patch Market Revenues & Volume By Spray Patch for the Period 2022 - 2032F
- Historical Data and Forecast of Croatia Absorbable Fibrin Sealant Patch Market Revenues & Volume By Custom Formulations for the Period 2022 - 2032F
- Historical Data and Forecast of Croatia Absorbable Fibrin Sealant Patch Market Revenues & Volume By Application for the Period 2022 - 2032F
- Historical Data and Forecast of Croatia Absorbable Fibrin Sealant Patch Market Revenues & Volume By Surgical Hemostasis for the Period 2022 - 2032F
- Historical Data and Forecast of Croatia Absorbable Fibrin Sealant Patch Market Revenues & Volume By Wound Closure for the Period 2022 - 2032F
- Historical Data and Forecast of Croatia Absorbable Fibrin Sealant Patch Market Revenues & Volume By Trauma & Emergency Care for the Period 2022 - 2032F
- Historical Data and Forecast of Croatia Absorbable Fibrin Sealant Patch Market Revenues & Volume By Specialty Surgeries for the Period 2022 - 2032F
- Historical Data and Forecast of Croatia Absorbable Fibrin Sealant Patch Market Revenues & Volume By End User for the Period 2022 - 2032F
- Historical Data and Forecast of Croatia Absorbable Fibrin Sealant Patch Market Revenues & Volume By Hospitals for the Period 2022 - 2032F
- Historical Data and Forecast of Croatia Absorbable Fibrin Sealant Patch Market Revenues & Volume By Clinics for the Period 2022 - 2032F
- Historical Data and Forecast of Croatia Absorbable Fibrin Sealant Patch Market Revenues & Volume By Emergency Rooms for the Period 2022 - 2032F
- Historical Data and Forecast of Croatia Absorbable Fibrin Sealant Patch Market Revenues & Volume By Research Institutes for the Period 2022 - 2032F
- Croatia Absorbable Fibrin Sealant Patch Import Export Trade Statistics
- Market Opportunity Assessment By Patch Type
- Market Opportunity Assessment By Application
- Market Opportunity Assessment By End User
- Croatia Absorbable Fibrin Sealant Patch Top Companies Market Share
- Croatia Absorbable Fibrin Sealant Patch Competitive Benchmarking By Technical and Operational Parameters
- Croatia Absorbable Fibrin Sealant Patch Company Profiles
- Croatia Absorbable Fibrin Sealant Patch Key Strategic Recommendations
Frequently Asked Questions About the Market Study (FAQs):
6Wresearch actively monitors the Croatia Absorbable Fibrin Sealant Patch Market and publishes its comprehensive annual report, highlighting emerging trends, growth drivers, revenue analysis, and forecast outlook. Our insights help businesses to make data-backed strategic decisions with ongoing market dynamics. Our analysts track relevent industries related to the Croatia Absorbable Fibrin Sealant Patch Market, allowing our clients with actionable intelligence and reliable forecasts tailored to emerging regional needs.
Yes, we provide customisation as per your requirements. To learn more, feel free to contact us on sales@6wresearch.com
1 Executive Summary |
2 Introduction |
2.1 Key Highlights of the Report |
2.2 Report Description |
2.3 Market Scope & Segmentation |
2.4 Research Methodology |
2.5 Assumptions |
3 Croatia Absorbable Fibrin Sealant Patch Market Overview |
3.1 Croatia Country Macro Economic Indicators |
3.2 Croatia Absorbable Fibrin Sealant Patch Market Revenues & Volume, 2022 & 2032F |
3.3 Croatia Absorbable Fibrin Sealant Patch Market - Industry Life Cycle |
3.4 Croatia Absorbable Fibrin Sealant Patch Market - Porter's Five Forces |
3.5 Croatia Absorbable Fibrin Sealant Patch Market Revenues & Volume Share, By Patch Type, 2022 & 2032F |
3.6 Croatia Absorbable Fibrin Sealant Patch Market Revenues & Volume Share, By Application, 2022 & 2032F |
3.7 Croatia Absorbable Fibrin Sealant Patch Market Revenues & Volume Share, By End User, 2022 & 2032F |
4 Croatia Absorbable Fibrin Sealant Patch Market Dynamics |
4.1 Impact Analysis |
4.2 Market Drivers |
4.3 Market Restraints |
5 Croatia Absorbable Fibrin Sealant Patch Market Trends |
6 Croatia Absorbable Fibrin Sealant Patch Market, By Types |
6.1 Croatia Absorbable Fibrin Sealant Patch Market, By Patch Type |
6.1.1 Overview and Analysis |
6.1.2 Croatia Absorbable Fibrin Sealant Patch Market Revenues & Volume, By Patch Type, 2022 - 2032F |
6.1.3 Croatia Absorbable Fibrin Sealant Patch Market Revenues & Volume, By Liquid Patch, 2022 - 2032F |
6.1.4 Croatia Absorbable Fibrin Sealant Patch Market Revenues & Volume, By Sheet Patch, 2022 - 2032F |
6.1.5 Croatia Absorbable Fibrin Sealant Patch Market Revenues & Volume, By Spray Patch, 2022 - 2032F |
6.1.6 Croatia Absorbable Fibrin Sealant Patch Market Revenues & Volume, By Custom Formulations, 2022 - 2032F |
6.2 Croatia Absorbable Fibrin Sealant Patch Market, By Application |
6.2.1 Overview and Analysis |
6.2.2 Croatia Absorbable Fibrin Sealant Patch Market Revenues & Volume, By Surgical Hemostasis, 2022 - 2032F |
6.2.3 Croatia Absorbable Fibrin Sealant Patch Market Revenues & Volume, By Wound Closure, 2022 - 2032F |
6.2.4 Croatia Absorbable Fibrin Sealant Patch Market Revenues & Volume, By Trauma & Emergency Care, 2022 - 2032F |
6.2.5 Croatia Absorbable Fibrin Sealant Patch Market Revenues & Volume, By Specialty Surgeries, 2022 - 2032F |
6.3 Croatia Absorbable Fibrin Sealant Patch Market, By End User |
6.3.1 Overview and Analysis |
6.3.2 Croatia Absorbable Fibrin Sealant Patch Market Revenues & Volume, By Hospitals, 2022 - 2032F |
6.3.3 Croatia Absorbable Fibrin Sealant Patch Market Revenues & Volume, By Clinics, 2022 - 2032F |
6.3.4 Croatia Absorbable Fibrin Sealant Patch Market Revenues & Volume, By Emergency Rooms, 2022 - 2032F |
6.3.5 Croatia Absorbable Fibrin Sealant Patch Market Revenues & Volume, By Research Institutes, 2022 - 2032F |
7 Croatia Absorbable Fibrin Sealant Patch Market Import-Export Trade Statistics |
7.1 Croatia Absorbable Fibrin Sealant Patch Market Export to Major Countries |
7.2 Croatia Absorbable Fibrin Sealant Patch Market Imports from Major Countries |
8 Croatia Absorbable Fibrin Sealant Patch Market Key Performance Indicators |
9 Croatia Absorbable Fibrin Sealant Patch Market - Opportunity Assessment |
9.1 Croatia Absorbable Fibrin Sealant Patch Market Opportunity Assessment, By Patch Type, 2022 & 2032F |
9.2 Croatia Absorbable Fibrin Sealant Patch Market Opportunity Assessment, By Application, 2022 & 2032F |
9.3 Croatia Absorbable Fibrin Sealant Patch Market Opportunity Assessment, By End User, 2022 & 2032F |
10 Croatia Absorbable Fibrin Sealant Patch Market - Competitive Landscape |
10.1 Croatia Absorbable Fibrin Sealant Patch Market Revenue Share, By Companies, 2025 |
10.2 Croatia Absorbable Fibrin Sealant Patch Market Competitive Benchmarking, By Operating and Technical Parameters |
11 Company Profiles |
12 Recommendations |
13 Disclaimer |
Export potential assessment - trade Analytics for 2030
Export potential enables firms to identify high-growth global markets with greater confidence by combining advanced trade intelligence with a structured quantitative methodology. The framework analyzes emerging demand trends and country-level import patterns while integrating macroeconomic and trade datasets such as GDP and population forecasts, bilateral import–export flows, tariff structures, elasticity differentials between developed and developing economies, geographic distance, and import demand projections. Using weighted trade values from 2020–2024 as the base period to project country-to-country export potential for 2030, these inputs are operationalized through calculated drivers such as gravity model parameters, tariff impact factors, and projected GDP per-capita growth. Through an analysis of hidden potentials, demand hotspots, and market conditions that are most favorable to success, this method enables firms to focus on target countries, maximize returns, and global expansion with data, backed by accuracy.
By factoring in the projected importer demand gap that is currently unmet and could be potential opportunity, it identifies the potential for the Exporter (Country) among 190 countries, against the general trade analysis, which identifies the biggest importer or exporter.
To discover high-growth global markets and optimize your business strategy:
Click Here
Pricing
- Single User License$ 1,995
- Department License$ 2,400
- Site License$ 3,120
- Global License$ 3,795

Search
Thought Leadership and Analyst Meet


Our Clients
Latest Reports
- Canada Cloud CFD Market (2026-2032) | Size & Revenue, Industry, Growth, Competitive Landscape, Forecast, Segmentation, Value, Outlook, Trends, Share, Analysis, Companies
- Taiwan Food Delivery Platform Market (2026-2032) | Companies, Outlook, Analysis, Trends, Value, Revenue, Segmentation, Share, Forecast, Competitive Landscape, Growth, Size & Forecast
- United Kingdom (UK) Long-term Care Insurance Market (2026-2032) | Growth, Share, Consumer Insights, Drivers, Opportunities, Competition, Pricing Analysis, Segments, Restraints, Companies, Competitive, Value, Outlook, Size, Demand, Analysis, Challenges, Strategic Insights, Investment Trends, Revenue, Trends, Supply, Forecast
- United Kingdom (UK) Long Term Care Market (2026-2032) | Companies, Outlook, Analysis, Trends, Value, Revenue, Segmentation, Share, Forecast, Competitive Landscape, Growth, Size & Forecast
- Iraq Insulation and Waterproofing Market (2026-2032) | Outlook, Drivers, Growth, Size, Share, Industry, Revenue, Trends, Demand, Competitive, Strategic Insights, Opportunities, Segments, Companies, Challenges, Strategy, Consumer Insights, Analysis, Investment Trends, Value, Segmentation, Forecast, Restraints
- India Switchgear Market Outlook (2026-2032) | Size, Share, Trends, Growth, Revenue, Forecast, Analysis, Value, Outlook
- Pakistan Contraceptive Implants Market (2025-2031) | Demand, Growth, Size, Share, Industry, Pricing Analysis, Competitive, Strategic Insights, Strategy, Consumer Insights, Analysis, Investment Trends, Opportunities, Revenue, Segments, Value, Segmentation, Supply, Forecast, Restraints, Outlook, Competition, Drivers, Trends, Companies, Challenges
- Sri Lanka Packaging Market (2026-2032) | Outlook, Competition, Drivers, Trends, Demand, Pricing Analysis, Competitive, Strategic Insights, Companies, Challenges, Strategy, Consumer Insights, Analysis, Investment Trends, Opportunities, Growth, Size, Share, Industry, Revenue, Segments, Value, Segmentation, Supply, Forecast, Restraints
- India Kids Watches Market (2026-2032) | Strategy, Consumer Insights, Analysis, Investment Trends, Opportunities, Growth, Size, Share, Industry, Revenue, Segments, Value, Segmentation, Supply, Forecast, Restraints, Outlook, Competition, Drivers, Trends, Demand, Pricing Analysis, Competitive, Strategic Insights, Companies, Challenges
- Saudi Arabia Core Assurance Service Market (2025-2031) | Strategy, Consumer Insights, Analysis, Investment Trends, Opportunities, Growth, Size, Share, Industry, Revenue, Segments, Value, Segmentation, Supply, Forecast, Restraints, Outlook, Competition, Drivers, Trends, Demand, Pricing Analysis, Competitive, Strategic Insights, Companies, Challenges
Industry Events and Analyst Meet

India EV Show 2026

EV tech India Expo 2026

Auto Tech Asia 2026

Battery Tech India 2026

Smart Production Solutions Guangzhou 2026
Whitepaper
- Middle East & Africa Commercial Security Market Click here to view more.
- Middle East & Africa Fire Safety Systems & Equipment Market Click here to view more.
- GCC Drone Market Click here to view more.
- Middle East Lighting Fixture Market Click here to view more.
- GCC Physical & Perimeter Security Market Click here to view more.
6WResearch In News
- Doha a strategic location for EV manufacturing hub: IPA Qatar
- Demand for luxury TVs surging in the GCC, says Samsung
- Empowering Growth: The Thriving Journey of Bangladesh’s Cable Industry
- Demand for luxury TVs surging in the GCC, says Samsung
- Video call with a traditional healer? Once unthinkable, it’s now common in South Africa
- Intelligent Buildings To Smooth GCC’s Path To Net Zero