Croatia Airborne 3d Radar Market (2026-2032) | Challenges, Drivers, Analysis, Share, Segments, Forecast, Size, Supply, Opportunities, Consumer Insights, Outlook, Demand, Strategic Insights, Revenue, Industry, Companies, Competitive, Strategy, Restraints, Segmentation, Value, Investment Trends, Trends, Pricing Analysis, Competition, Growth
Market Forecast By Type (Synthetic Aperture Radar (SAR), Inverse Synthetic Aperture Radar (ISAR)), By Application (Military, Civilian) And Competitive Landscape
| Product Code: ETC12339221 | Publication Date: Apr 2025 | Updated Date: Apr 2026 | Product Type: Market Research Report | |
| Publisher: 6Wresearch | Author: Sachin Kumar Rai | No. of Pages: 65 | No. of Figures: 34 | No. of Tables: 19 |
Croatia Airborne 3D Radar Market Size (2020-2030)
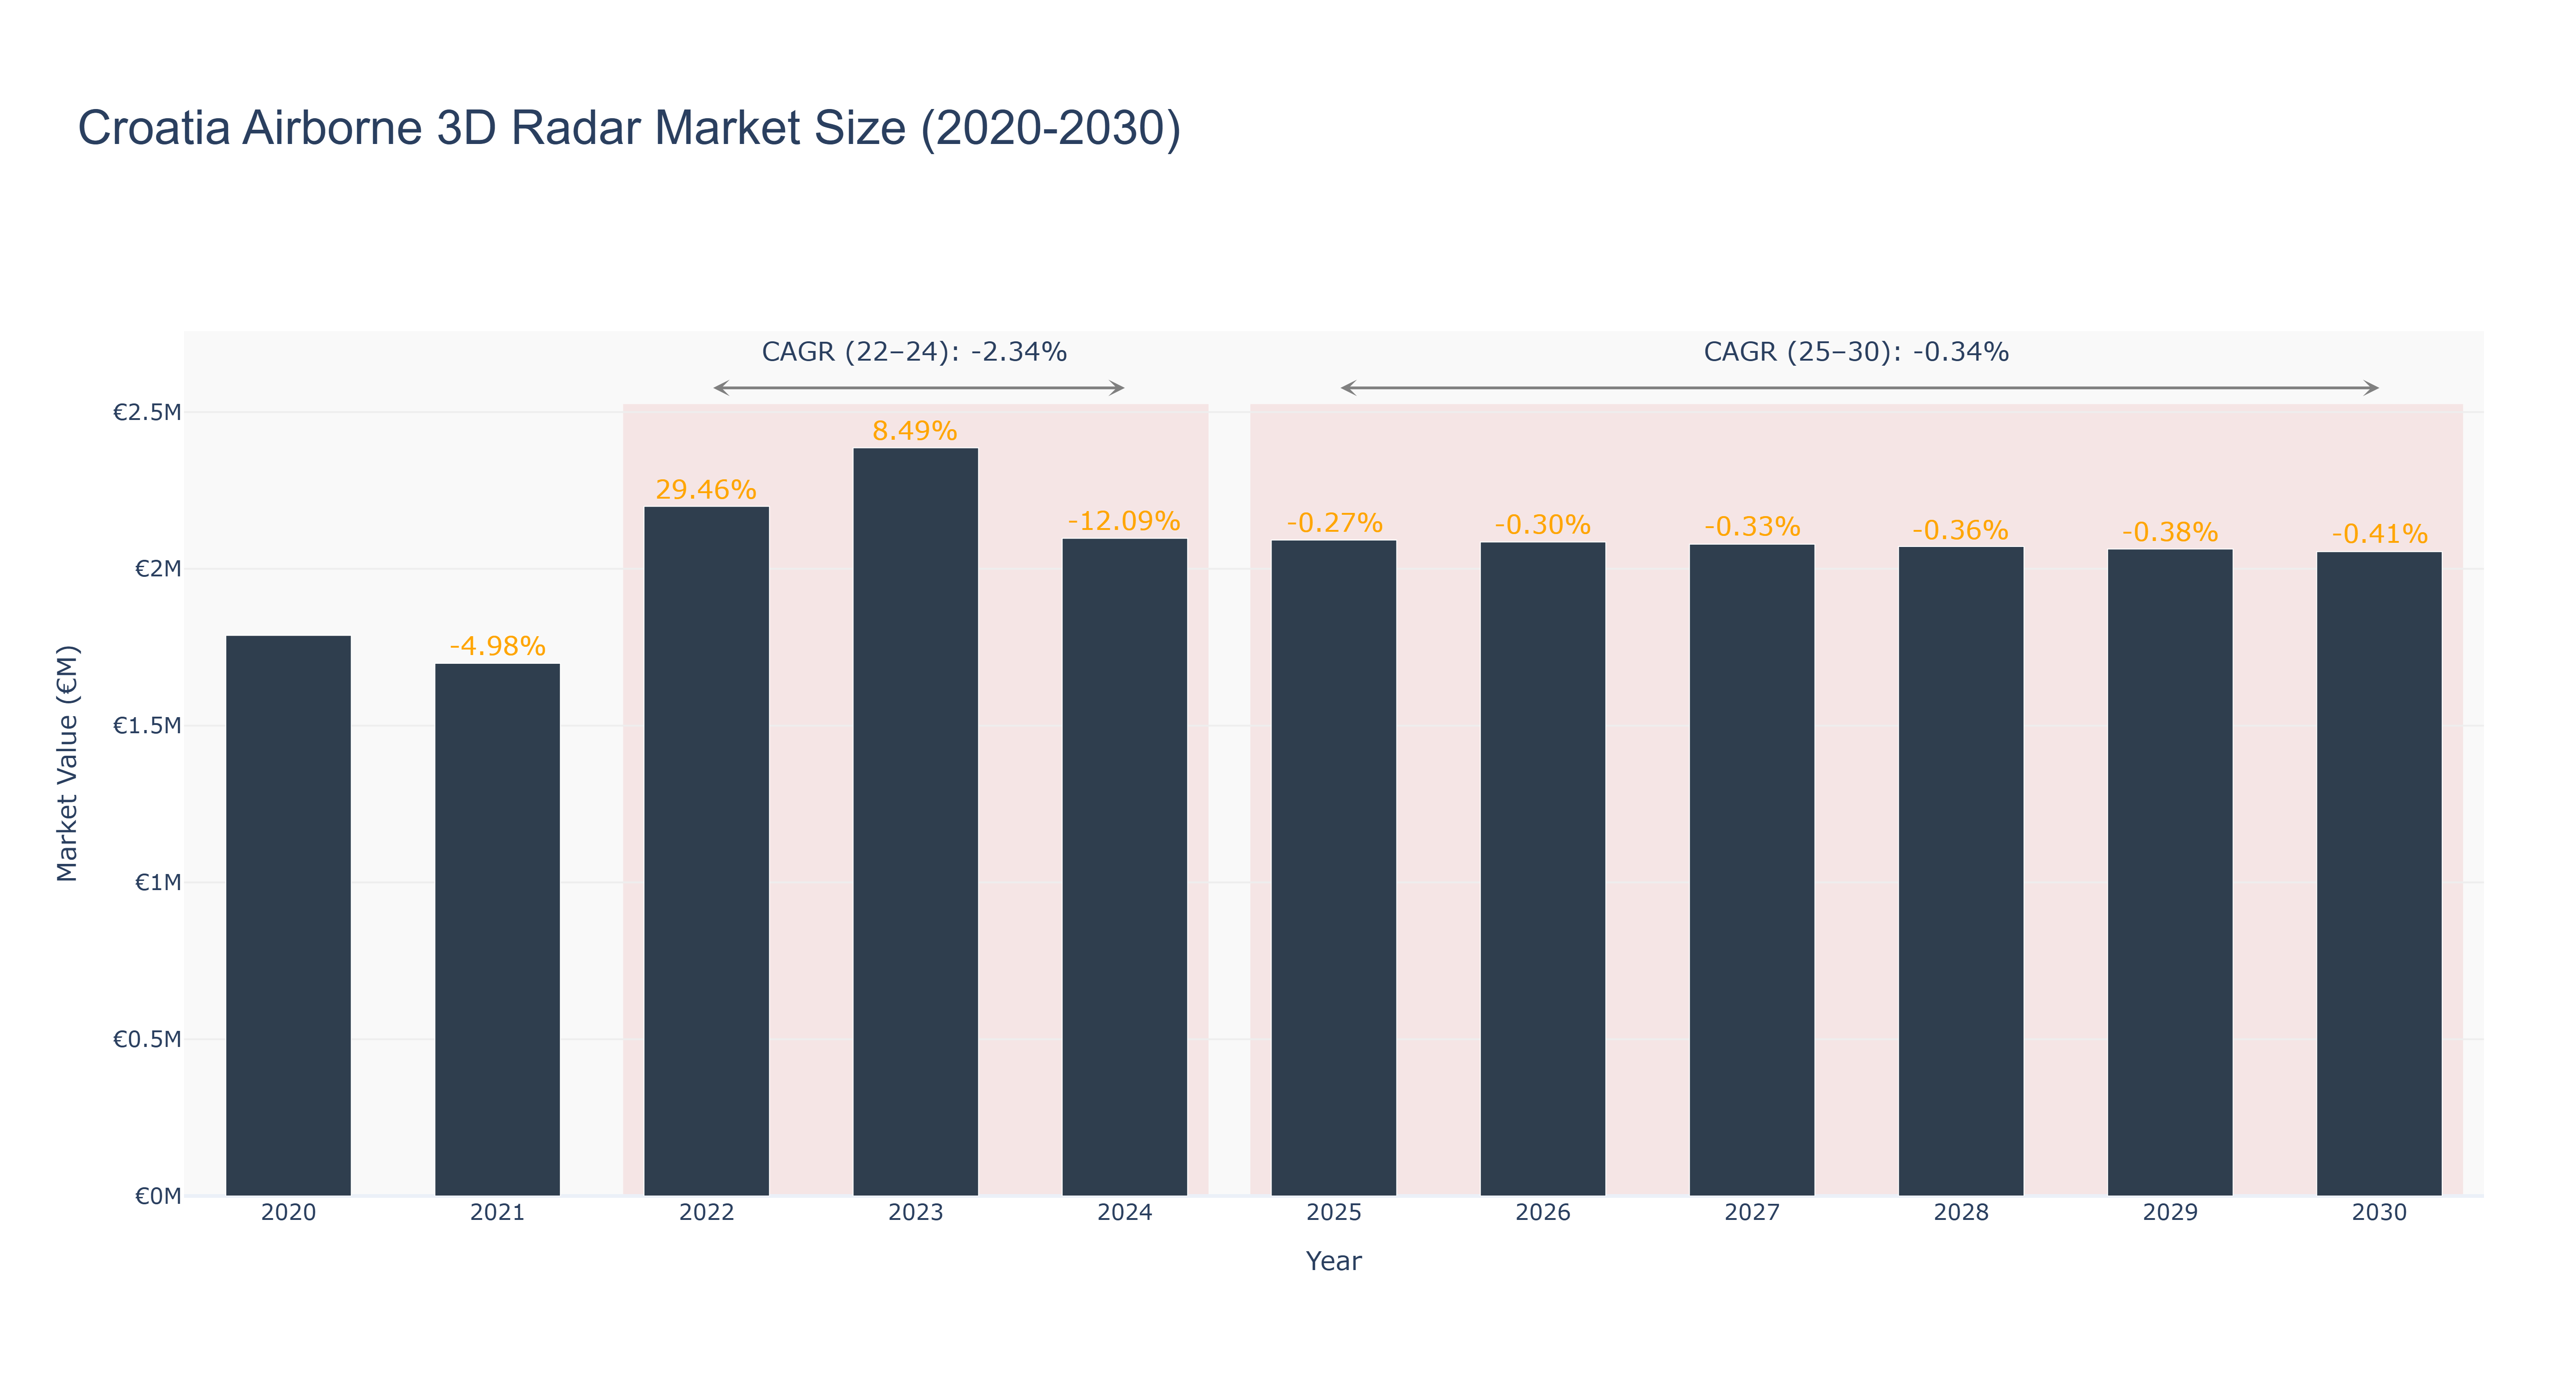
Croatia Airborne 3D Radar Market experienced a peak market size of €2.39 million in 2023, followed by a slight decline to €2.10 million in 2024. The market is forecasted to stabilize around €2.05 million by 2030, with a CAGR of -0.34% from 2025 to 2030. The market's fluctuation can be attributed to global economic uncertainties impacting defense budgets, technological advancements driving market growth, and geopolitical factors influencing demand. Industry drivers include increasing focus on border security and surveillance capabilities. Recent developments in Croatia's defense sector include collaborations with EU partners for joint defense projects and investments in modernizing radar systems. Future developments may involve the integration of AI and machine learning technologies to enhance radar functionalities and improve threat detection capabilities.
Croatia Airborne 3D Radar Market: Production & Trade Performance (2019-2025)
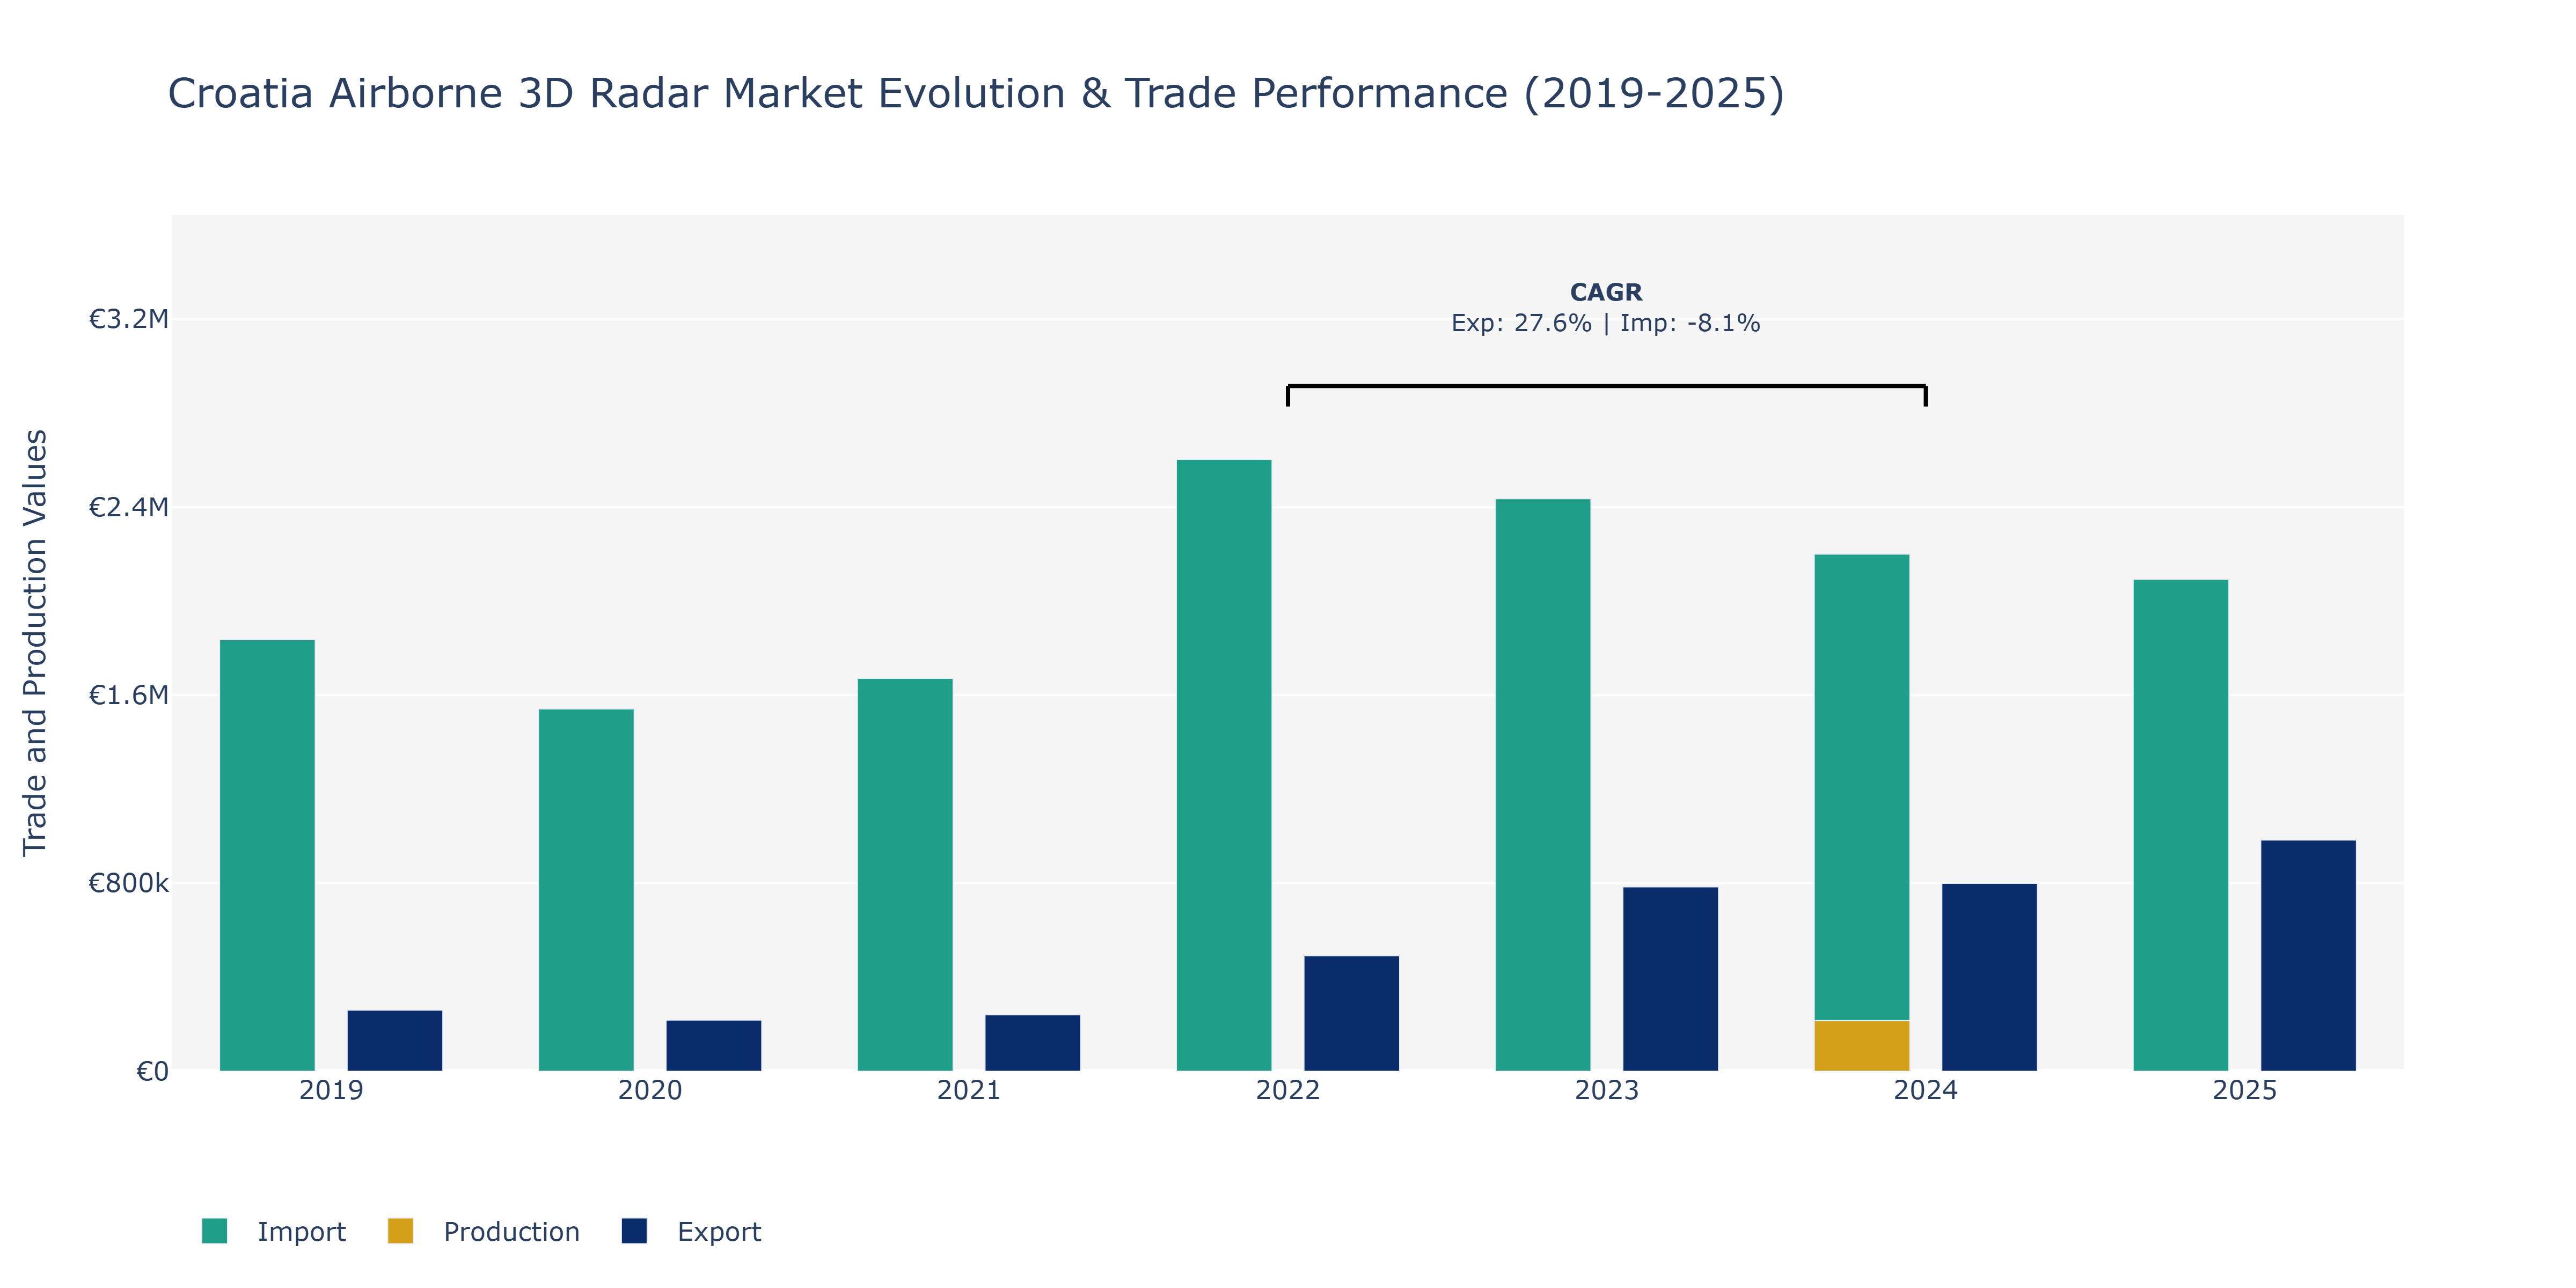
Between 2019 and 2025, Croatia's Airborne 3D Radar Market witnessed fluctuations in exports, imports, and production. Export value showed a gradual increase from €259.72 thousand in 2019 to a peak of €983.46 thousand in 2025, indicating a positive export performance driven by technological advancements and increased global demand. In contrast, imports fluctuated, starting at €1.84 million in 2019, dropping to €1.54 million in 2020, and then rising to €2.6 million in 2022 before slightly declining to €2.09 million in 2025. The surge in exports can be attributed to Croatia's focus on developing cutting-edge radar technology, competitive pricing strategies, and strategic partnerships with key markets, while import fluctuations may reflect changing consumer preferences, global geopolitical shifts, and technological advancements impacting procurement decisions.
Key Highlights of the Report:
- Croatia Airborne 3d Radar Market Outlook
- Market Size of Croatia Airborne 3d Radar Market, 2025
- Forecast of Croatia Airborne 3d Radar Market, 2032
- Historical Data and Forecast of Croatia Airborne 3d Radar Revenues & Volume for the Period 2022 - 2032F
- Croatia Airborne 3d Radar Market Trend Evolution
- Croatia Airborne 3d Radar Market Drivers and Challenges
- Croatia Airborne 3d Radar Price Trends
- Croatia Airborne 3d Radar Porter's Five Forces
- Croatia Airborne 3d Radar Industry Life Cycle
- Historical Data and Forecast of Croatia Airborne 3d Radar Market Revenues & Volume By Type for the Period 2022 - 2032F
- Historical Data and Forecast of Croatia Airborne 3d Radar Market Revenues & Volume By Synthetic Aperture Radar (SAR) for the Period 2022 - 2032F
- Historical Data and Forecast of Croatia Airborne 3d Radar Market Revenues & Volume By Inverse Synthetic Aperture Radar (ISAR) for the Period 2022 - 2032F
- Historical Data and Forecast of Croatia Airborne 3d Radar Market Revenues & Volume By Application for the Period 2022 - 2032F
- Historical Data and Forecast of Croatia Airborne 3d Radar Market Revenues & Volume By Military for the Period 2022 - 2032F
- Historical Data and Forecast of Croatia Airborne 3d Radar Market Revenues & Volume By Civilian for the Period 2022 - 2032F
- Croatia Airborne 3d Radar Import Export Trade Statistics
- Market Opportunity Assessment By Type
- Market Opportunity Assessment By Application
- Croatia Airborne 3d Radar Top Companies Market Share
- Croatia Airborne 3d Radar Competitive Benchmarking By Technical and Operational Parameters
- Croatia Airborne 3d Radar Company Profiles
- Croatia Airborne 3d Radar Key Strategic Recommendations
Frequently Asked Questions About the Market Study (FAQs):
6Wresearch actively monitors the Croatia Airborne 3d Radar Market and publishes its comprehensive annual report, highlighting emerging trends, growth drivers, revenue analysis, and forecast outlook. Our insights help businesses to make data-backed strategic decisions with ongoing market dynamics. Our analysts track relevent industries related to the Croatia Airborne 3d Radar Market, allowing our clients with actionable intelligence and reliable forecasts tailored to emerging regional needs.
Yes, we provide customisation as per your requirements. To learn more, feel free to contact us on sales@6wresearch.com
1 Executive Summary |
2 Introduction |
2.1 Key Highlights of the Report |
2.2 Report Description |
2.3 Market Scope & Segmentation |
2.4 Research Methodology |
2.5 Assumptions |
3 Croatia Airborne 3d Radar Market Overview |
3.1 Croatia Country Macro Economic Indicators |
3.2 Croatia Airborne 3d Radar Market Revenues & Volume, 2022 & 2032F |
3.3 Croatia Airborne 3d Radar Market - Industry Life Cycle |
3.4 Croatia Airborne 3d Radar Market - Porter's Five Forces |
3.5 Croatia Airborne 3d Radar Market Revenues & Volume Share, By Type, 2022 & 2032F |
3.6 Croatia Airborne 3d Radar Market Revenues & Volume Share, By Application, 2022 & 2032F |
4 Croatia Airborne 3d Radar Market Dynamics |
4.1 Impact Analysis |
4.2 Market Drivers |
4.3 Market Restraints |
5 Croatia Airborne 3d Radar Market Trends |
6 Croatia Airborne 3d Radar Market, By Types |
6.1 Croatia Airborne 3d Radar Market, By Type |
6.1.1 Overview and Analysis |
6.1.2 Croatia Airborne 3d Radar Market Revenues & Volume, By Type, 2022 - 2032F |
6.1.3 Croatia Airborne 3d Radar Market Revenues & Volume, By Synthetic Aperture Radar (SAR), 2022 - 2032F |
6.1.4 Croatia Airborne 3d Radar Market Revenues & Volume, By Inverse Synthetic Aperture Radar (ISAR), 2022 - 2032F |
6.2 Croatia Airborne 3d Radar Market, By Application |
6.2.1 Overview and Analysis |
6.2.2 Croatia Airborne 3d Radar Market Revenues & Volume, By Military, 2022 - 2032F |
6.2.3 Croatia Airborne 3d Radar Market Revenues & Volume, By Civilian, 2022 - 2032F |
7 Croatia Airborne 3d Radar Market Import-Export Trade Statistics |
7.1 Croatia Airborne 3d Radar Market Export to Major Countries |
7.2 Croatia Airborne 3d Radar Market Imports from Major Countries |
8 Croatia Airborne 3d Radar Market Key Performance Indicators |
9 Croatia Airborne 3d Radar Market - Opportunity Assessment |
9.1 Croatia Airborne 3d Radar Market Opportunity Assessment, By Type, 2022 & 2032F |
9.2 Croatia Airborne 3d Radar Market Opportunity Assessment, By Application, 2022 & 2032F |
10 Croatia Airborne 3d Radar Market - Competitive Landscape |
10.1 Croatia Airborne 3d Radar Market Revenue Share, By Companies, 2025 |
10.2 Croatia Airborne 3d Radar Market Competitive Benchmarking, By Operating and Technical Parameters |
11 Company Profiles |
12 Recommendations |
13 Disclaimer |
Global Go To Market Strategy - 2030
Export potential enables firms to identify high-growth global markets with greater confidence by combining advanced trade intelligence with a structured quantitative methodology. The framework analyzes emerging demand trends and country-level import patterns while integrating macroeconomic and trade datasets such as GDP and population forecasts, bilateral import–export flows, tariff structures, elasticity differentials between developed and developing economies, geographic distance, and import demand projections. Using weighted trade values from 2020–2024 as the base period to project country-to-country export potential for 2030, these inputs are operationalized through calculated drivers such as gravity model parameters, tariff impact factors, and projected GDP per-capita growth. Through an analysis of hidden potentials, demand hotspots, and market conditions that are most favorable to success, this method enables firms to focus on target countries, maximize returns, and global expansion with data, backed by accuracy.
By factoring in the projected importer demand gap that is currently unmet and could be potential opportunity, it identifies the potential for the Exporter (Country) among 190 countries, against the general trade analysis, which identifies the biggest importer or exporter.
To discover high-growth global markets and optimize your business strategy:
Click Here
Pricing
- Single User License$ 1,995
- Department License$ 2,400
- Site License$ 3,120
- Global License$ 3,795

Leadership Perspectives from Industry Events
Search
Thought Leadership and Analyst Meet


Our Clients
6WResearch In News
- Doha a strategic location for EV manufacturing hub: IPA Qatar
- Demand for luxury TVs surging in the GCC, says Samsung
- Empowering Growth: The Thriving Journey of Bangladesh’s Cable Industry
- Demand for luxury TVs surging in the GCC, says Samsung
- Video call with a traditional healer? Once unthinkable, it’s now common in South Africa
- Intelligent Buildings To Smooth GCC’s Path To Net Zero
Latest Reports
- Taiwan Airport Wireless Infrastructure Market (2026-2032)
- Vietnam Airport Wireless Infrastructure Market (2026-2032)
- Thailand Airport Wireless Infrastructure Market (2026-2032)
- South Korea Airport Wireless Infrastructure Market (2026-2032)
- Romania Airport Wireless Infrastructure Market (2026-2032)
- Qatar Airport Wireless Infrastructure Market (2026-2032)
- Philippines Airport Wireless Infrastructure Market (2026-2032)
- Japan Airport Wireless Infrastructure Market (2026-2032)
- Taiwan Airport Winter Services Market (2026-2032)
- Vietnam Airport Winter Services Market (2026-2032)
Industry Events and Analyst Meet

HIMTEX 2026

India Refining Summit 2026

India EV Show 2026

EV tech India Expo 2026

Auto Tech Asia 2026
Whitepaper
- Middle East & Africa Commercial Security Market Click here to view more.
- Middle East & Africa Fire Safety Systems & Equipment Market Click here to view more.
- GCC Drone Market Click here to view more.
- Middle East Lighting Fixture Market Click here to view more.
- GCC Physical & Perimeter Security Market Click here to view more.