Croatia Artificial Flowers Market (2025-2031) | Segmentation, Size, Industry, Revenue, Forecast, Companies, Outlook, Trends, Value, Share, Growth & Analysis
Market Forecast By Material Type (Clay & Porcelain, Cotton & Silk, Leather & Nylon, Paper & Wax, Plastic & Polyester), By Application (Commercial, Residential) And Competitive Landscape
| Product Code: ETC4982601 | Publication Date: Nov 2023 | Updated Date: Apr 2026 | Product Type: Market Research Report | |
| Publisher: 6Wresearch | Author: Shubham Padhi | No. of Pages: 60 | No. of Figures: 30 | No. of Tables: 5 |
Croatia Artificial Flowers Market Size (2020-2030)
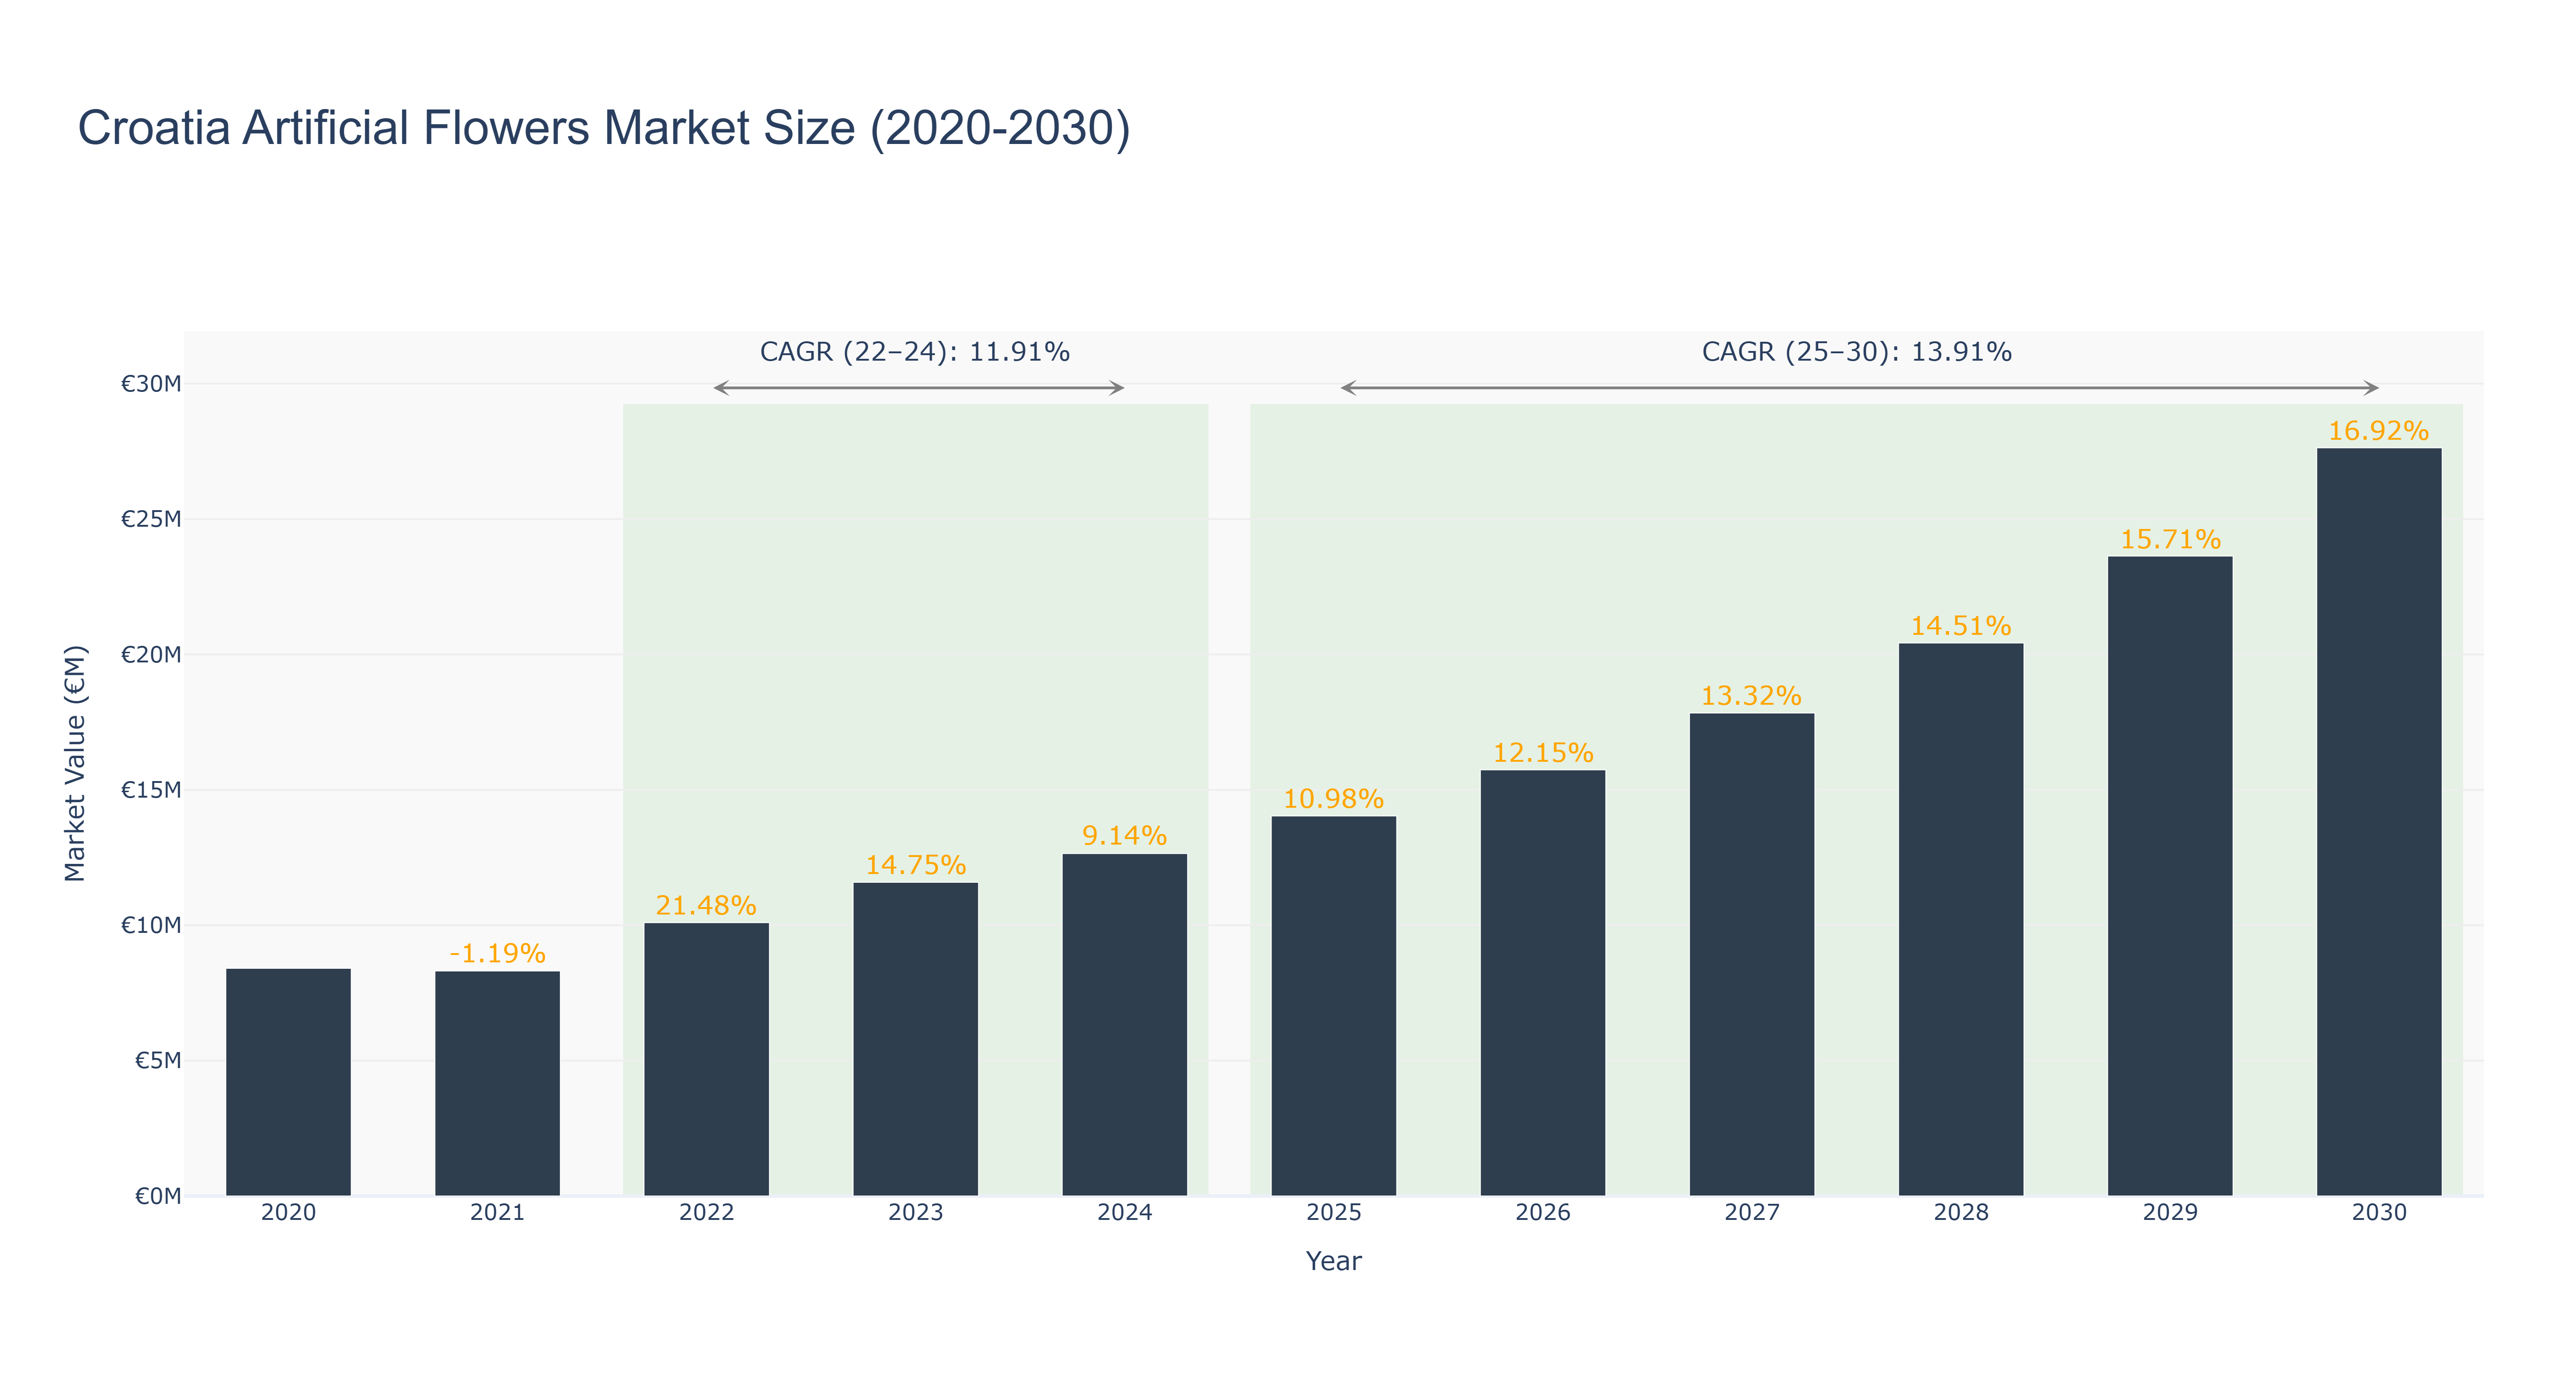
Croatia Artificial Flowers Market has shown a steady growth trajectory over the past decade. The peak market size of €27.63 million is forecasted for 2030, with a notable growth rate of 16.92%. From 2020 to 2024, the market size has increased from €8.41 million to €12.65 million, driven by increasing consumer demand for artificial flowers in home decor and events. The market experienced a significant spike in growth from 2022 to 2024, attributed to innovative product offerings and expanding distribution channels. Looking ahead, the projected CAGR from 2025 to 2030 stands at 13.91%, showcasing sustained market expansion. Recent developments include partnerships with local artisans for unique designs and upcoming initiatives to promote sustainable practices in artificial flower production, positioning Croatia as a hub for quality artificial floral products.
Croatia Artificial Flowers Market: Production & Trade Performance (2019-2025)
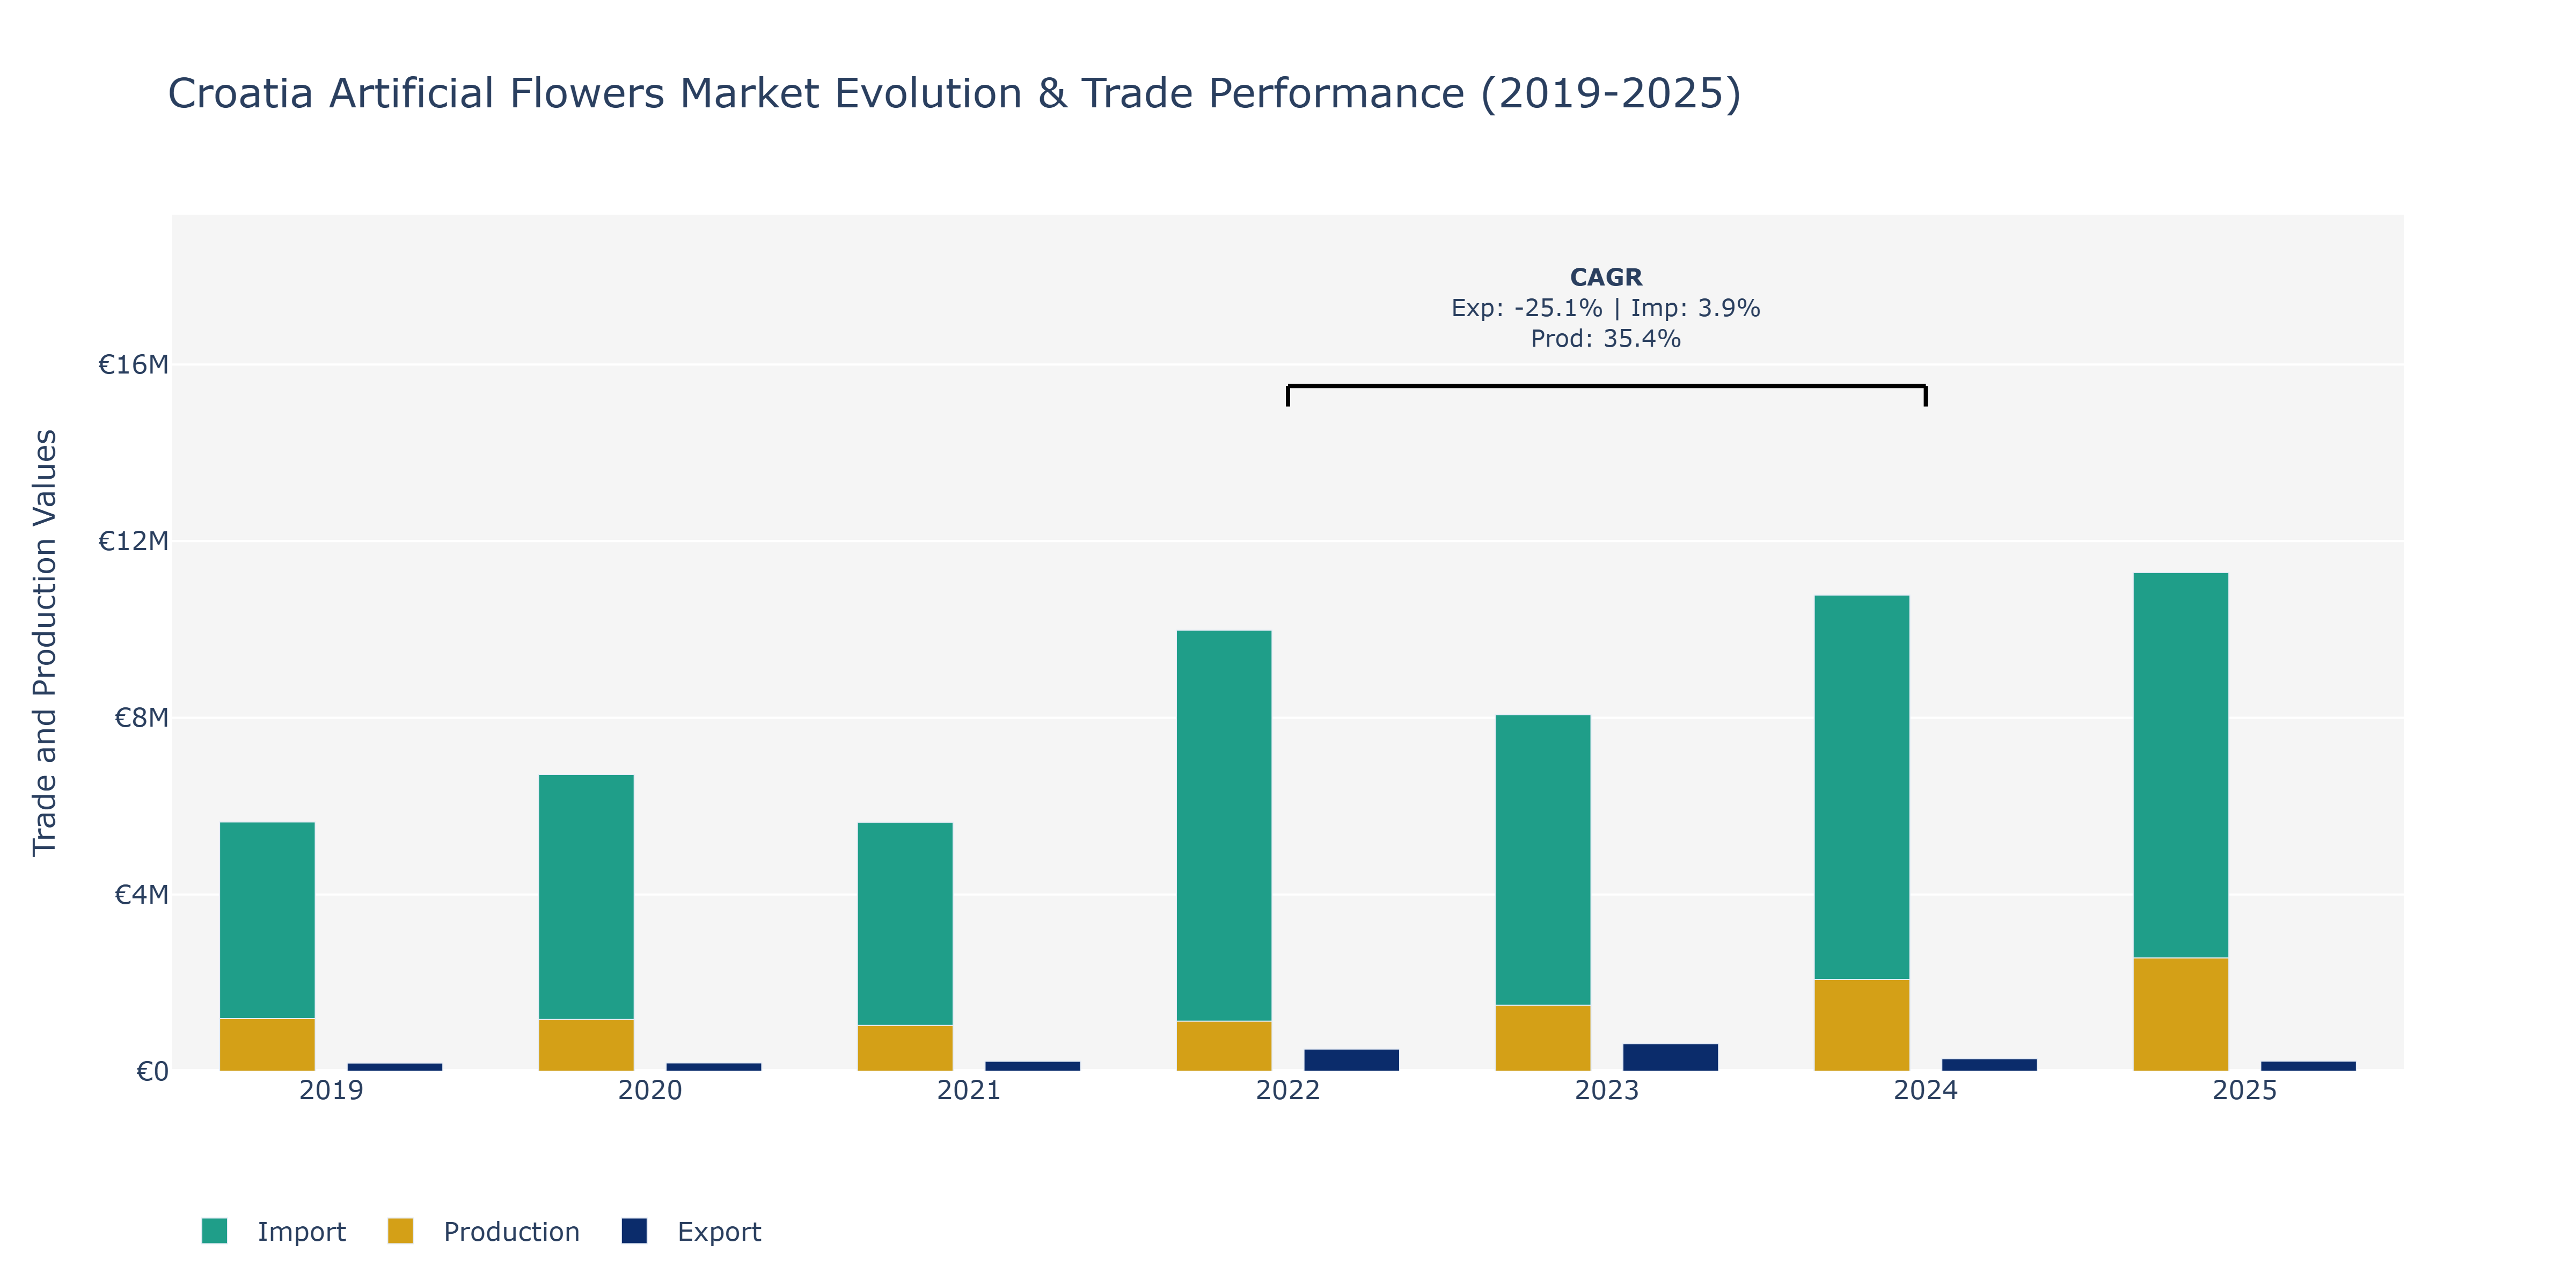
In the Croatia Artificial Flowers Market, exports exhibited fluctuations over the analyzed period, with a peak in 2022 at €501.1 thousand, driven by potential increased demand or possibly a strategic market expansion effort. Imports steadily increased from €5.64 million in 2019 to €11.29 million in 2025, indicating a consistent influx of foreign artificial flowers, perhaps due to evolving consumer preferences or competitive pricing abroad. Production saw a significant growth, reaching €2.6 billion in 2025, reflecting a strong domestic manufacturing capacity supported by technological advancements or operational efficiencies. The market's dynamics suggest a balancing act between international trade dependencies and local production capabilities, emphasizing the need for market players to optimize sourcing strategies and operational processes to remain competitive in the global artificial flowers industry.
Key Highlights of the Report:
- Croatia Artificial Flowers Market Outlook
- Market Size of Croatia Artificial Flowers Market, 2024
- Forecast of Croatia Artificial Flowers Market, 2031
- Historical Data and Forecast of Croatia Artificial Flowers Revenues & Volume for the Period 2021-2031
- Croatia Artificial Flowers Market Trend Evolution
- Croatia Artificial Flowers Market Drivers and Challenges
- Croatia Artificial Flowers Price Trends
- Croatia Artificial Flowers Porter`s Five Forces
- Croatia Artificial Flowers Industry Life Cycle
- Historical Data and Forecast of Croatia Artificial Flowers Market Revenues & Volume By Material Type for the Period 2021-2031
- Historical Data and Forecast of Croatia Artificial Flowers Market Revenues & Volume By Clay & Porcelain for the Period 2021-2031
- Historical Data and Forecast of Croatia Artificial Flowers Market Revenues & Volume By Cotton & Silk for the Period 2021-2031
- Historical Data and Forecast of Croatia Artificial Flowers Market Revenues & Volume By Leather & Nylon for the Period 2021-2031
- Historical Data and Forecast of Croatia Artificial Flowers Market Revenues & Volume By Paper & Wax for the Period 2021-2031
- Historical Data and Forecast of Croatia Artificial Flowers Market Revenues & Volume By Plastic & Polyester for the Period 2021-2031
- Historical Data and Forecast of Croatia Artificial Flowers Market Revenues & Volume By Application for the Period 2021-2031
- Historical Data and Forecast of Croatia Artificial Flowers Market Revenues & Volume By Commercial for the Period 2021-2031
- Historical Data and Forecast of Croatia Artificial Flowers Market Revenues & Volume By Residential for the Period 2021-2031
- Croatia Artificial Flowers Import Export Trade Statistics
- Market Opportunity Assessment By Material Type
- Market Opportunity Assessment By Application
- Croatia Artificial Flowers Top Companies Market Share
- Croatia Artificial Flowers Competitive Benchmarking By Technical and Operational Parameters
- Croatia Artificial Flowers Company Profiles
- Croatia Artificial Flowers Key Strategic Recommendations
Frequently Asked Questions About the Market Study (FAQs):
6Wresearch actively monitors the Croatia Artificial Flowers Market and publishes its comprehensive annual report, highlighting emerging trends, growth drivers, revenue analysis, and forecast outlook. Our insights help businesses to make data-backed strategic decisions with ongoing market dynamics. Our analysts track relevent industries related to the Croatia Artificial Flowers Market, allowing our clients with actionable intelligence and reliable forecasts tailored to emerging regional needs.
Yes, we provide customisation as per your requirements. To learn more, feel free to contact us on sales@6wresearch.com
1 Executive Summary |
2 Introduction |
2.1 Key Highlights of the Report |
2.2 Report Description |
2.3 Market Scope & Segmentation |
2.4 Research Methodology |
2.5 Assumptions |
3 Croatia Artificial Flowers Market Overview |
3.1 Croatia Country Macro Economic Indicators |
3.2 Croatia Artificial Flowers Market Revenues & Volume, 2021 & 2031F |
3.3 Croatia Artificial Flowers Market - Industry Life Cycle |
3.4 Croatia Artificial Flowers Market - Porter's Five Forces |
3.5 Croatia Artificial Flowers Market Revenues & Volume Share, By Material Type, 2021 & 2031F |
3.6 Croatia Artificial Flowers Market Revenues & Volume Share, By Application, 2021 & 2031F |
4 Croatia Artificial Flowers Market Dynamics |
4.1 Impact Analysis |
4.2 Market Drivers |
4.2.1 Growing demand for low-maintenance and long-lasting floral décor solutions |
4.2.2 Increasing adoption of artificial flowers in events and weddings for cost-effectiveness |
4.2.3 Rising awareness about the environmental benefits of artificial flowers compared to real flowers |
4.3 Market Restraints |
4.3.1 Competition from fresh flower market |
4.3.2 Perception of artificial flowers being less aesthetically pleasing than real flowers |
4.3.3 Concerns about the environmental impact of artificial flower production |
5 Croatia Artificial Flowers Market Trends |
6 Croatia Artificial Flowers Market Segmentations |
6.1 Croatia Artificial Flowers Market, By Material Type |
6.1.1 Overview and Analysis |
6.1.2 Croatia Artificial Flowers Market Revenues & Volume, By Clay & Porcelain, 2021-2031F |
6.1.3 Croatia Artificial Flowers Market Revenues & Volume, By Cotton & Silk, 2021-2031F |
6.1.4 Croatia Artificial Flowers Market Revenues & Volume, By Leather & Nylon, 2021-2031F |
6.1.5 Croatia Artificial Flowers Market Revenues & Volume, By Paper & Wax, 2021-2031F |
6.1.6 Croatia Artificial Flowers Market Revenues & Volume, By Plastic & Polyester, 2021-2031F |
6.2 Croatia Artificial Flowers Market, By Application |
6.2.1 Overview and Analysis |
6.2.2 Croatia Artificial Flowers Market Revenues & Volume, By Commercial, 2021-2031F |
6.2.3 Croatia Artificial Flowers Market Revenues & Volume, By Residential, 2021-2031F |
7 Croatia Artificial Flowers Market Import-Export Trade Statistics |
7.1 Croatia Artificial Flowers Market Export to Major Countries |
7.2 Croatia Artificial Flowers Market Imports from Major Countries |
8 Croatia Artificial Flowers Market Key Performance Indicators |
8.1 Percentage increase in the use of artificial flowers in event decorations annually |
8.2 Number of new product launches in the artificial flowers market |
8.3 Growth in the number of retail outlets selling artificial flowers in Croatia |
9 Croatia Artificial Flowers Market - Opportunity Assessment |
9.1 Croatia Artificial Flowers Market Opportunity Assessment, By Material Type, 2021 & 2031F |
9.2 Croatia Artificial Flowers Market Opportunity Assessment, By Application, 2021 & 2031F |
10 Croatia Artificial Flowers Market - Competitive Landscape |
10.1 Croatia Artificial Flowers Market Revenue Share, By Companies, 2024 |
10.2 Croatia Artificial Flowers Market Competitive Benchmarking, By Operating and Technical Parameters |
11 Company Profiles |
12 Recommendations | 13 Disclaimer |
Export potential assessment - trade Analytics for 2030
Export potential enables firms to identify high-growth global markets with greater confidence by combining advanced trade intelligence with a structured quantitative methodology. The framework analyzes emerging demand trends and country-level import patterns while integrating macroeconomic and trade datasets such as GDP and population forecasts, bilateral import–export flows, tariff structures, elasticity differentials between developed and developing economies, geographic distance, and import demand projections. Using weighted trade values from 2020–2024 as the base period to project country-to-country export potential for 2030, these inputs are operationalized through calculated drivers such as gravity model parameters, tariff impact factors, and projected GDP per-capita growth. Through an analysis of hidden potentials, demand hotspots, and market conditions that are most favorable to success, this method enables firms to focus on target countries, maximize returns, and global expansion with data, backed by accuracy.
By factoring in the projected importer demand gap that is currently unmet and could be potential opportunity, it identifies the potential for the Exporter (Country) among 190 countries, against the general trade analysis, which identifies the biggest importer or exporter.
To discover high-growth global markets and optimize your business strategy:
Click Here
Pricing
- Single User License$ 1,995
- Department License$ 2,400
- Site License$ 3,120
- Global License$ 3,795

Search
Thought Leadership and Analyst Meet


Our Clients
Latest Reports
- Canada Cloud CFD Market (2026-2032) | Size & Revenue, Industry, Growth, Competitive Landscape, Forecast, Segmentation, Value, Outlook, Trends, Share, Analysis, Companies
- Taiwan Food Delivery Platform Market (2026-2032) | Companies, Outlook, Analysis, Trends, Value, Revenue, Segmentation, Share, Forecast, Competitive Landscape, Growth, Size & Forecast
- United Kingdom (UK) Long-term Care Insurance Market (2026-2032) | Growth, Share, Consumer Insights, Drivers, Opportunities, Competition, Pricing Analysis, Segments, Restraints, Companies, Competitive, Value, Outlook, Size, Demand, Analysis, Challenges, Strategic Insights, Investment Trends, Revenue, Trends, Supply, Forecast
- United Kingdom (UK) Long Term Care Market (2026-2032) | Companies, Outlook, Analysis, Trends, Value, Revenue, Segmentation, Share, Forecast, Competitive Landscape, Growth, Size & Forecast
- Iraq Insulation and Waterproofing Market (2026-2032) | Outlook, Drivers, Growth, Size, Share, Industry, Revenue, Trends, Demand, Competitive, Strategic Insights, Opportunities, Segments, Companies, Challenges, Strategy, Consumer Insights, Analysis, Investment Trends, Value, Segmentation, Forecast, Restraints
- India Switchgear Market Outlook (2026-2032) | Size, Share, Trends, Growth, Revenue, Forecast, Analysis, Value, Outlook
- Pakistan Contraceptive Implants Market (2025-2031) | Demand, Growth, Size, Share, Industry, Pricing Analysis, Competitive, Strategic Insights, Strategy, Consumer Insights, Analysis, Investment Trends, Opportunities, Revenue, Segments, Value, Segmentation, Supply, Forecast, Restraints, Outlook, Competition, Drivers, Trends, Companies, Challenges
- Sri Lanka Packaging Market (2026-2032) | Outlook, Competition, Drivers, Trends, Demand, Pricing Analysis, Competitive, Strategic Insights, Companies, Challenges, Strategy, Consumer Insights, Analysis, Investment Trends, Opportunities, Growth, Size, Share, Industry, Revenue, Segments, Value, Segmentation, Supply, Forecast, Restraints
- India Kids Watches Market (2026-2032) | Strategy, Consumer Insights, Analysis, Investment Trends, Opportunities, Growth, Size, Share, Industry, Revenue, Segments, Value, Segmentation, Supply, Forecast, Restraints, Outlook, Competition, Drivers, Trends, Demand, Pricing Analysis, Competitive, Strategic Insights, Companies, Challenges
- Saudi Arabia Core Assurance Service Market (2025-2031) | Strategy, Consumer Insights, Analysis, Investment Trends, Opportunities, Growth, Size, Share, Industry, Revenue, Segments, Value, Segmentation, Supply, Forecast, Restraints, Outlook, Competition, Drivers, Trends, Demand, Pricing Analysis, Competitive, Strategic Insights, Companies, Challenges
Industry Events and Analyst Meet

India EV Show 2026

EV tech India Expo 2026

Auto Tech Asia 2026

Battery Tech India 2026

Smart Production Solutions Guangzhou 2026
Whitepaper
- Middle East & Africa Commercial Security Market Click here to view more.
- Middle East & Africa Fire Safety Systems & Equipment Market Click here to view more.
- GCC Drone Market Click here to view more.
- Middle East Lighting Fixture Market Click here to view more.
- GCC Physical & Perimeter Security Market Click here to view more.
6WResearch In News
- Doha a strategic location for EV manufacturing hub: IPA Qatar
- Demand for luxury TVs surging in the GCC, says Samsung
- Empowering Growth: The Thriving Journey of Bangladesh’s Cable Industry
- Demand for luxury TVs surging in the GCC, says Samsung
- Video call with a traditional healer? Once unthinkable, it’s now common in South Africa
- Intelligent Buildings To Smooth GCC’s Path To Net Zero