Croatia Bio-Based Lubricants Market (2026-2032) | Strategy, Industry, Segments, Companies, Consumer Insights, Drivers, Forecast, Trends, Outlook, Size, Strategic Insights, Pricing Analysis, Supply, Demand, Restraints, Share, Revenue, Investment Trends, Competitive, Growth, Opportunities, Analysis, Segmentation, Challenges, Value, Competition
Market Forecast By Lubricant Type (Hydraulic Oils, Gear Oils, Engine Oils), By Application (Machinery, Automotives, Marine), By End User (Industrial, Automotive, Transportation), By Source (Corn-Based, Biomass, Plant-Based), By Environmental Impact (Biodegradable, Low Carbon Footprint, Renewable) And Competitive Landscape
| Product Code: ETC11446229 | Publication Date: Apr 2025 | Updated Date: Apr 2026 | Product Type: Market Research Report | |
| Publisher: 6Wresearch | No. of Pages: 65 | No. of Figures: 34 | No. of Tables: 19 | |
Croatia Bio-Based Lubricants Market Size (2020-2030)
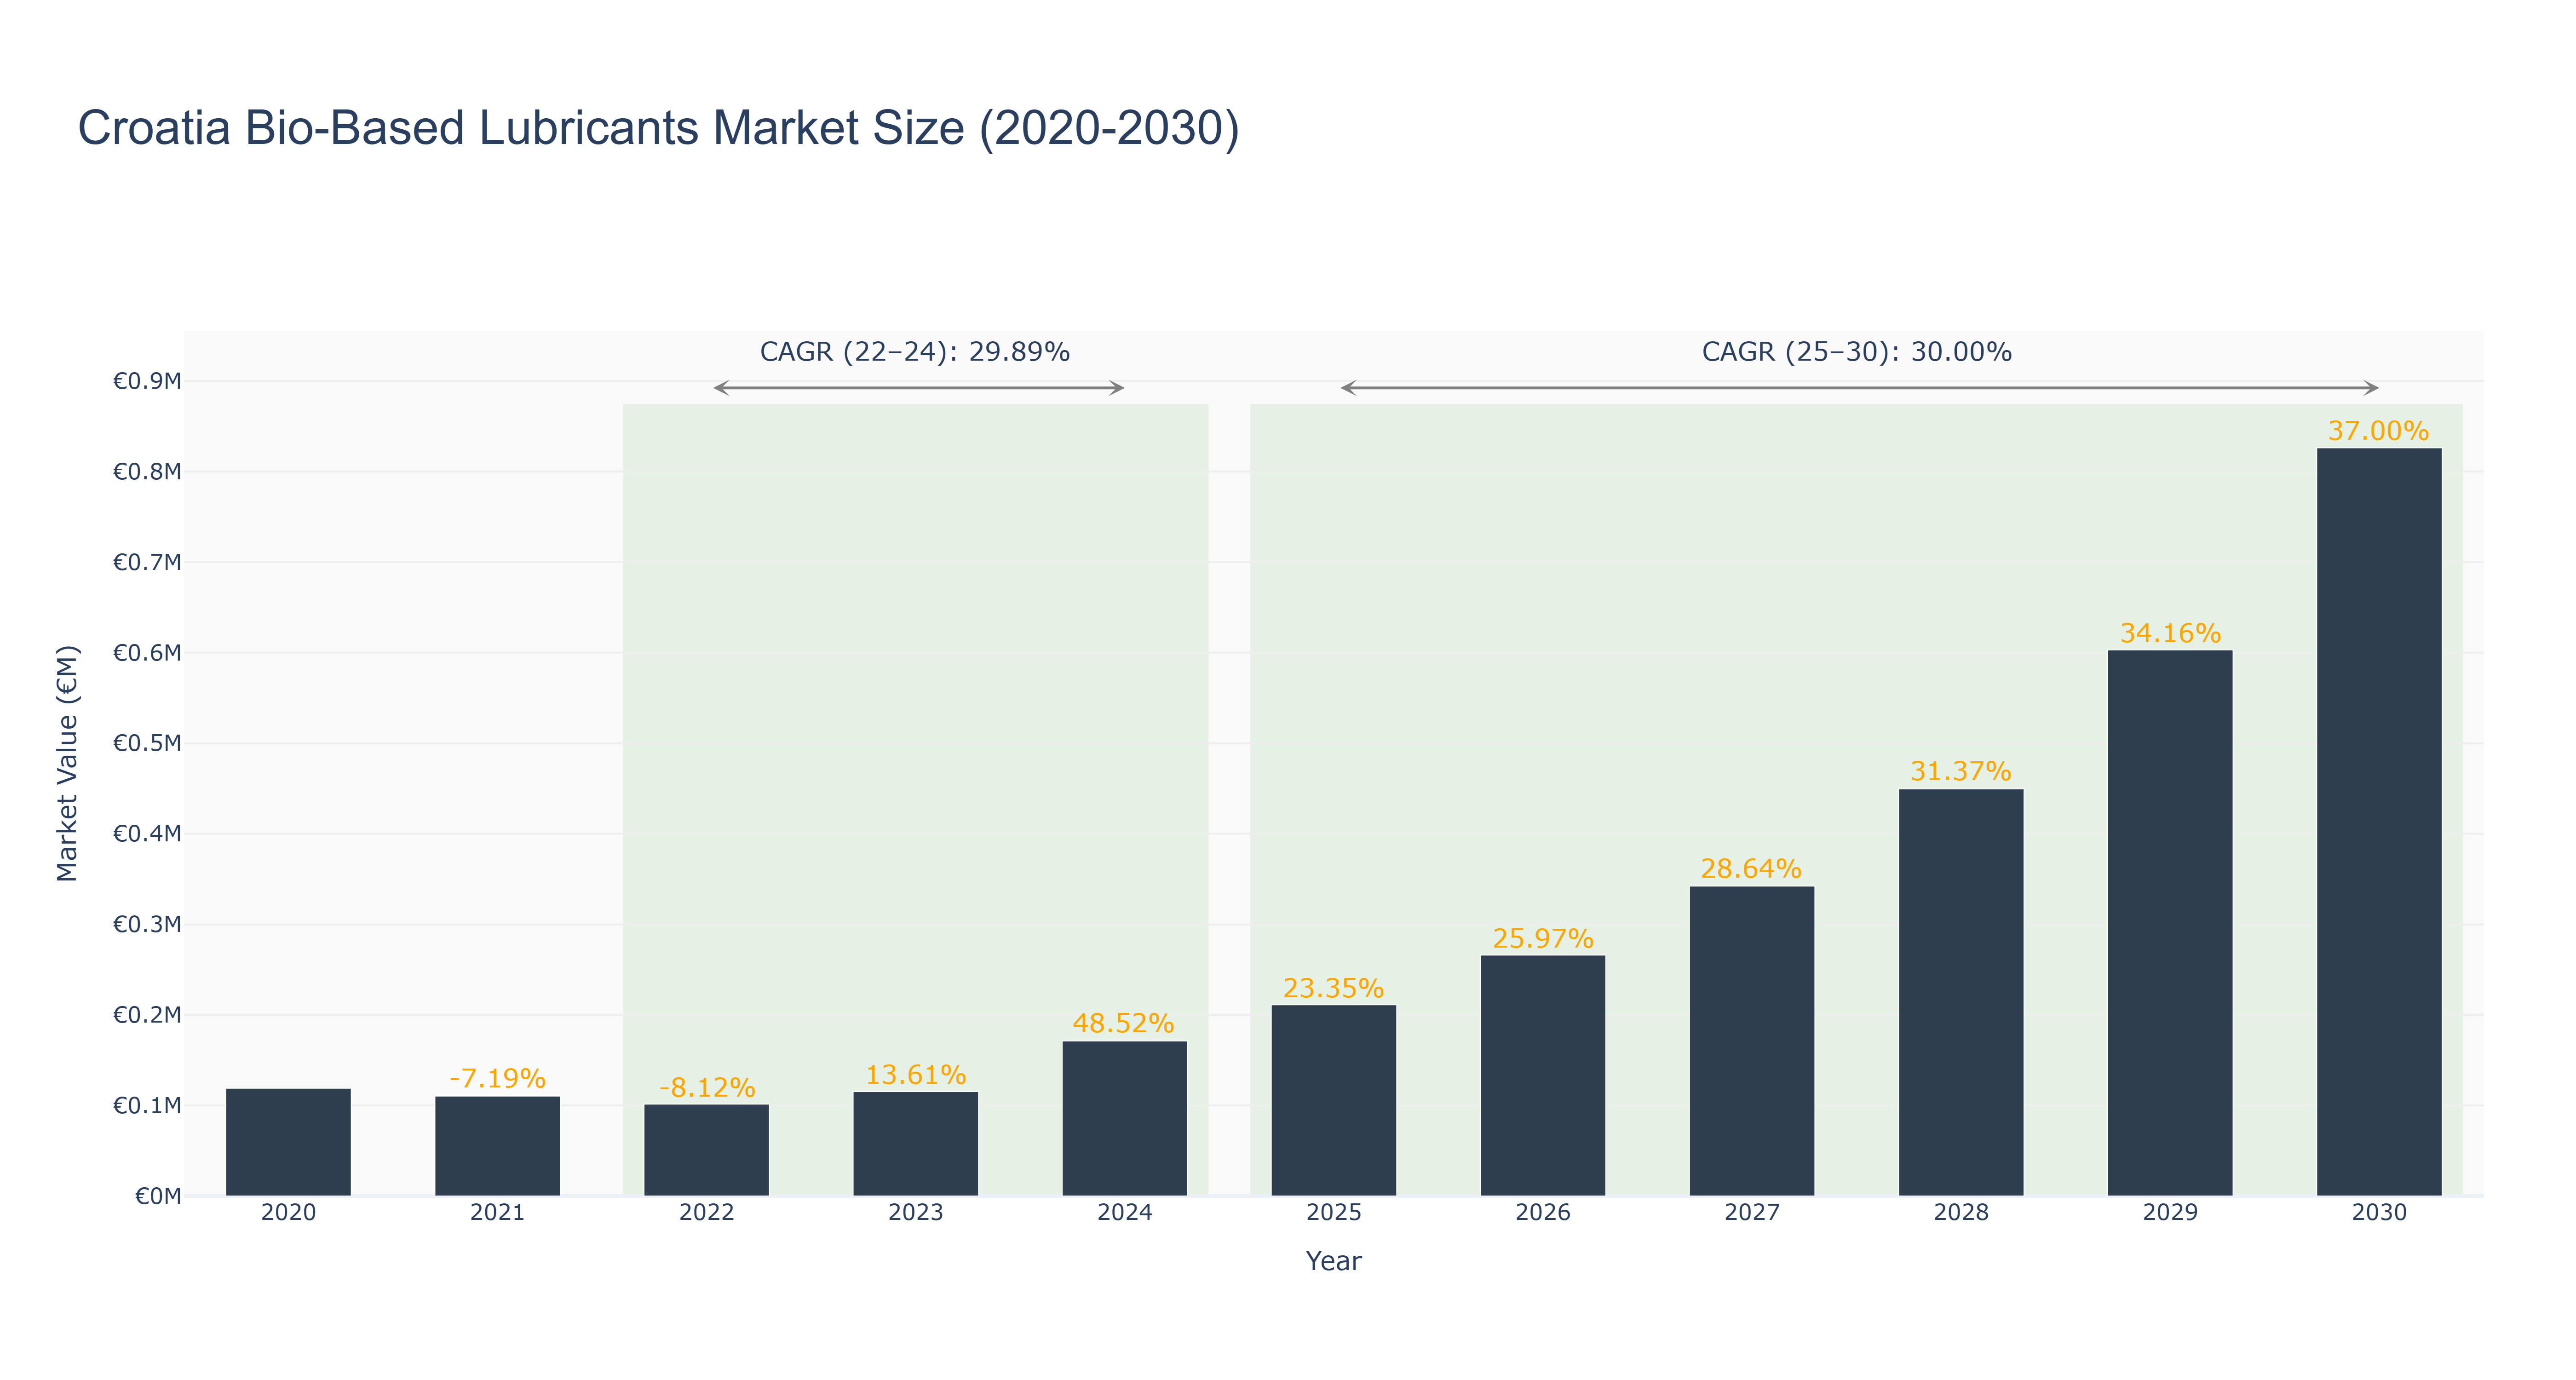
Croatia Bio-Based Lubricants Market has shown a fluctuating trend over the years. The peak market size of €0.83 million was achieved in 2030, with a steady growth rate. From 2020 to 2024, the market size decreased from €0.12 million to €0.17 million due to economic downturns and limited consumer awareness. However, a positive turnaround began in 2025, with a forecasted market size reaching €0.60 million by 2029 and further growing to €0.83 million in 2030. The market's CAGR between 2022-24 was 29.89%, and between 2025-30 it is expected to be 30.0%. Industry drivers such as increasing environmental consciousness and government initiatives promoting bio-based products are fueling this growth. In the near future, Croatia is set to introduce new regulations supporting the bio-based lubricants market, ensuring sustained growth and market expansion.
Croatia Bio-Based Lubricants Market: Production & Trade Performance (2019-2025)
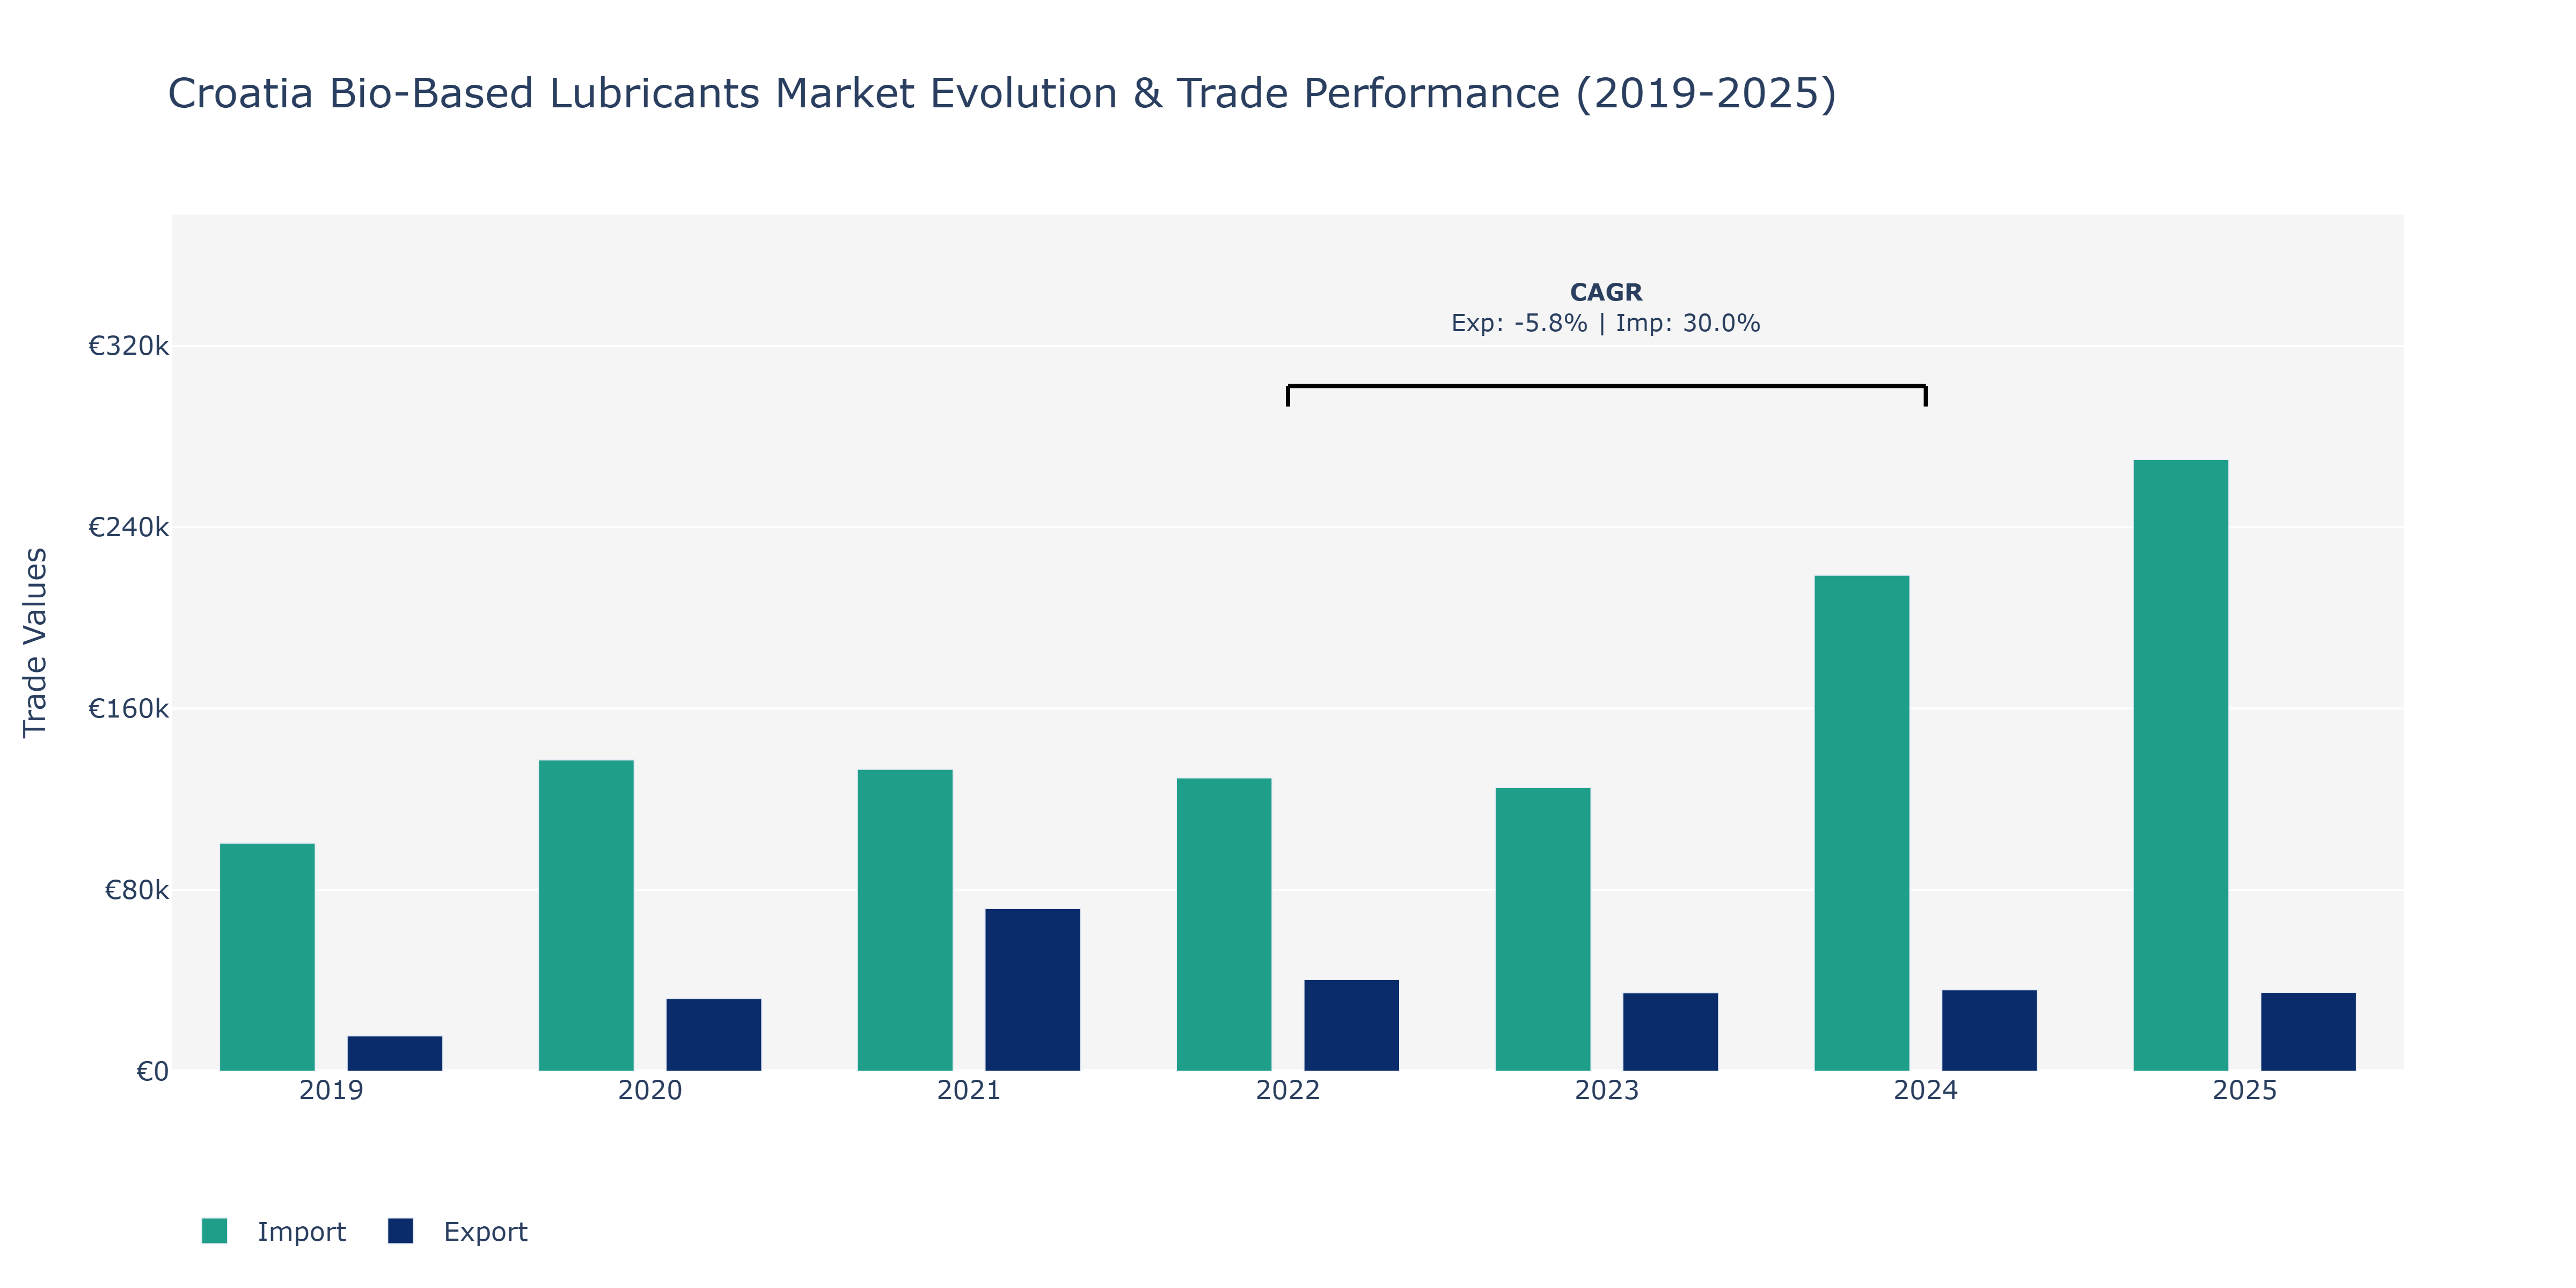
Between 2019 and 2025, Croatia's bio-based lubricants market experienced notable fluctuations in both exports and imports. Exports saw a substantial increase from €15.57 thousand in 2019 to approximately €71.75 thousand in 2021, followed by a decline in the following years, reaching around €34.81 thousand in 2025. In contrast, imports showed a steady upward trend, rising from €100.63 thousand in 2019 to over €269.9 thousand in 2025. The peak in imports in 2025 could be attributed to increased demand for specialized bio-based lubricants in various industries. The fluctuations in exports may be due to changing market dynamics, emerging competitors, or shifts in global demand for bio-based lubricants. Croatia's strategic positioning in the European market and advancements in bio-based technologies could have influenced these dynamics. The contrasting trends between exports and imports showcase the evolving landscape of the bio-based lubricants industry in Croatia.
Key Highlights of the Report:
- Croatia Bio-Based Lubricants Market Outlook
- Market Size of Croatia Bio-Based Lubricants Market, 2025
- Forecast of Croatia Bio-Based Lubricants Market, 2032
- Historical Data and Forecast of Croatia Bio-Based Lubricants Revenues & Volume for the Period 2022 - 2032F
- Croatia Bio-Based Lubricants Market Trend Evolution
- Croatia Bio-Based Lubricants Market Drivers and Challenges
- Croatia Bio-Based Lubricants Price Trends
- Croatia Bio-Based Lubricants Porter's Five Forces
- Croatia Bio-Based Lubricants Industry Life Cycle
- Historical Data and Forecast of Croatia Bio-Based Lubricants Market Revenues & Volume By Lubricant Type for the Period 2022 - 2032F
- Historical Data and Forecast of Croatia Bio-Based Lubricants Market Revenues & Volume By Hydraulic Oils for the Period 2022 - 2032F
- Historical Data and Forecast of Croatia Bio-Based Lubricants Market Revenues & Volume By Gear Oils for the Period 2022 - 2032F
- Historical Data and Forecast of Croatia Bio-Based Lubricants Market Revenues & Volume By Engine Oils for the Period 2022 - 2032F
- Historical Data and Forecast of Croatia Bio-Based Lubricants Market Revenues & Volume By Application for the Period 2022 - 2032F
- Historical Data and Forecast of Croatia Bio-Based Lubricants Market Revenues & Volume By Machinery for the Period 2022 - 2032F
- Historical Data and Forecast of Croatia Bio-Based Lubricants Market Revenues & Volume By Automotives for the Period 2022 - 2032F
- Historical Data and Forecast of Croatia Bio-Based Lubricants Market Revenues & Volume By Marine for the Period 2022 - 2032F
- Historical Data and Forecast of Croatia Bio-Based Lubricants Market Revenues & Volume By End User for the Period 2022 - 2032F
- Historical Data and Forecast of Croatia Bio-Based Lubricants Market Revenues & Volume By Industrial for the Period 2022 - 2032F
- Historical Data and Forecast of Croatia Bio-Based Lubricants Market Revenues & Volume By Automotive for the Period 2022 - 2032F
- Historical Data and Forecast of Croatia Bio-Based Lubricants Market Revenues & Volume By Transportation for the Period 2022 - 2032F
- Historical Data and Forecast of Croatia Bio-Based Lubricants Market Revenues & Volume By Source for the Period 2022 - 2032F
- Historical Data and Forecast of Croatia Bio-Based Lubricants Market Revenues & Volume By Corn-Based for the Period 2022 - 2032F
- Historical Data and Forecast of Croatia Bio-Based Lubricants Market Revenues & Volume By Biomass for the Period 2022 - 2032F
- Historical Data and Forecast of Croatia Bio-Based Lubricants Market Revenues & Volume By Plant-Based for the Period 2022 - 2032F
- Historical Data and Forecast of Croatia Bio-Based Lubricants Market Revenues & Volume By Environmental Impact for the Period 2022 - 2032F
- Historical Data and Forecast of Croatia Bio-Based Lubricants Market Revenues & Volume By Biodegradable for the Period 2022 - 2032F
- Historical Data and Forecast of Croatia Bio-Based Lubricants Market Revenues & Volume By Low Carbon Footprint for the Period 2022 - 2032F
- Historical Data and Forecast of Croatia Bio-Based Lubricants Market Revenues & Volume By Renewable for the Period 2022 - 2032F
- Croatia Bio-Based Lubricants Import Export Trade Statistics
- Market Opportunity Assessment By Lubricant Type
- Market Opportunity Assessment By Application
- Market Opportunity Assessment By End User
- Market Opportunity Assessment By Source
- Market Opportunity Assessment By Environmental Impact
- Croatia Bio-Based Lubricants Top Companies Market Share
- Croatia Bio-Based Lubricants Competitive Benchmarking By Technical and Operational Parameters
- Croatia Bio-Based Lubricants Company Profiles
- Croatia Bio-Based Lubricants Key Strategic Recommendations
Frequently Asked Questions About the Market Study (FAQs):
6Wresearch actively monitors the Croatia Bio-Based Lubricants Market and publishes its comprehensive annual report, highlighting emerging trends, growth drivers, revenue analysis, and forecast outlook. Our insights help businesses to make data-backed strategic decisions with ongoing market dynamics. Our analysts track relevent industries related to the Croatia Bio-Based Lubricants Market, allowing our clients with actionable intelligence and reliable forecasts tailored to emerging regional needs.
Yes, we provide customisation as per your requirements. To learn more, feel free to contact us on sales@6wresearch.com
1 Executive Summary |
2 Introduction |
2.1 Key Highlights of the Report |
2.2 Report Description |
2.3 Market Scope & Segmentation |
2.4 Research Methodology |
2.5 Assumptions |
3 Croatia Bio-Based Lubricants Market Overview |
3.1 Croatia Country Macro Economic Indicators |
3.2 Croatia Bio-Based Lubricants Market Revenues & Volume, 2022 & 2032F |
3.3 Croatia Bio-Based Lubricants Market - Industry Life Cycle |
3.4 Croatia Bio-Based Lubricants Market - Porter's Five Forces |
3.5 Croatia Bio-Based Lubricants Market Revenues & Volume Share, By Lubricant Type, 2022 & 2032F |
3.6 Croatia Bio-Based Lubricants Market Revenues & Volume Share, By Application, 2022 & 2032F |
3.7 Croatia Bio-Based Lubricants Market Revenues & Volume Share, By End User, 2022 & 2032F |
3.8 Croatia Bio-Based Lubricants Market Revenues & Volume Share, By Source, 2022 & 2032F |
3.9 Croatia Bio-Based Lubricants Market Revenues & Volume Share, By Environmental Impact, 2022 & 2032F |
4 Croatia Bio-Based Lubricants Market Dynamics |
4.1 Impact Analysis |
4.2 Market Drivers |
4.2.1 Increasing environmental concerns and regulations favoring the use of bio-based lubricants |
4.2.2 Growing awareness about the benefits of bio-based lubricants in reducing carbon footprint |
4.2.3 Favorable government initiatives promoting the adoption of bio-based products |
4.3 Market Restraints |
4.3.1 Higher initial costs compared to conventional lubricants |
4.3.2 Limited availability and variety of bio-based lubricants in the market |
4.3.3 Resistance from traditional users due to perceived performance differences |
5 Croatia Bio-Based Lubricants Market Trends |
6 Croatia Bio-Based Lubricants Market, By Types |
6.1 Croatia Bio-Based Lubricants Market, By Lubricant Type |
6.1.1 Overview and Analysis |
6.1.2 Croatia Bio-Based Lubricants Market Revenues & Volume, By Lubricant Type, 2022 - 2032F |
6.1.3 Croatia Bio-Based Lubricants Market Revenues & Volume, By Hydraulic Oils, 2022 - 2032F |
6.1.4 Croatia Bio-Based Lubricants Market Revenues & Volume, By Gear Oils, 2022 - 2032F |
6.1.5 Croatia Bio-Based Lubricants Market Revenues & Volume, By Engine Oils, 2022 - 2032F |
6.2 Croatia Bio-Based Lubricants Market, By Application |
6.2.1 Overview and Analysis |
6.2.2 Croatia Bio-Based Lubricants Market Revenues & Volume, By Machinery, 2022 - 2032F |
6.2.3 Croatia Bio-Based Lubricants Market Revenues & Volume, By Automotives, 2022 - 2032F |
6.2.4 Croatia Bio-Based Lubricants Market Revenues & Volume, By Marine, 2022 - 2032F |
6.3 Croatia Bio-Based Lubricants Market, By End User |
6.3.1 Overview and Analysis |
6.3.2 Croatia Bio-Based Lubricants Market Revenues & Volume, By Industrial, 2022 - 2032F |
6.3.3 Croatia Bio-Based Lubricants Market Revenues & Volume, By Automotive, 2022 - 2032F |
6.3.4 Croatia Bio-Based Lubricants Market Revenues & Volume, By Transportation, 2022 - 2032F |
6.4 Croatia Bio-Based Lubricants Market, By Source |
6.4.1 Overview and Analysis |
6.4.2 Croatia Bio-Based Lubricants Market Revenues & Volume, By Corn-Based, 2022 - 2032F |
6.4.3 Croatia Bio-Based Lubricants Market Revenues & Volume, By Biomass, 2022 - 2032F |
6.4.4 Croatia Bio-Based Lubricants Market Revenues & Volume, By Plant-Based, 2022 - 2032F |
6.5 Croatia Bio-Based Lubricants Market, By Environmental Impact |
6.5.1 Overview and Analysis |
6.5.2 Croatia Bio-Based Lubricants Market Revenues & Volume, By Biodegradable, 2022 - 2032F |
6.5.3 Croatia Bio-Based Lubricants Market Revenues & Volume, By Low Carbon Footprint, 2022 - 2032F |
6.5.4 Croatia Bio-Based Lubricants Market Revenues & Volume, By Renewable, 2022 - 2032F |
7 Croatia Bio-Based Lubricants Market Import-Export Trade Statistics |
7.1 Croatia Bio-Based Lubricants Market Export to Major Countries |
7.2 Croatia Bio-Based Lubricants Market Imports from Major Countries |
8 Croatia Bio-Based Lubricants Market Key Performance Indicators |
8.1 Percentage of companies adopting sustainability practices in their operations |
8.2 Number of new product developments and innovations in the bio-based lubricants sector |
8.3 Amount of government funding or incentives allocated to support the bio-based lubricants industry |
9 Croatia Bio-Based Lubricants Market - Opportunity Assessment |
9.1 Croatia Bio-Based Lubricants Market Opportunity Assessment, By Lubricant Type, 2022 & 2032F |
9.2 Croatia Bio-Based Lubricants Market Opportunity Assessment, By Application, 2022 & 2032F |
9.3 Croatia Bio-Based Lubricants Market Opportunity Assessment, By End User, 2022 & 2032F |
9.4 Croatia Bio-Based Lubricants Market Opportunity Assessment, By Source, 2022 & 2032F |
9.5 Croatia Bio-Based Lubricants Market Opportunity Assessment, By Environmental Impact, 2022 & 2032F |
10 Croatia Bio-Based Lubricants Market - Competitive Landscape |
10.1 Croatia Bio-Based Lubricants Market Revenue Share, By Companies, 2025 |
10.2 Croatia Bio-Based Lubricants Market Competitive Benchmarking, By Operating and Technical Parameters |
11 Company Profiles |
12 Recommendations |
13 Disclaimer |
Global Go To Market Strategy - 2030
Export potential enables firms to identify high-growth global markets with greater confidence by combining advanced trade intelligence with a structured quantitative methodology. The framework analyzes emerging demand trends and country-level import patterns while integrating macroeconomic and trade datasets such as GDP and population forecasts, bilateral import–export flows, tariff structures, elasticity differentials between developed and developing economies, geographic distance, and import demand projections. Using weighted trade values from 2020–2024 as the base period to project country-to-country export potential for 2030, these inputs are operationalized through calculated drivers such as gravity model parameters, tariff impact factors, and projected GDP per-capita growth. Through an analysis of hidden potentials, demand hotspots, and market conditions that are most favorable to success, this method enables firms to focus on target countries, maximize returns, and global expansion with data, backed by accuracy.
By factoring in the projected importer demand gap that is currently unmet and could be potential opportunity, it identifies the potential for the Exporter (Country) among 190 countries, against the general trade analysis, which identifies the biggest importer or exporter.
To discover high-growth global markets and optimize your business strategy:
Click Here
Pricing
- Single User License$ 1,995
- Department License$ 2,400
- Site License$ 3,120
- Global License$ 3,795

Leadership Perspectives from Industry Events
Search
Thought Leadership and Analyst Meet


Our Clients
6WResearch In News
- Doha a strategic location for EV manufacturing hub: IPA Qatar
- Demand for luxury TVs surging in the GCC, says Samsung
- Empowering Growth: The Thriving Journey of Bangladesh’s Cable Industry
- Demand for luxury TVs surging in the GCC, says Samsung
- Video call with a traditional healer? Once unthinkable, it’s now common in South Africa
- Intelligent Buildings To Smooth GCC’s Path To Net Zero
Latest Reports
- Taiwan Airport Wireless Infrastructure Market (2026-2032)
- Vietnam Airport Wireless Infrastructure Market (2026-2032)
- Thailand Airport Wireless Infrastructure Market (2026-2032)
- South Korea Airport Wireless Infrastructure Market (2026-2032)
- Romania Airport Wireless Infrastructure Market (2026-2032)
- Qatar Airport Wireless Infrastructure Market (2026-2032)
- Philippines Airport Wireless Infrastructure Market (2026-2032)
- Japan Airport Wireless Infrastructure Market (2026-2032)
- Taiwan Airport Winter Services Market (2026-2032)
- Vietnam Airport Winter Services Market (2026-2032)
Industry Events and Analyst Meet

HIMTEX 2026

India Refining Summit 2026

India EV Show 2026

EV tech India Expo 2026

Auto Tech Asia 2026
Whitepaper
- Middle East & Africa Commercial Security Market Click here to view more.
- Middle East & Africa Fire Safety Systems & Equipment Market Click here to view more.
- GCC Drone Market Click here to view more.
- Middle East Lighting Fixture Market Click here to view more.
- GCC Physical & Perimeter Security Market Click here to view more.