Croatia Bio Compatible Dental Materials Market (2026-2032) | Industry, Drivers, Competitive, Supply, Trends, Pricing Analysis, Value, Opportunities, Challenges, Strategy, Revenue, Forecast, Investment Trends, Size, Analysis, Consumer Insights, Restraints, Strategic Insights, Companies, Segmentation, Segments, Outlook, Competition, Growth, Share, Demand
Market Forecast By Material Type (Bio-Ceramics, Bio-Polymers, Bio-Metals), By Application (Dental Crowns, Braces, Dental Implants), By End User (Clinics, Orthodontics, Dental Labs), By Source (Biomass, Plant-Based, Sugar-Based), By Environmental Impact (Biodegradable, Non-Toxic, Durable) And Competitive Landscape
| Product Code: ETC11452757 | Publication Date: Apr 2025 | Updated Date: Apr 2026 | Product Type: Market Research Report | |
| Publisher: 6Wresearch | No. of Pages: 65 | No. of Figures: 34 | No. of Tables: 19 | |
Croatia Bio Compatible Dental Materials Market Size (2020-2030)
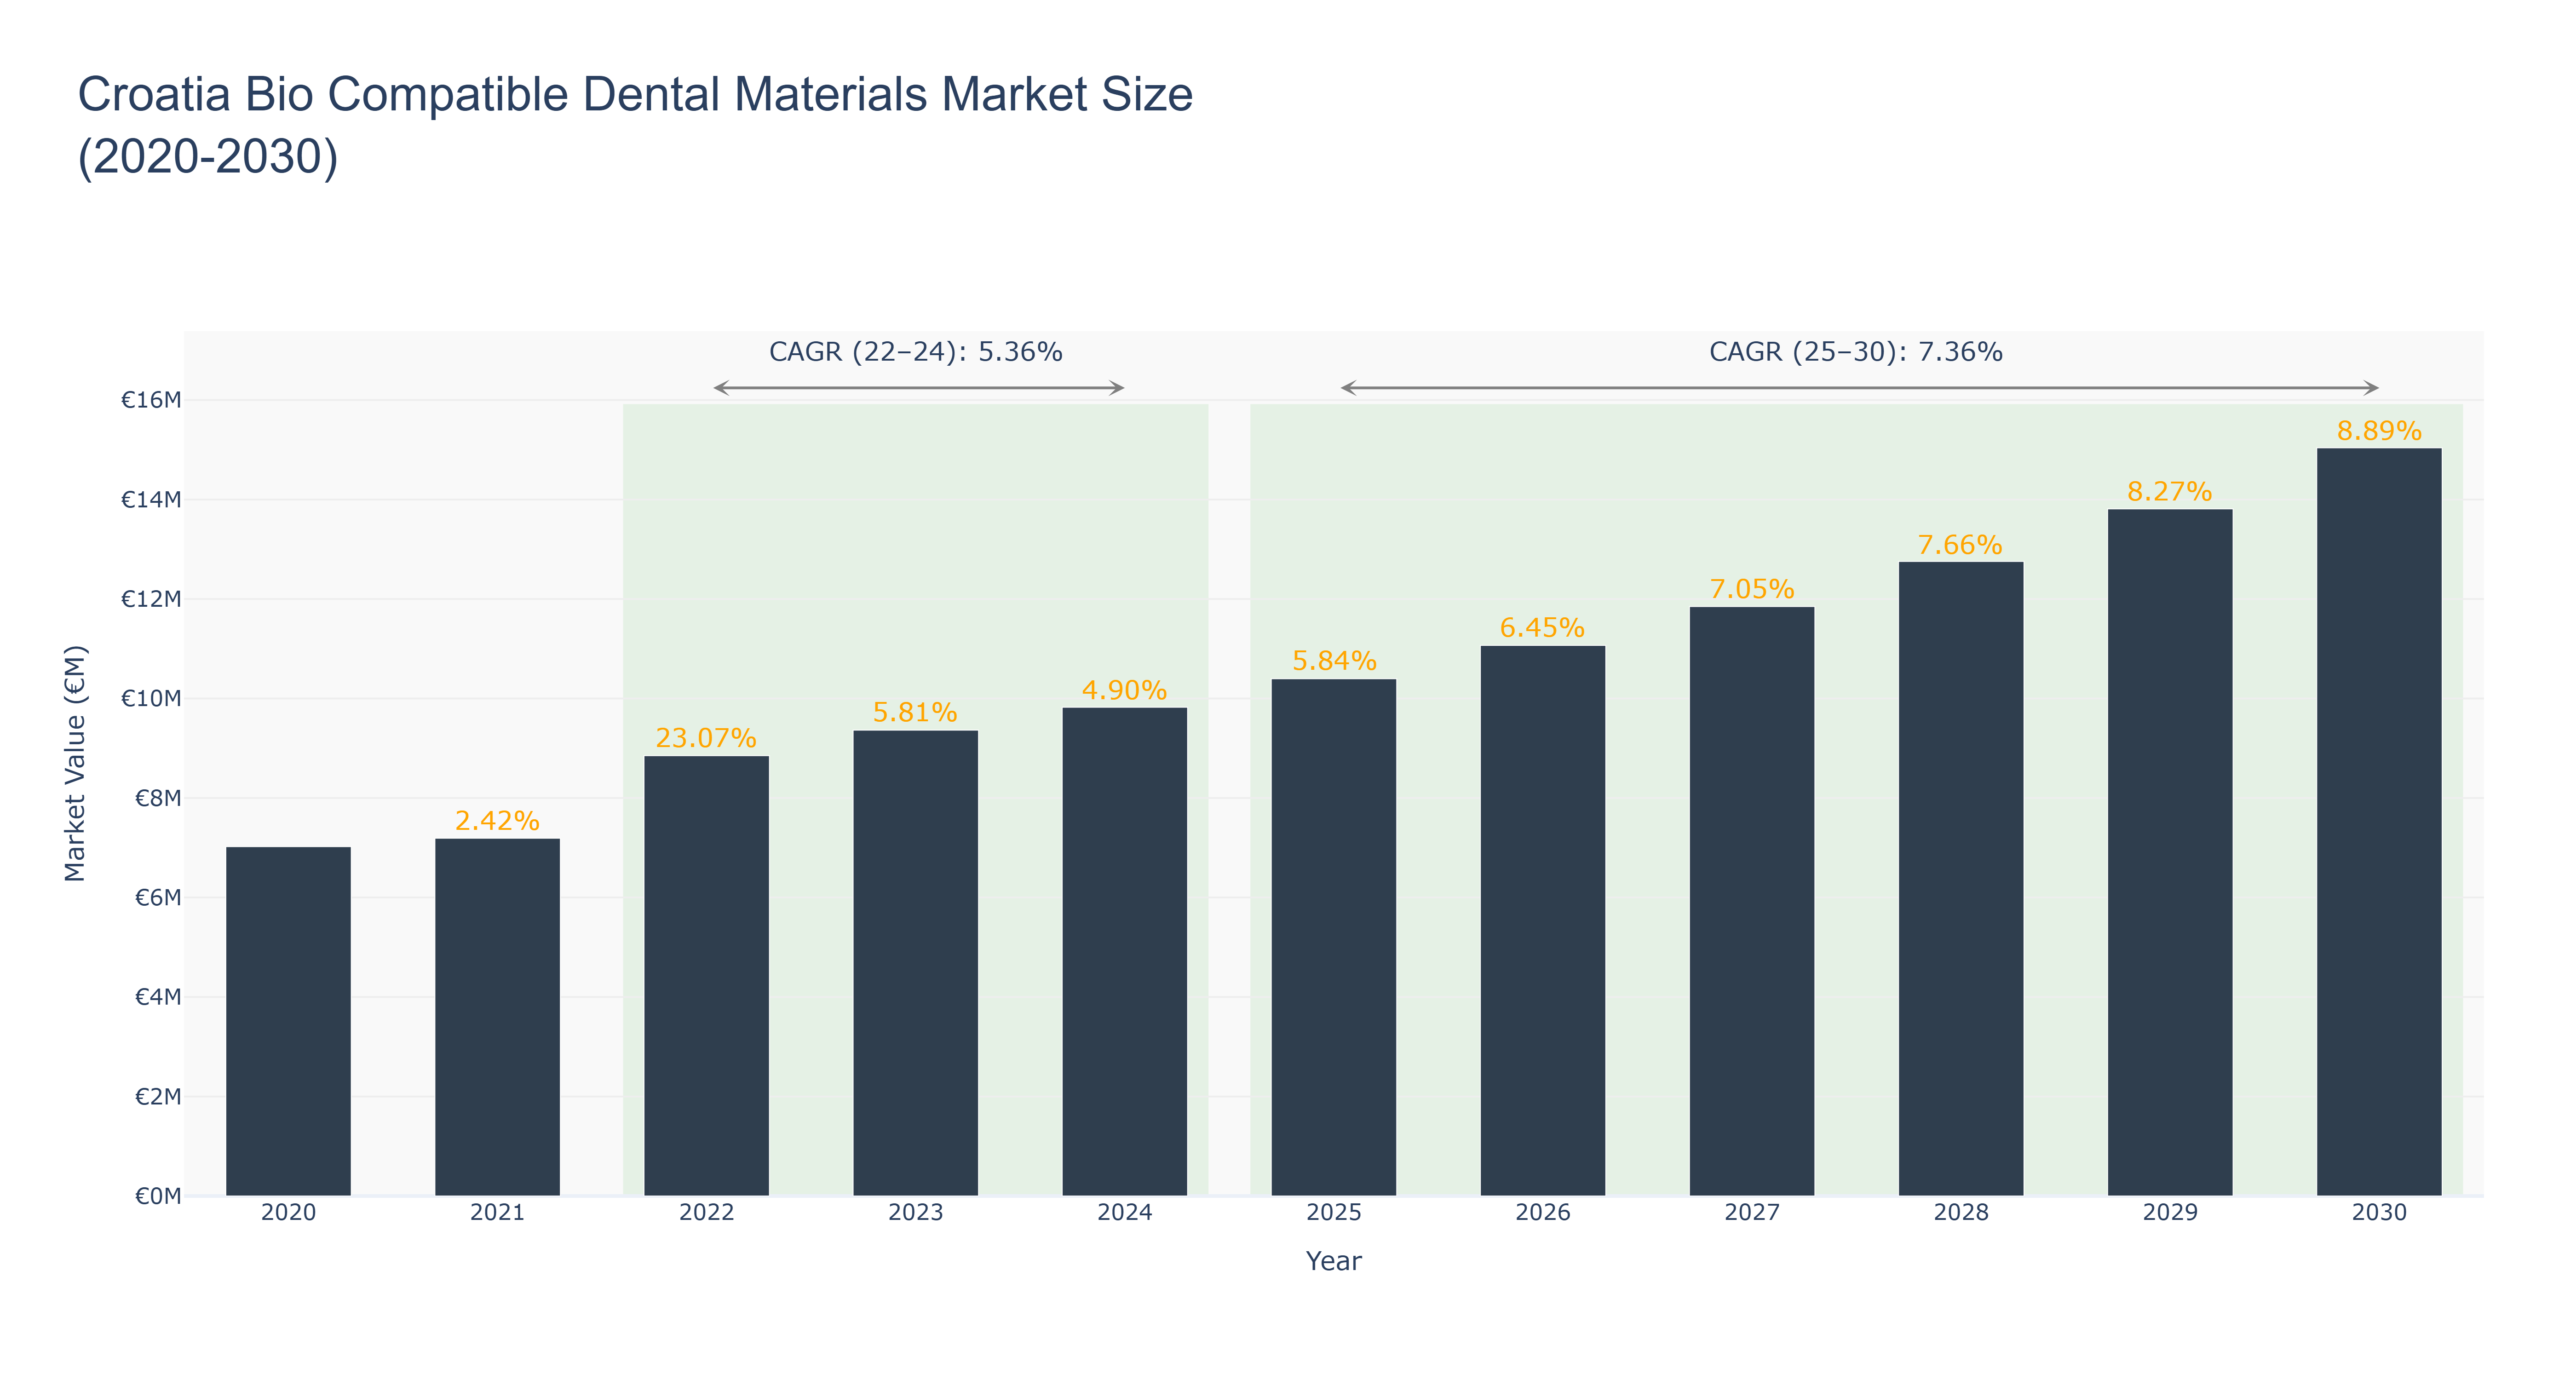
The Croatia Bio Compatible Dental Materials Market experienced significant growth during the 2022-2024 period, peaking with a market size of €9.82 million in 2024, following a remarkable growth rate of 23.07% in 2022. The actual CAGR for this period stands at 5.36%, reflecting increasing demand driven by advancements in dental technology and rising consumer awareness regarding oral health. Looking forward to the forecasted period from 2025 to 2030, the market is projected to grow at a CAGR of 7.36%, reaching €15.04 million by 2030. This growth is anticipated to be fueled by ongoing innovations in biocompatible materials, a greater emphasis on cosmetic dentistry, and an aging population seeking dental solutions. As the market evolves, continued investment in research and development, alongside regulatory advancements, will play a crucial role in shaping the future landscape of the industry.
Croatia Bio Compatible Dental Materials Market: Production & Trade Performance (2019-2025)
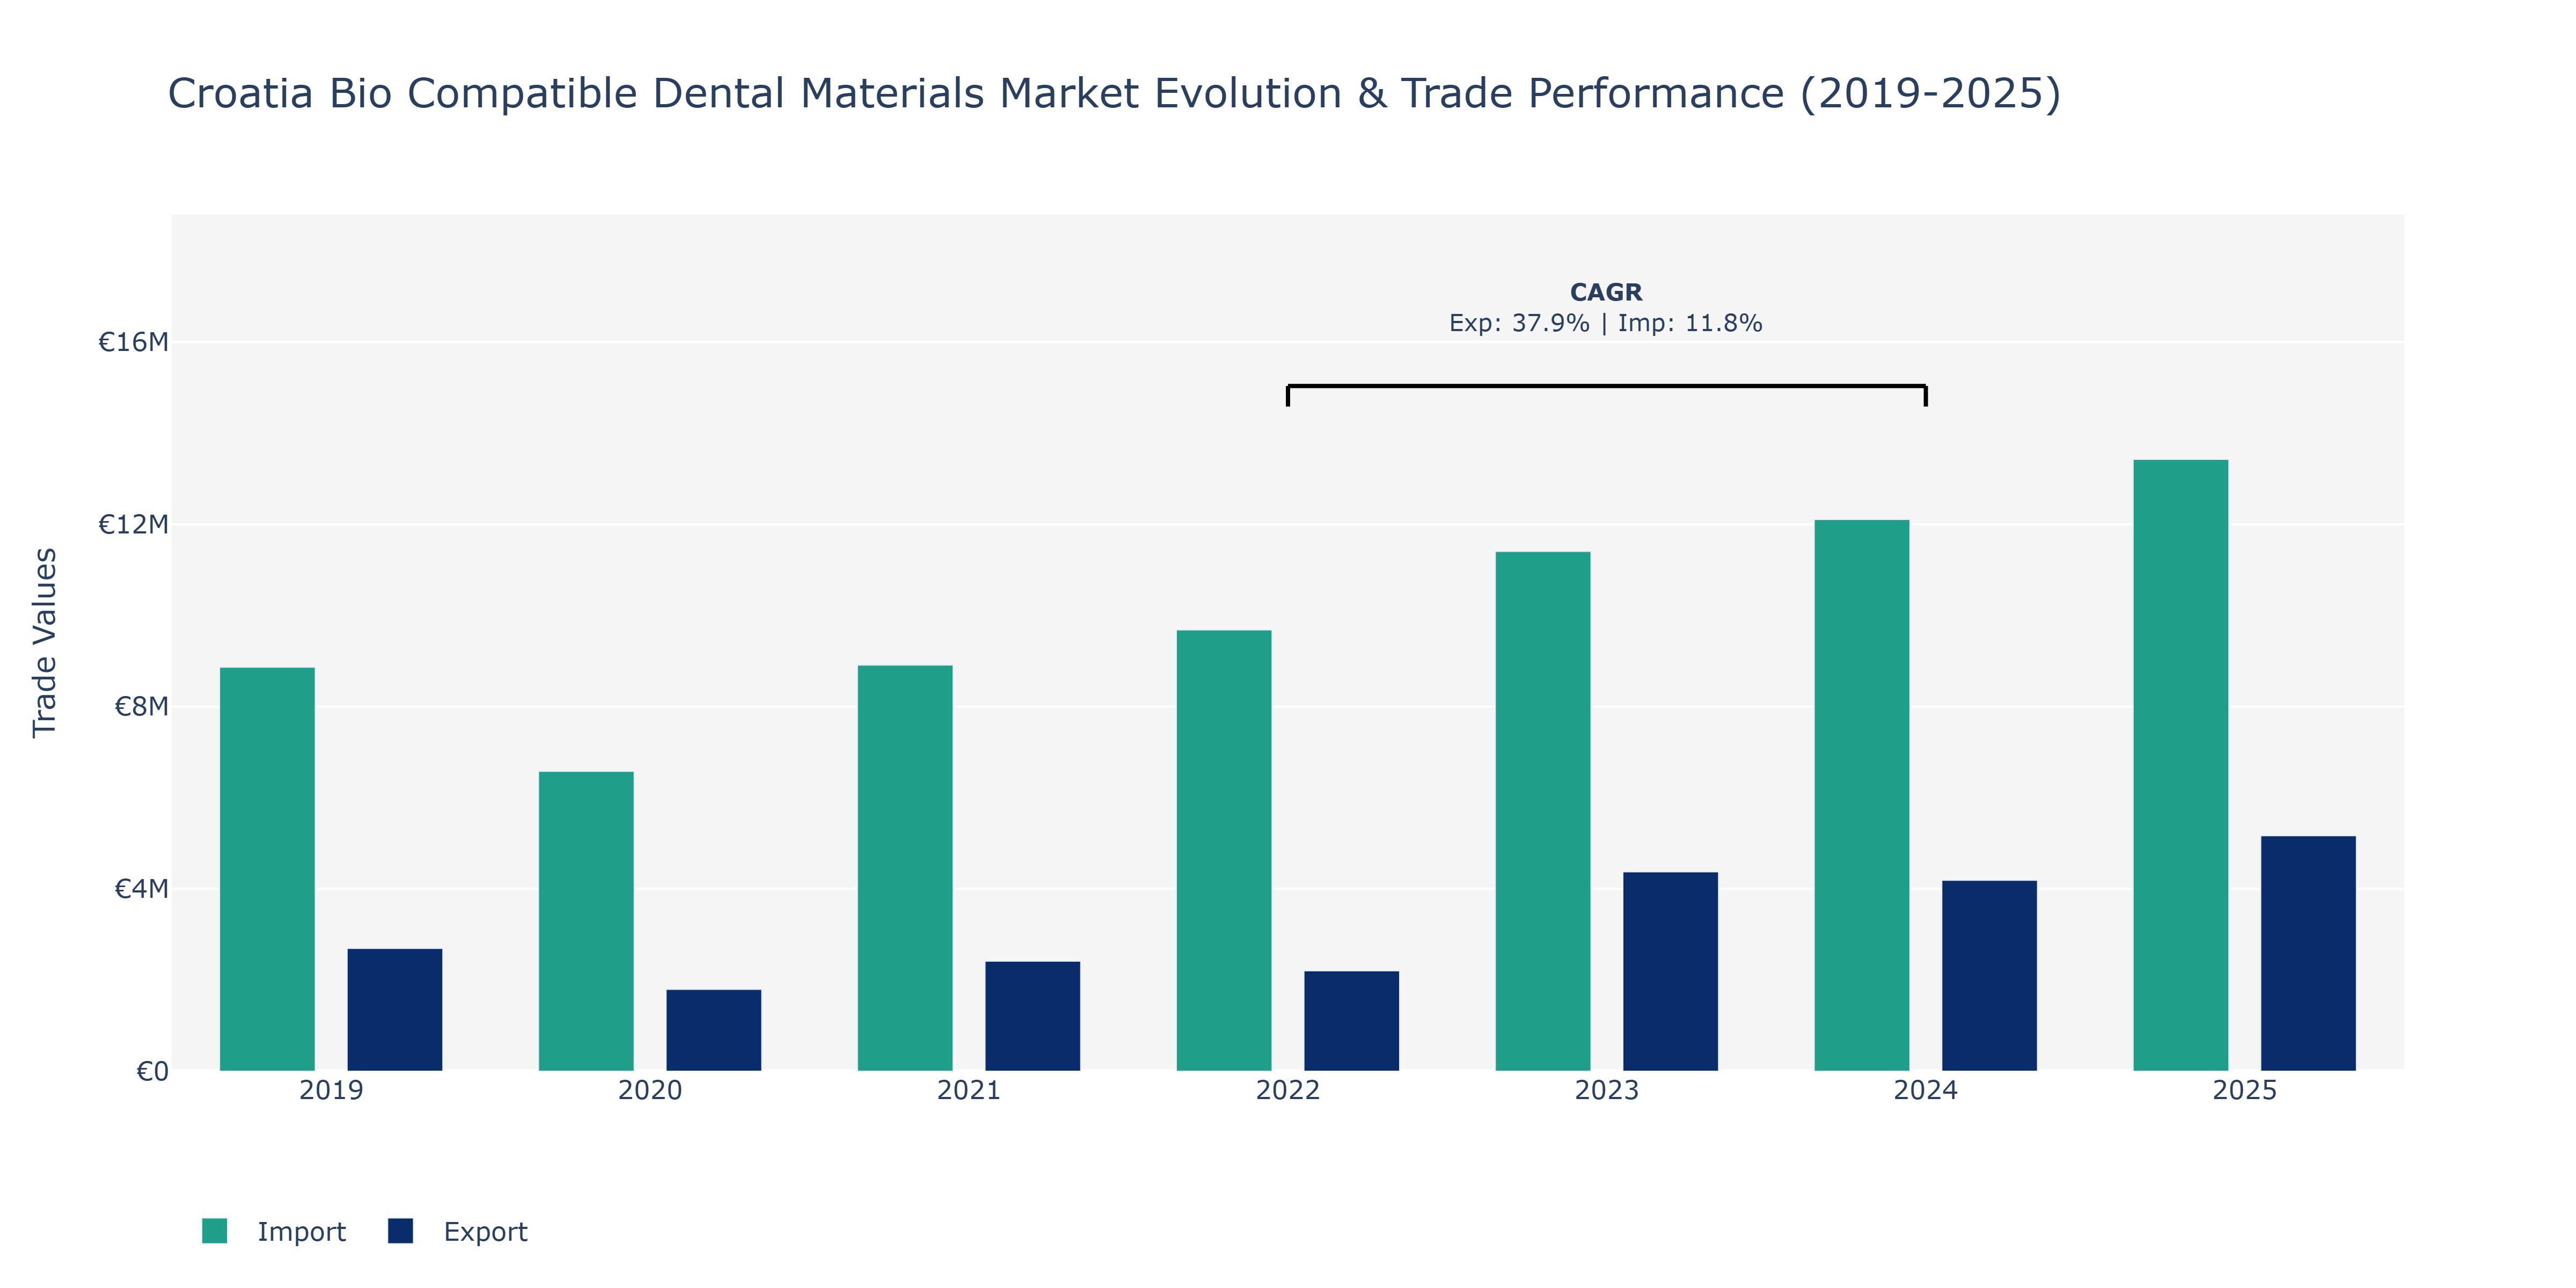
In the Croatia Bio Compatible Dental Materials Market, exports exhibited a fluctuating trend over the observed years. Starting at €2.69 million in 2019, there was a noticeable decline in 2020 to €1.8 million, possibly due to global economic challenges. However, exports rebounded in 2021 and 2022, reaching €2.41 million and €2.2 million, respectively. The peak point was observed in 2025 at approximately €5.17 million, showcasing a substantial increase. This surge could be attributed to enhanced product quality, expanded market reach, and strategic partnerships boosting competitiveness. In contrast, imports followed a more consistent upward trajectory, rising from €8.91 million in 2021 to €13.42 million in 2025, reflecting a growing demand for foreign dental materials within Croatia. This steady increase in imports may indicate the market's reliance on external suppliers for specialized dental products, emphasizing the importance of establishing domestic manufacturing capabilities to reduce dependency and enhance market stability.
Key Highlights of the Report:
- Croatia Bio Compatible Dental Materials Market Outlook
- Market Size of Croatia Bio Compatible Dental Materials Market, 2025
- Forecast of Croatia Bio Compatible Dental Materials Market, 2032
- Historical Data and Forecast of Croatia Bio Compatible Dental Materials Revenues & Volume for the Period 2022 - 2032F
- Croatia Bio Compatible Dental Materials Market Trend Evolution
- Croatia Bio Compatible Dental Materials Market Drivers and Challenges
- Croatia Bio Compatible Dental Materials Price Trends
- Croatia Bio Compatible Dental Materials Porter's Five Forces
- Croatia Bio Compatible Dental Materials Industry Life Cycle
- Historical Data and Forecast of Croatia Bio Compatible Dental Materials Market Revenues & Volume By Material Type for the Period 2022 - 2032F
- Historical Data and Forecast of Croatia Bio Compatible Dental Materials Market Revenues & Volume By Bio-Ceramics for the Period 2022 - 2032F
- Historical Data and Forecast of Croatia Bio Compatible Dental Materials Market Revenues & Volume By Bio-Polymers for the Period 2022 - 2032F
- Historical Data and Forecast of Croatia Bio Compatible Dental Materials Market Revenues & Volume By Bio-Metals for the Period 2022 - 2032F
- Historical Data and Forecast of Croatia Bio Compatible Dental Materials Market Revenues & Volume By Application for the Period 2022 - 2032F
- Historical Data and Forecast of Croatia Bio Compatible Dental Materials Market Revenues & Volume By Dental Crowns for the Period 2022 - 2032F
- Historical Data and Forecast of Croatia Bio Compatible Dental Materials Market Revenues & Volume By Braces for the Period 2022 - 2032F
- Historical Data and Forecast of Croatia Bio Compatible Dental Materials Market Revenues & Volume By Dental Implants for the Period 2022 - 2032F
- Historical Data and Forecast of Croatia Bio Compatible Dental Materials Market Revenues & Volume By End User for the Period 2022 - 2032F
- Historical Data and Forecast of Croatia Bio Compatible Dental Materials Market Revenues & Volume By Clinics for the Period 2022 - 2032F
- Historical Data and Forecast of Croatia Bio Compatible Dental Materials Market Revenues & Volume By Orthodontics for the Period 2022 - 2032F
- Historical Data and Forecast of Croatia Bio Compatible Dental Materials Market Revenues & Volume By Dental Labs for the Period 2022 - 2032F
- Historical Data and Forecast of Croatia Bio Compatible Dental Materials Market Revenues & Volume By Source for the Period 2022 - 2032F
- Historical Data and Forecast of Croatia Bio Compatible Dental Materials Market Revenues & Volume By Biomass for the Period 2022 - 2032F
- Historical Data and Forecast of Croatia Bio Compatible Dental Materials Market Revenues & Volume By Plant-Based for the Period 2022 - 2032F
- Historical Data and Forecast of Croatia Bio Compatible Dental Materials Market Revenues & Volume By Sugar-Based for the Period 2022 - 2032F
- Historical Data and Forecast of Croatia Bio Compatible Dental Materials Market Revenues & Volume By Environmental Impact for the Period 2022 - 2032F
- Historical Data and Forecast of Croatia Bio Compatible Dental Materials Market Revenues & Volume By Biodegradable for the Period 2022 - 2032F
- Historical Data and Forecast of Croatia Bio Compatible Dental Materials Market Revenues & Volume By Non-Toxic for the Period 2022 - 2032F
- Historical Data and Forecast of Croatia Bio Compatible Dental Materials Market Revenues & Volume By Durable for the Period 2022 - 2032F
- Croatia Bio Compatible Dental Materials Import Export Trade Statistics
- Market Opportunity Assessment By Material Type
- Market Opportunity Assessment By Application
- Market Opportunity Assessment By End User
- Market Opportunity Assessment By Source
- Market Opportunity Assessment By Environmental Impact
- Croatia Bio Compatible Dental Materials Top Companies Market Share
- Croatia Bio Compatible Dental Materials Competitive Benchmarking By Technical and Operational Parameters
- Croatia Bio Compatible Dental Materials Company Profiles
- Croatia Bio Compatible Dental Materials Key Strategic Recommendations
Frequently Asked Questions About the Market Study (FAQs):
6Wresearch actively monitors the Croatia Bio Compatible Dental Materials Market and publishes its comprehensive annual report, highlighting emerging trends, growth drivers, revenue analysis, and forecast outlook. Our insights help businesses to make data-backed strategic decisions with ongoing market dynamics. Our analysts track relevent industries related to the Croatia Bio Compatible Dental Materials Market, allowing our clients with actionable intelligence and reliable forecasts tailored to emerging regional needs.
Yes, we provide customisation as per your requirements. To learn more, feel free to contact us on sales@6wresearch.com
1 Executive Summary |
2 Introduction |
2.1 Key Highlights of the Report |
2.2 Report Description |
2.3 Market Scope & Segmentation |
2.4 Research Methodology |
2.5 Assumptions |
3 Croatia Bio Compatible Dental Materials Market Overview |
3.1 Croatia Country Macro Economic Indicators |
3.2 Croatia Bio Compatible Dental Materials Market Revenues & Volume, 2022 & 2032F |
3.3 Croatia Bio Compatible Dental Materials Market - Industry Life Cycle |
3.4 Croatia Bio Compatible Dental Materials Market - Porter's Five Forces |
3.5 Croatia Bio Compatible Dental Materials Market Revenues & Volume Share, By Material Type, 2022 & 2032F |
3.6 Croatia Bio Compatible Dental Materials Market Revenues & Volume Share, By Application, 2022 & 2032F |
3.7 Croatia Bio Compatible Dental Materials Market Revenues & Volume Share, By End User, 2022 & 2032F |
3.8 Croatia Bio Compatible Dental Materials Market Revenues & Volume Share, By Source, 2022 & 2032F |
3.9 Croatia Bio Compatible Dental Materials Market Revenues & Volume Share, By Environmental Impact, 2022 & 2032F |
4 Croatia Bio Compatible Dental Materials Market Dynamics |
4.1 Impact Analysis |
4.2 Market Drivers |
4.2.1 Increasing awareness about the benefits of bio-compatible dental materials |
4.2.2 Growth in the dental tourism industry in Croatia |
4.2.3 Technological advancements in bio-compatible dental materials |
4.3 Market Restraints |
4.3.1 High cost associated with bio-compatible dental materials |
4.3.2 Limited availability of specialized dental professionals trained in handling bio-compatible materials |
5 Croatia Bio Compatible Dental Materials Market Trends |
6 Croatia Bio Compatible Dental Materials Market, By Types |
6.1 Croatia Bio Compatible Dental Materials Market, By Material Type |
6.1.1 Overview and Analysis |
6.1.2 Croatia Bio Compatible Dental Materials Market Revenues & Volume, By Material Type, 2022 - 2032F |
6.1.3 Croatia Bio Compatible Dental Materials Market Revenues & Volume, By Bio-Ceramics, 2022 - 2032F |
6.1.4 Croatia Bio Compatible Dental Materials Market Revenues & Volume, By Bio-Polymers, 2022 - 2032F |
6.1.5 Croatia Bio Compatible Dental Materials Market Revenues & Volume, By Bio-Metals, 2022 - 2032F |
6.2 Croatia Bio Compatible Dental Materials Market, By Application |
6.2.1 Overview and Analysis |
6.2.2 Croatia Bio Compatible Dental Materials Market Revenues & Volume, By Dental Crowns, 2022 - 2032F |
6.2.3 Croatia Bio Compatible Dental Materials Market Revenues & Volume, By Braces, 2022 - 2032F |
6.2.4 Croatia Bio Compatible Dental Materials Market Revenues & Volume, By Dental Implants, 2022 - 2032F |
6.3 Croatia Bio Compatible Dental Materials Market, By End User |
6.3.1 Overview and Analysis |
6.3.2 Croatia Bio Compatible Dental Materials Market Revenues & Volume, By Clinics, 2022 - 2032F |
6.3.3 Croatia Bio Compatible Dental Materials Market Revenues & Volume, By Orthodontics, 2022 - 2032F |
6.3.4 Croatia Bio Compatible Dental Materials Market Revenues & Volume, By Dental Labs, 2022 - 2032F |
6.4 Croatia Bio Compatible Dental Materials Market, By Source |
6.4.1 Overview and Analysis |
6.4.2 Croatia Bio Compatible Dental Materials Market Revenues & Volume, By Biomass, 2022 - 2032F |
6.4.3 Croatia Bio Compatible Dental Materials Market Revenues & Volume, By Plant-Based, 2022 - 2032F |
6.4.4 Croatia Bio Compatible Dental Materials Market Revenues & Volume, By Sugar-Based, 2022 - 2032F |
6.5 Croatia Bio Compatible Dental Materials Market, By Environmental Impact |
6.5.1 Overview and Analysis |
6.5.2 Croatia Bio Compatible Dental Materials Market Revenues & Volume, By Biodegradable, 2022 - 2032F |
6.5.3 Croatia Bio Compatible Dental Materials Market Revenues & Volume, By Non-Toxic, 2022 - 2032F |
6.5.4 Croatia Bio Compatible Dental Materials Market Revenues & Volume, By Durable, 2022 - 2032F |
7 Croatia Bio Compatible Dental Materials Market Import-Export Trade Statistics |
7.1 Croatia Bio Compatible Dental Materials Market Export to Major Countries |
7.2 Croatia Bio Compatible Dental Materials Market Imports from Major Countries |
8 Croatia Bio Compatible Dental Materials Market Key Performance Indicators |
8.1 Number of dental clinics offering bio-compatible materials in Croatia |
8.2 Adoption rate of bio-compatible materials by dental professionals |
8.3 Number of research and development initiatives focused on enhancing bio-compatible dental materials |
9 Croatia Bio Compatible Dental Materials Market - Opportunity Assessment |
9.1 Croatia Bio Compatible Dental Materials Market Opportunity Assessment, By Material Type, 2022 & 2032F |
9.2 Croatia Bio Compatible Dental Materials Market Opportunity Assessment, By Application, 2022 & 2032F |
9.3 Croatia Bio Compatible Dental Materials Market Opportunity Assessment, By End User, 2022 & 2032F |
9.4 Croatia Bio Compatible Dental Materials Market Opportunity Assessment, By Source, 2022 & 2032F |
9.5 Croatia Bio Compatible Dental Materials Market Opportunity Assessment, By Environmental Impact, 2022 & 2032F |
10 Croatia Bio Compatible Dental Materials Market - Competitive Landscape |
10.1 Croatia Bio Compatible Dental Materials Market Revenue Share, By Companies, 2025 |
10.2 Croatia Bio Compatible Dental Materials Market Competitive Benchmarking, By Operating and Technical Parameters |
11 Company Profiles |
12 Recommendations |
13 Disclaimer |
Export potential assessment - trade Analytics for 2030
Export potential enables firms to identify high-growth global markets with greater confidence by combining advanced trade intelligence with a structured quantitative methodology. The framework analyzes emerging demand trends and country-level import patterns while integrating macroeconomic and trade datasets such as GDP and population forecasts, bilateral import–export flows, tariff structures, elasticity differentials between developed and developing economies, geographic distance, and import demand projections. Using weighted trade values from 2020–2024 as the base period to project country-to-country export potential for 2030, these inputs are operationalized through calculated drivers such as gravity model parameters, tariff impact factors, and projected GDP per-capita growth. Through an analysis of hidden potentials, demand hotspots, and market conditions that are most favorable to success, this method enables firms to focus on target countries, maximize returns, and global expansion with data, backed by accuracy.
By factoring in the projected importer demand gap that is currently unmet and could be potential opportunity, it identifies the potential for the Exporter (Country) among 190 countries, against the general trade analysis, which identifies the biggest importer or exporter.
To discover high-growth global markets and optimize your business strategy:
Click Here
Pricing
- Single User License$ 1,995
- Department License$ 2,400
- Site License$ 3,120
- Global License$ 3,795

Search
Thought Leadership and Analyst Meet


Our Clients
Latest Reports
- Canada Cloud CFD Market (2026-2032) | Size & Revenue, Industry, Growth, Competitive Landscape, Forecast, Segmentation, Value, Outlook, Trends, Share, Analysis, Companies
- Taiwan Food Delivery Platform Market (2026-2032) | Companies, Outlook, Analysis, Trends, Value, Revenue, Segmentation, Share, Forecast, Competitive Landscape, Growth, Size & Forecast
- United Kingdom (UK) Long-term Care Insurance Market (2026-2032) | Growth, Share, Consumer Insights, Drivers, Opportunities, Competition, Pricing Analysis, Segments, Restraints, Companies, Competitive, Value, Outlook, Size, Demand, Analysis, Challenges, Strategic Insights, Investment Trends, Revenue, Trends, Supply, Forecast
- United Kingdom (UK) Long Term Care Market (2026-2032) | Companies, Outlook, Analysis, Trends, Value, Revenue, Segmentation, Share, Forecast, Competitive Landscape, Growth, Size & Forecast
- Iraq Insulation and Waterproofing Market (2026-2032) | Outlook, Drivers, Growth, Size, Share, Industry, Revenue, Trends, Demand, Competitive, Strategic Insights, Opportunities, Segments, Companies, Challenges, Strategy, Consumer Insights, Analysis, Investment Trends, Value, Segmentation, Forecast, Restraints
- India Switchgear Market Outlook (2026-2032) | Size, Share, Trends, Growth, Revenue, Forecast, Analysis, Value, Outlook
- Pakistan Contraceptive Implants Market (2025-2031) | Demand, Growth, Size, Share, Industry, Pricing Analysis, Competitive, Strategic Insights, Strategy, Consumer Insights, Analysis, Investment Trends, Opportunities, Revenue, Segments, Value, Segmentation, Supply, Forecast, Restraints, Outlook, Competition, Drivers, Trends, Companies, Challenges
- Sri Lanka Packaging Market (2026-2032) | Outlook, Competition, Drivers, Trends, Demand, Pricing Analysis, Competitive, Strategic Insights, Companies, Challenges, Strategy, Consumer Insights, Analysis, Investment Trends, Opportunities, Growth, Size, Share, Industry, Revenue, Segments, Value, Segmentation, Supply, Forecast, Restraints
- India Kids Watches Market (2026-2032) | Strategy, Consumer Insights, Analysis, Investment Trends, Opportunities, Growth, Size, Share, Industry, Revenue, Segments, Value, Segmentation, Supply, Forecast, Restraints, Outlook, Competition, Drivers, Trends, Demand, Pricing Analysis, Competitive, Strategic Insights, Companies, Challenges
- Saudi Arabia Core Assurance Service Market (2025-2031) | Strategy, Consumer Insights, Analysis, Investment Trends, Opportunities, Growth, Size, Share, Industry, Revenue, Segments, Value, Segmentation, Supply, Forecast, Restraints, Outlook, Competition, Drivers, Trends, Demand, Pricing Analysis, Competitive, Strategic Insights, Companies, Challenges
Industry Events and Analyst Meet

India EV Show 2026

EV tech India Expo 2026

Auto Tech Asia 2026

Battery Tech India 2026

Smart Production Solutions Guangzhou 2026
Whitepaper
- Middle East & Africa Commercial Security Market Click here to view more.
- Middle East & Africa Fire Safety Systems & Equipment Market Click here to view more.
- GCC Drone Market Click here to view more.
- Middle East Lighting Fixture Market Click here to view more.
- GCC Physical & Perimeter Security Market Click here to view more.
6WResearch In News
- Doha a strategic location for EV manufacturing hub: IPA Qatar
- Demand for luxury TVs surging in the GCC, says Samsung
- Empowering Growth: The Thriving Journey of Bangladesh’s Cable Industry
- Demand for luxury TVs surging in the GCC, says Samsung
- Video call with a traditional healer? Once unthinkable, it’s now common in South Africa
- Intelligent Buildings To Smooth GCC’s Path To Net Zero