Croatia Bio Plasticizer Market (2026-2032) | Value, Revenue, Growth, Outlook, Size, Share, Forecast, Analysis, Industry, Segmentation, Trends & Companies
Market Forecast By Type (Sebacates, Succinic Acid, Citrates, Glycerol Esters, Others, Epoxides), By Application (Flooring and Walls, Film and Sheet Coverings, Wires and Cables, Coated Fabrics, Consumer Goods, Others) And Competitive Landscape
| Product Code: ETC5667266 | Publication Date: Nov 2023 | Updated Date: Apr 2026 | Product Type: Market Research Report | |
| Publisher: 6Wresearch | Author: Ravi Bhandari | No. of Pages: 60 | No. of Figures: 30 | No. of Tables: 5 |
Croatia Bio Plasticizer Market Size (2020-2030)
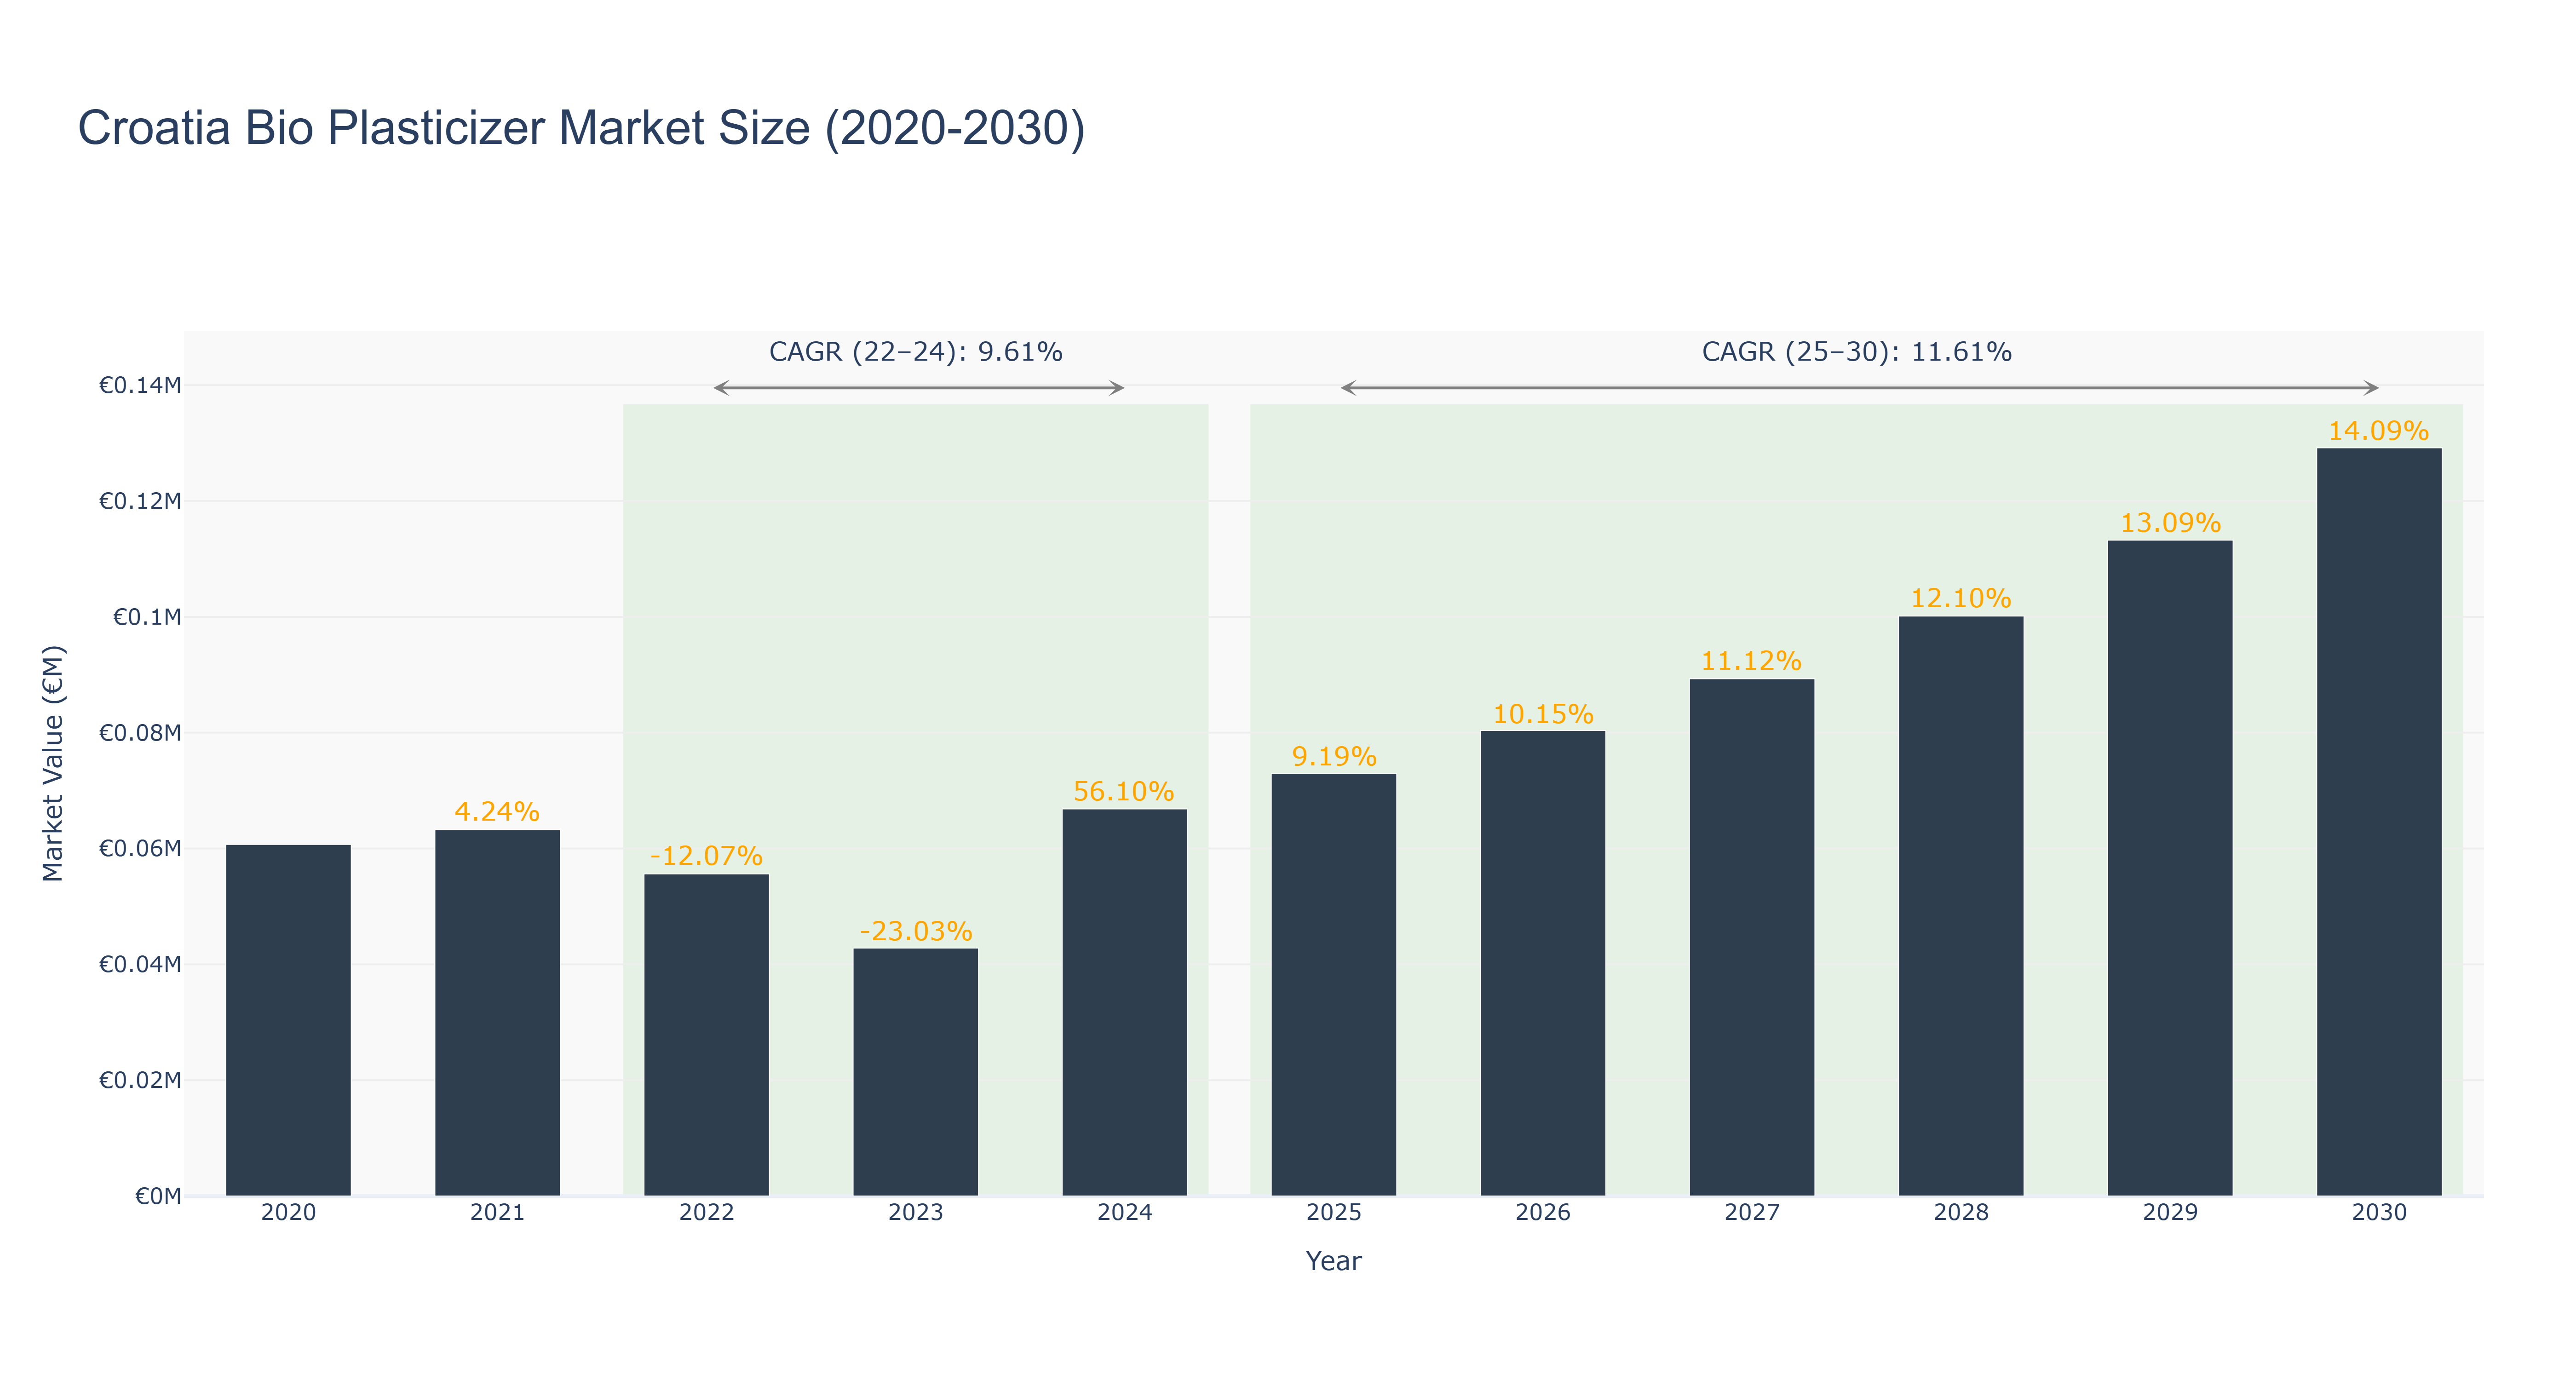
Croatia Bio Plasticizer Market has shown a fluctuating trend in recent years. The peak market size of €0.13 million is projected for 2030, with a steady growth trajectory. From 2020 to 2024, the market size remained stable at €0.06 million, witnessing a significant spike in 2024 to €0.07 million, attributed to increased demand and technological advancements. The subsequent years from 2025 to 2030 are forecasted to experience steady growth, with a CAGR of 11.61% post-2025. Industry drivers such as the shift towards sustainable practices and regulations promoting eco-friendly solutions are propelling market expansion. Looking ahead, upcoming projects in Croatia include collaborations with research institutions to develop innovative bio-based plasticizer solutions, indicating a promising future for the bio plasticizer market in the country.
Croatia Bio Plasticizer Market: Production & Trade Performance (2019-2025)
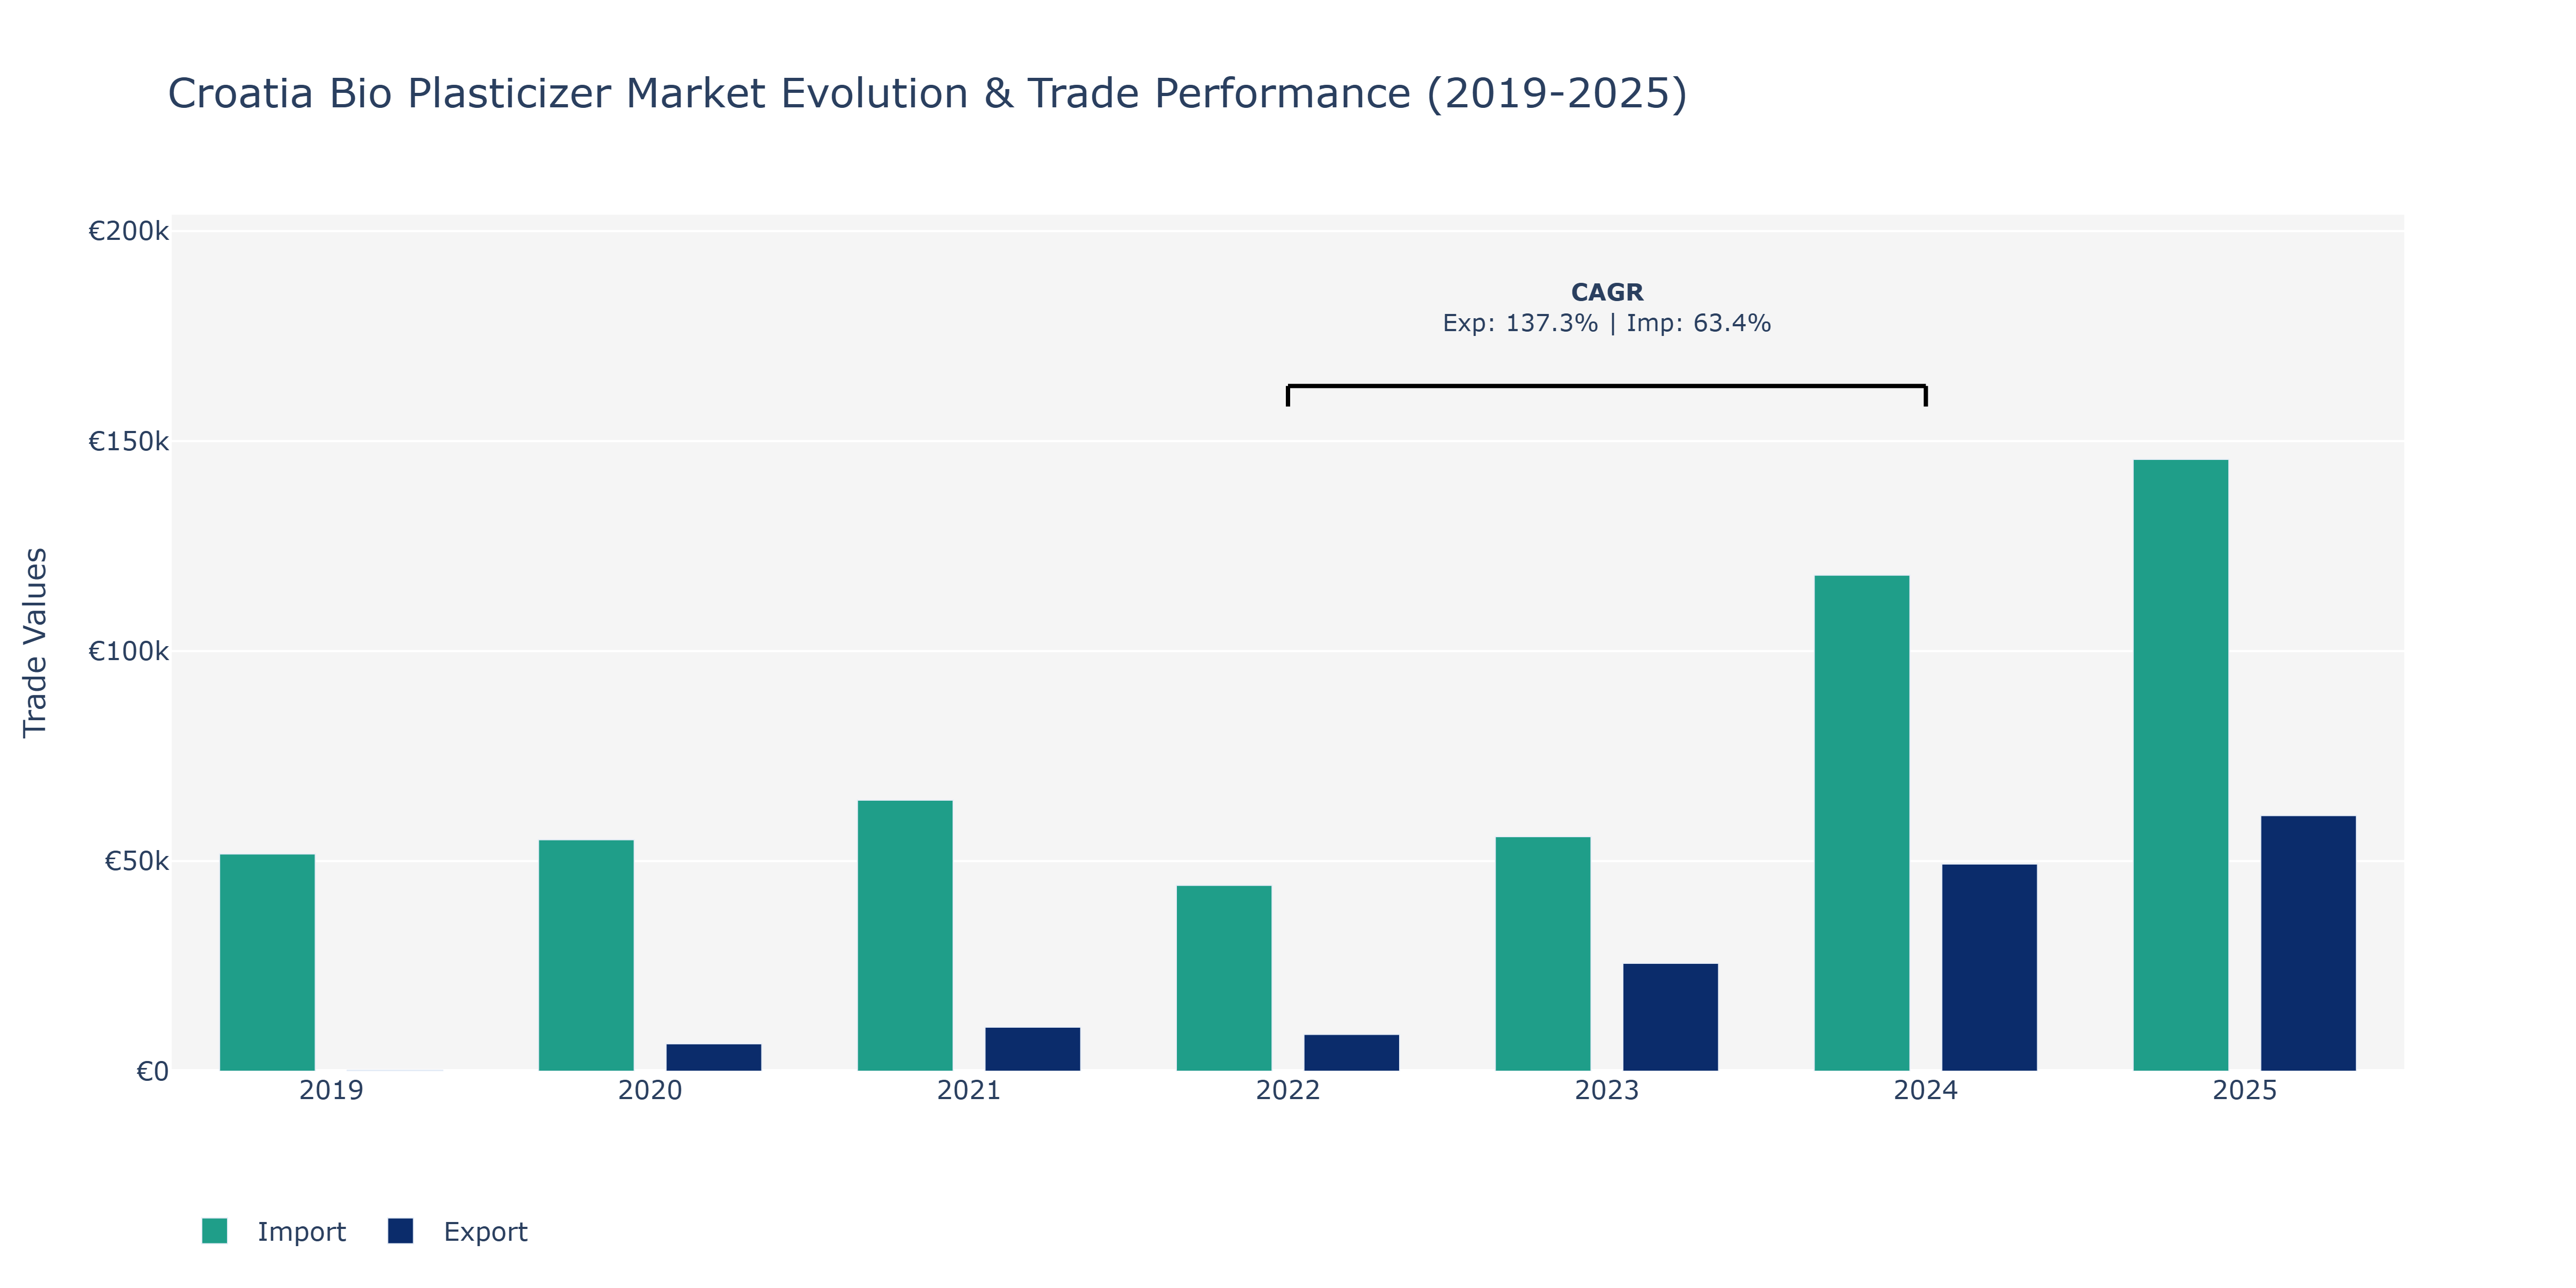
In the Croatia Bio Plasticizer Market, exports and imports demonstrate distinct patterns from 2019 to 2025. Exports surged from €260 in 2019 to €60.84 thousand in 2025, showcasing a substantial upward trajectory with notable peaks in 2024 and 2025. Conversely, imports rose steadily from €51.71 thousand in 2019 to €145.63 thousand in 2025, indicating consistent growth, albeit with fluctuations. The market witnessed a remarkable increase in exports in 2024 and 2025, likely driven by the growing global demand for eco-friendly plasticizer alternatives. Meanwhile, the fluctuations in imports suggest shifts in supply chains, possibly influenced by changes in raw material costs or trade policies. The market's robust performance aligns with the increasing focus on sustainable practices in the plastics industry and the rising awareness regarding environmental concerns, driving both export and import activities in the bio plasticizer sector.
Key Highlights of the Report:
- Croatia Bio Plasticizer Market Outlook
- Market Size of Croatia Bio Plasticizer Market, 2025
- Forecast of Croatia Bio Plasticizer Market, 2032
- Historical Data and Forecast of Croatia Bio Plasticizer Revenues & Volume for the Period 2022 - 2032F
- Croatia Bio Plasticizer Market Trend Evolution
- Croatia Bio Plasticizer Market Drivers and Challenges
- Croatia Bio Plasticizer Price Trends
- Croatia Bio Plasticizer Porter`s Five Forces
- Croatia Bio Plasticizer Industry Life Cycle
- Historical Data and Forecast of Croatia Bio Plasticizer Market Revenues & Volume By Type for the Period 2022 - 2032F
- Historical Data and Forecast of Croatia Bio Plasticizer Market Revenues & Volume By Sebacates for the Period 2022 - 2032F
- Historical Data and Forecast of Croatia Bio Plasticizer Market Revenues & Volume By Succinic Acid for the Period 2022 - 2032F
- Historical Data and Forecast of Croatia Bio Plasticizer Market Revenues & Volume By Citrates for the Period 2022 - 2032F
- Historical Data and Forecast of Croatia Bio Plasticizer Market Revenues & Volume By Glycerol Esters for the Period 2022 - 2032F
- Historical Data and Forecast of Croatia Bio Plasticizer Market Revenues & Volume By Others for the Period 2022 - 2032F
- Historical Data and Forecast of Croatia Bio Plasticizer Market Revenues & Volume By Epoxides for the Period 2022 - 2032F
- Historical Data and Forecast of Croatia Bio Plasticizer Market Revenues & Volume By Application for the Period 2022 - 2032F
- Historical Data and Forecast of Croatia Bio Plasticizer Market Revenues & Volume By Flooring and Walls for the Period 2022 - 2032F
- Historical Data and Forecast of Croatia Bio Plasticizer Market Revenues & Volume By Film and Sheet Coverings for the Period 2022 - 2032F
- Historical Data and Forecast of Croatia Bio Plasticizer Market Revenues & Volume By Wires and Cables for the Period 2022 - 2032F
- Historical Data and Forecast of Croatia Bio Plasticizer Market Revenues & Volume By Coated Fabrics for the Period 2022 - 2032F
- Historical Data and Forecast of Croatia Bio Plasticizer Market Revenues & Volume By Consumer Goods for the Period 2022 - 2032F
- Historical Data and Forecast of Croatia Bio Plasticizer Market Revenues & Volume By Others for the Period 2022 - 2032F
- Croatia Bio Plasticizer Import Export Trade Statistics
- Market Opportunity Assessment By Type
- Market Opportunity Assessment By Application
- Croatia Bio Plasticizer Top Companies Market Share
- Croatia Bio Plasticizer Competitive Benchmarking By Technical and Operational Parameters
- Croatia Bio Plasticizer Company Profiles
- Croatia Bio Plasticizer Key Strategic Recommendations
Frequently Asked Questions About the Market Study (FAQs):
6Wresearch actively monitors the Croatia Bio Plasticizer Market and publishes its comprehensive annual report, highlighting emerging trends, growth drivers, revenue analysis, and forecast outlook. Our insights help businesses to make data-backed strategic decisions with ongoing market dynamics. Our analysts track relevent industries related to the Croatia Bio Plasticizer Market, allowing our clients with actionable intelligence and reliable forecasts tailored to emerging regional needs.
Yes, we provide customisation as per your requirements. To learn more, feel free to contact us on sales@6wresearch.com
1 Executive Summary |
2 Introduction |
2.1 Key Highlights of the Report |
2.2 Report Description |
2.3 Market Scope & Segmentation |
2.4 Research Methodology |
2.5 Assumptions |
3 Croatia Bio Plasticizer Market Overview |
3.1 Croatia Country Macro Economic Indicators |
3.2 Croatia Bio Plasticizer Market Revenues & Volume, 2022 & 2032F |
3.3 Croatia Bio Plasticizer Market - Industry Life Cycle |
3.4 Croatia Bio Plasticizer Market - Porter's Five Forces |
3.5 Croatia Bio Plasticizer Market Revenues & Volume Share, By Type, 2022 & 2032F |
3.6 Croatia Bio Plasticizer Market Revenues & Volume Share, By Application, 2022 & 2032F |
4 Croatia Bio Plasticizer Market Dynamics |
4.1 Impact Analysis |
4.2 Market Drivers |
4.2.1 Increasing environmental awareness leading to a shift towards sustainable and eco-friendly products. |
4.2.2 Stringent regulations promoting the use of bio-based plasticizers over conventional ones. |
4.2.3 Growing demand from end-user industries such as packaging, construction, and automotive for bio plasticizers. |
4.3 Market Restraints |
4.3.1 Higher production costs associated with bio plasticizers compared to conventional plasticizers. |
4.3.2 Limited availability of raw materials for bio plasticizer production. |
4.3.3 Lack of awareness and understanding among consumers and industries about the benefits of bio plasticizers. |
5 Croatia Bio Plasticizer Market Trends |
6 Croatia Bio Plasticizer Market Segmentations |
6.1 Croatia Bio Plasticizer Market, By Type |
6.1.1 Overview and Analysis |
6.1.2 Croatia Bio Plasticizer Market Revenues & Volume, By Sebacates, 2022 - 2032F |
6.1.3 Croatia Bio Plasticizer Market Revenues & Volume, By Succinic Acid, 2022 - 2032F |
6.1.4 Croatia Bio Plasticizer Market Revenues & Volume, By Citrates, 2022 - 2032F |
6.1.5 Croatia Bio Plasticizer Market Revenues & Volume, By Glycerol Esters, 2022 - 2032F |
6.1.6 Croatia Bio Plasticizer Market Revenues & Volume, By Others, 2022 - 2032F |
6.1.7 Croatia Bio Plasticizer Market Revenues & Volume, By Epoxides, 2022 - 2032F |
6.2 Croatia Bio Plasticizer Market, By Application |
6.2.1 Overview and Analysis |
6.2.2 Croatia Bio Plasticizer Market Revenues & Volume, By Flooring and Walls, 2022 - 2032F |
6.2.3 Croatia Bio Plasticizer Market Revenues & Volume, By Film and Sheet Coverings, 2022 - 2032F |
6.2.4 Croatia Bio Plasticizer Market Revenues & Volume, By Wires and Cables, 2022 - 2032F |
6.2.5 Croatia Bio Plasticizer Market Revenues & Volume, By Coated Fabrics, 2022 - 2032F |
6.2.6 Croatia Bio Plasticizer Market Revenues & Volume, By Consumer Goods, 2022 - 2032F |
6.2.7 Croatia Bio Plasticizer Market Revenues & Volume, By Others, 2022 - 2032F |
7 Croatia Bio Plasticizer Market Import-Export Trade Statistics |
7.1 Croatia Bio Plasticizer Market Export to Major Countries |
7.2 Croatia Bio Plasticizer Market Imports from Major Countries |
8 Croatia Bio Plasticizer Market Key Performance Indicators |
8.1 Proportion of companies in the plasticizer industry incorporating bio-based materials in their products. |
8.2 Percentage increase in research and development investments in bio plasticizer technologies. |
8.3 Number of new product launches or innovations in the bio plasticizer segment. |
8.4 Carbon footprint reduction achieved by the adoption of bio plasticizers in Croatia. |
8.5 Growth in the number of partnerships between bio plasticizer manufacturers and end-user industries. |
9 Croatia Bio Plasticizer Market - Opportunity Assessment |
9.1 Croatia Bio Plasticizer Market Opportunity Assessment, By Type, 2022 & 2032F |
9.2 Croatia Bio Plasticizer Market Opportunity Assessment, By Application, 2022 & 2032F |
10 Croatia Bio Plasticizer Market - Competitive Landscape |
10.1 Croatia Bio Plasticizer Market Revenue Share, By Companies, 2025 |
10.2 Croatia Bio Plasticizer Market Competitive Benchmarking, By Operating and Technical Parameters |
11 Company Profiles |
12 Recommendations | 13 Disclaimer |
Global Go To Market Strategy - 2030
Export potential enables firms to identify high-growth global markets with greater confidence by combining advanced trade intelligence with a structured quantitative methodology. The framework analyzes emerging demand trends and country-level import patterns while integrating macroeconomic and trade datasets such as GDP and population forecasts, bilateral import–export flows, tariff structures, elasticity differentials between developed and developing economies, geographic distance, and import demand projections. Using weighted trade values from 2020–2024 as the base period to project country-to-country export potential for 2030, these inputs are operationalized through calculated drivers such as gravity model parameters, tariff impact factors, and projected GDP per-capita growth. Through an analysis of hidden potentials, demand hotspots, and market conditions that are most favorable to success, this method enables firms to focus on target countries, maximize returns, and global expansion with data, backed by accuracy.
By factoring in the projected importer demand gap that is currently unmet and could be potential opportunity, it identifies the potential for the Exporter (Country) among 190 countries, against the general trade analysis, which identifies the biggest importer or exporter.
To discover high-growth global markets and optimize your business strategy:
Click Here
Pricing
- Single User License$ 1,995
- Department License$ 2,400
- Site License$ 3,120
- Global License$ 3,795

Leadership Perspectives from Industry Events
Search
Thought Leadership and Analyst Meet


Our Clients
6WResearch In News
- Doha a strategic location for EV manufacturing hub: IPA Qatar
- Demand for luxury TVs surging in the GCC, says Samsung
- Empowering Growth: The Thriving Journey of Bangladesh’s Cable Industry
- Demand for luxury TVs surging in the GCC, says Samsung
- Video call with a traditional healer? Once unthinkable, it’s now common in South Africa
- Intelligent Buildings To Smooth GCC’s Path To Net Zero
Latest Reports
- New Zealand Aseptic Manufacturing Market (2026-2032)
- Netherlands Aseptic Manufacturing Market (2026-2032)
- Nauru Aseptic Manufacturing Market (2026-2032)
- Namibia Aseptic Manufacturing Market (2026-2032)
- Mozambique Aseptic Manufacturing Market (2026-2032)
- Montenegro Aseptic Manufacturing Market (2026-2032)
- Mongolia Aseptic Manufacturing Market (2026-2032)
- Monaco Aseptic Manufacturing Market (2026-2032)
- Micronesia Aseptic Manufacturing Market (2026-2032)
- Mauritius Aseptic Manufacturing Market (2026-2032)
Industry Events and Analyst Meet

HIMTEX 2026

India Refining Summit 2026

India EV Show 2026

EV tech India Expo 2026

Auto Tech Asia 2026
Whitepaper
- Middle East & Africa Commercial Security Market Click here to view more.
- Middle East & Africa Fire Safety Systems & Equipment Market Click here to view more.
- GCC Drone Market Click here to view more.
- Middle East Lighting Fixture Market Click here to view more.
- GCC Physical & Perimeter Security Market Click here to view more.