Croatia Bisphenol Market (2026-2032) | Trends, Segmentation, Growth, Outlook, Revenue, Analysis, Forecast, Industry, Companies, Value, Share & Size
Market Forecast By Product Type (Polymer BPA, Non-Polymer BPA), By End-Use (Polycarbonate Resin, Epoxy Resin, Others), By Application (Chemical Intermediates, Additive, Others), By Sales Channels (Direct/Institutional Sales, Retail Sales, Other Channel Sales) And Competitive Landscape
| Product Code: ETC5355001 | Publication Date: Nov 2023 | Updated Date: Apr 2026 | Product Type: Market Research Report | |
| Publisher: 6Wresearch | Author: Ravi Bhandari | No. of Pages: 60 | No. of Figures: 30 | No. of Tables: 5 |
Croatia Bisphenol Market Size (2020-2030)
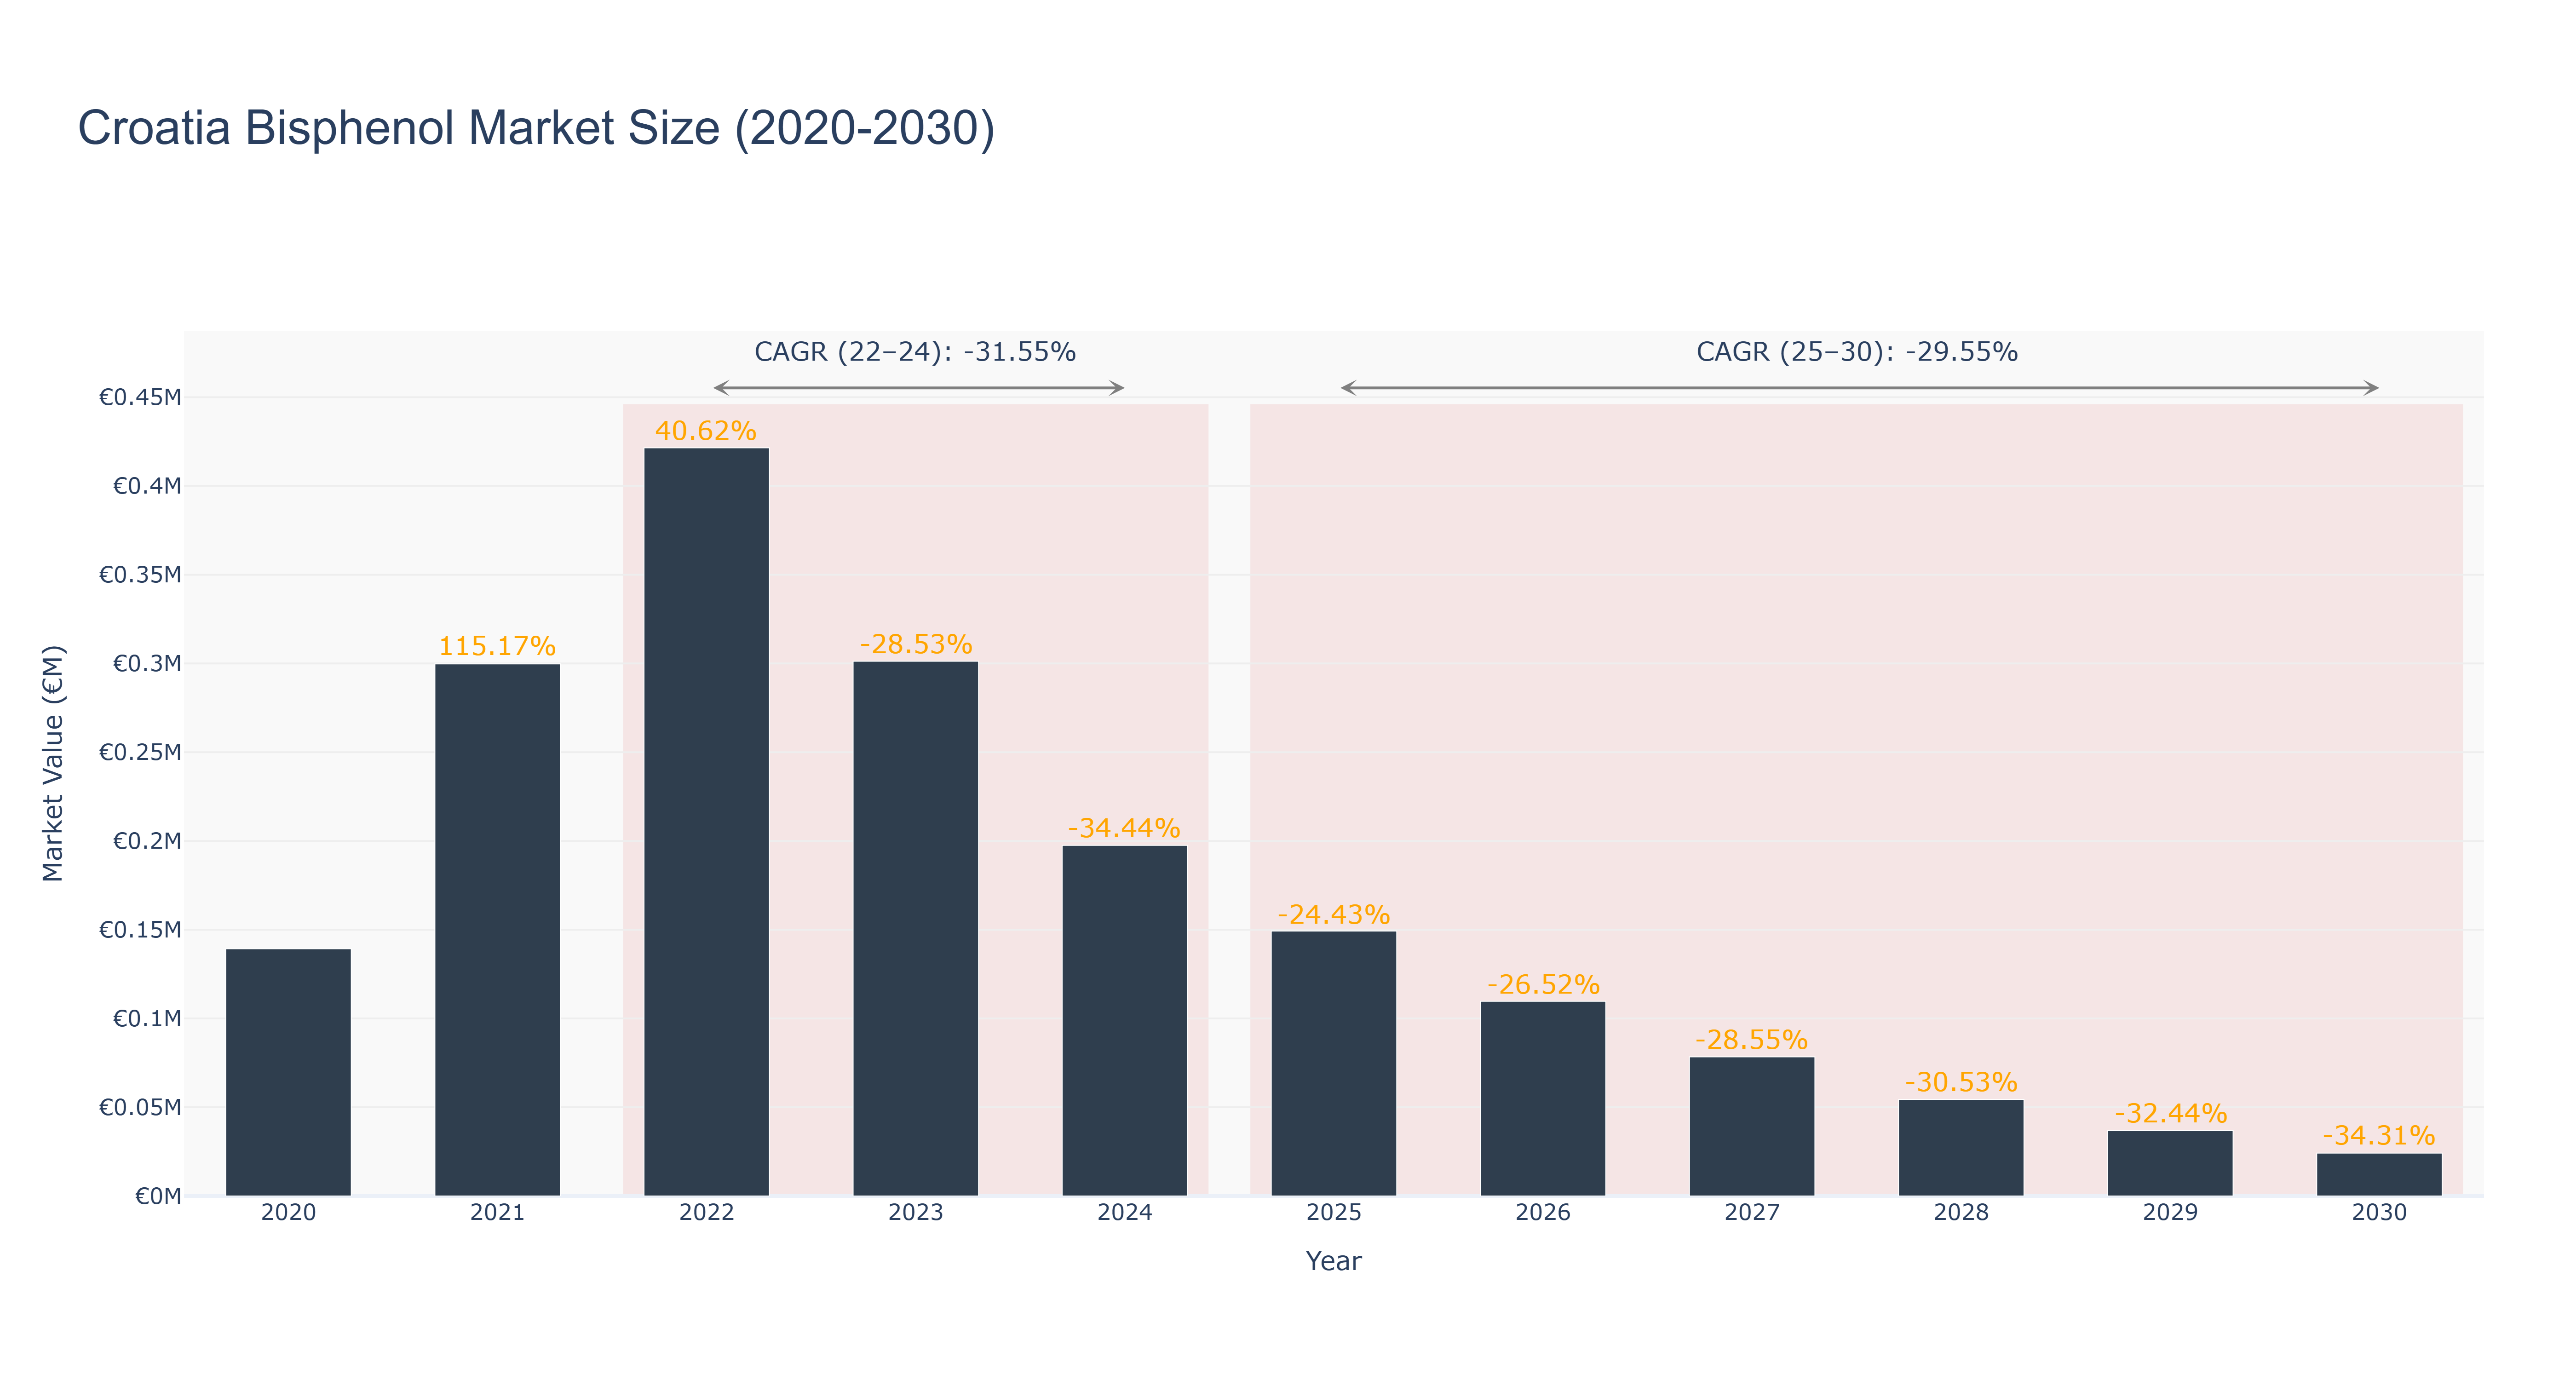
The Croatia Bisphenol Market experienced significant fluctuations between 2020 and 2024, peaking in 2021 with a market size of €299.76 thousand, followed by a decline to €197.53 thousand by 2024. This actual data reflects a compounded annual growth rate (CAGR) of -31.55% from 2022 to 2024, primarily driven by reduced demand and regulatory pressures aimed at minimizing Bisphenol usage due to health concerns. Looking ahead, the forecasted period from 2025 to 2030 indicates a continued contraction, with projected market sizes decreasing from €149.26 thousand in 2025 to €24.16 thousand by 2030, corresponding to a CAGR of -29.55%. This long-term decline may be attributed to the ongoing shift towards sustainable alternatives and advancements in chemical regulations. While there are no significant upcoming projects expected to revive the market, broader industry trends towards eco-friendly materials will continue to influence the landscape of Bisphenol consumption in Croatia.
Croatia Bisphenol Market: Production & Trade Performance (2019-2025)
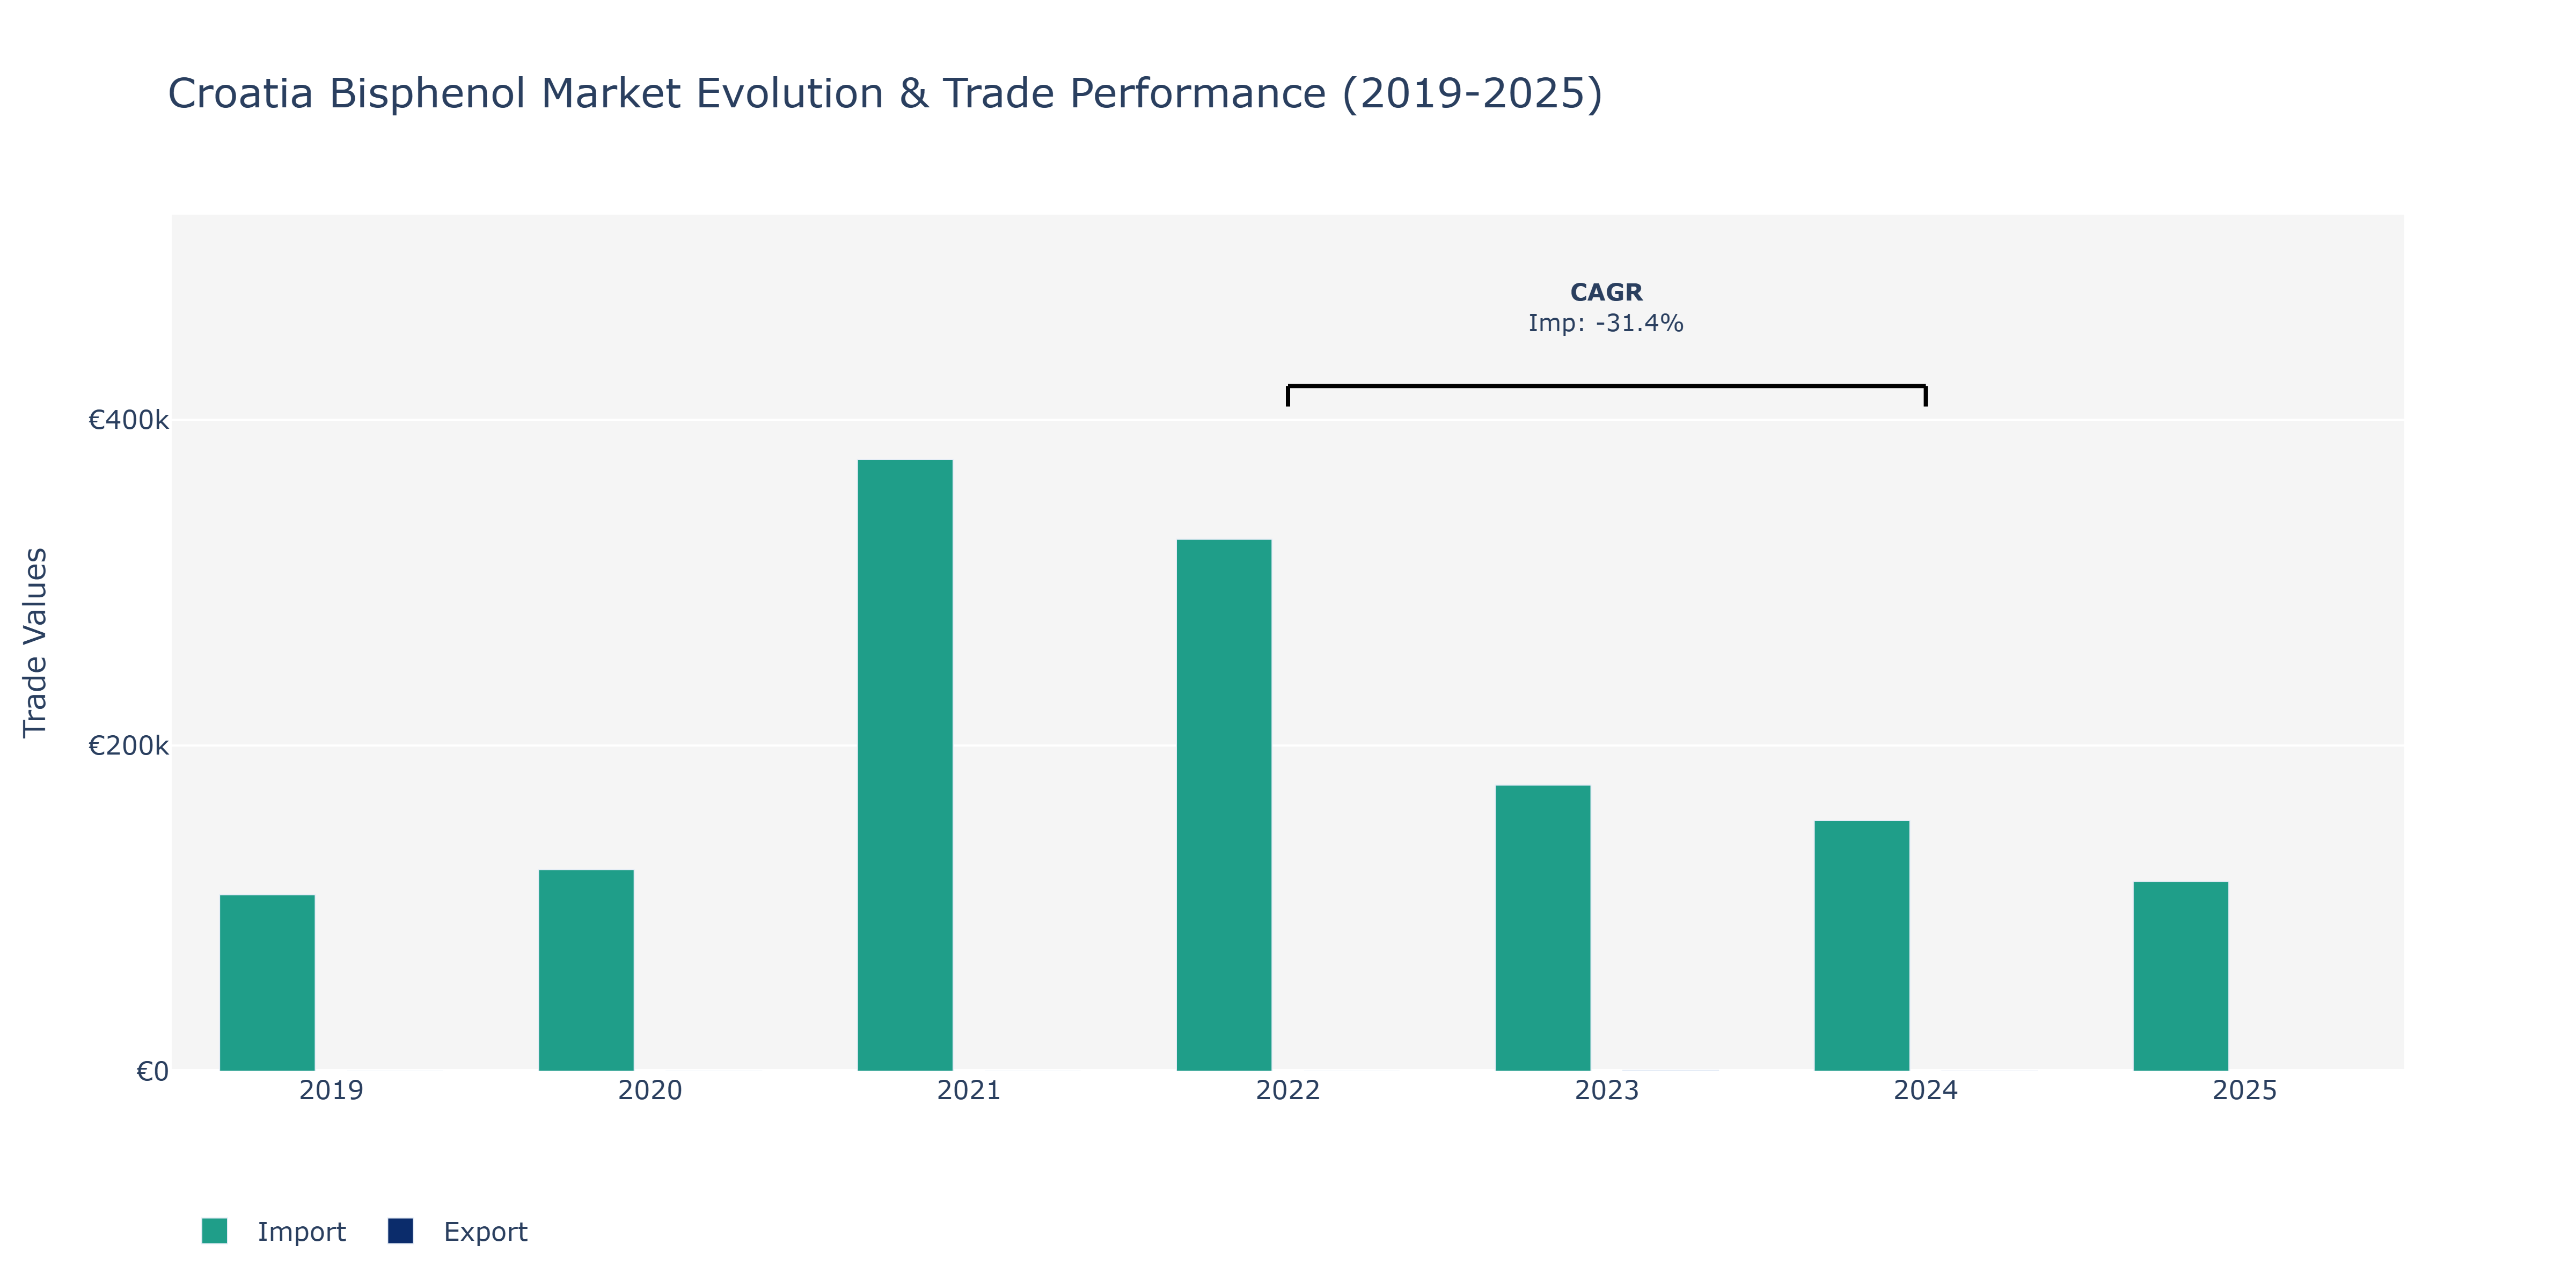
The Croatia Bisphenol Market saw a notable fluctuation in both exports and imports during the period under review. In 2019, imports stood at €108.36 thousand, which increased in 2020 to €123.86 thousand, reflecting an initial uptick. However, this growth reversed in the following years, with imports rising significantly to €375.77 thousand in 2021, then declining to €326.76 thousand in 2022. The subsequent years exhibited a mixed pattern for imports, with 2023 witnessing a notable decrease to €175.74 thousand, followed by a partial recovery in 2025 to around €116.58 thousand. On the exports front, the market experienced a downward trend from 2020 to 2024, with values ranging from €36 thousand to €116 thousand. These variations in imports and exports can be attributed to shifts in global demand for bisphenol products, changes in production capacities, and the impact of trade agreements affecting Croatia's market positioning and competitiveness. To stabilize market performance, stakeholders may consider strategic collaborations, product diversification, and market expansion initiatives to mitigate the impact of volatile market conditions and sustain long-term growth.
Key Highlights of the Report:
- Croatia Bisphenol Market Outlook
- Market Size of Croatia Bisphenol Market, 2025
- Forecast of Croatia Bisphenol Market, 2032
- Historical Data and Forecast of Croatia Bisphenol Revenues & Volume for the Period 2022 - 2032F
- Croatia Bisphenol Market Trend Evolution
- Croatia Bisphenol Market Drivers and Challenges
- Croatia Bisphenol Price Trends
- Croatia Bisphenol Porter`s Five Forces
- Croatia Bisphenol Industry Life Cycle
- Historical Data and Forecast of Croatia Bisphenol Market Revenues & Volume By Product Type for the Period 2022 - 2032F
- Historical Data and Forecast of Croatia Bisphenol Market Revenues & Volume By Polymer BPA for the Period 2022 - 2032F
- Historical Data and Forecast of Croatia Bisphenol Market Revenues & Volume By Non-Polymer BPA for the Period 2022 - 2032F
- Historical Data and Forecast of Croatia Bisphenol Market Revenues & Volume By End-Use for the Period 2022 - 2032F
- Historical Data and Forecast of Croatia Bisphenol Market Revenues & Volume By Polycarbonate Resin for the Period 2022 - 2032F
- Historical Data and Forecast of Croatia Bisphenol Market Revenues & Volume By Epoxy Resin for the Period 2022 - 2032F
- Historical Data and Forecast of Croatia Bisphenol Market Revenues & Volume By Others for the Period 2022 - 2032F
- Historical Data and Forecast of Croatia Bisphenol Market Revenues & Volume By Application for the Period 2022 - 2032F
- Historical Data and Forecast of Croatia Bisphenol Market Revenues & Volume By Chemical Intermediates for the Period 2022 - 2032F
- Historical Data and Forecast of Croatia Bisphenol Market Revenues & Volume By Additive for the Period 2022 - 2032F
- Historical Data and Forecast of Croatia Bisphenol Market Revenues & Volume By Others for the Period 2022 - 2032F
- Historical Data and Forecast of Croatia Bisphenol Market Revenues & Volume By Sales Channels for the Period 2022 - 2032F
- Historical Data and Forecast of Croatia Bisphenol Market Revenues & Volume By Direct/Institutional Sales for the Period 2022 - 2032F
- Historical Data and Forecast of Croatia Bisphenol Market Revenues & Volume By Retail Sales for the Period 2022 - 2032F
- Historical Data and Forecast of Croatia Bisphenol Market Revenues & Volume By Other Channel Sales for the Period 2022 - 2032F
- Croatia Bisphenol Import Export Trade Statistics
- Market Opportunity Assessment By Product Type
- Market Opportunity Assessment By End-Use
- Market Opportunity Assessment By Application
- Market Opportunity Assessment By Sales Channels
- Croatia Bisphenol Top Companies Market Share
- Croatia Bisphenol Competitive Benchmarking By Technical and Operational Parameters
- Croatia Bisphenol Company Profiles
- Croatia Bisphenol Key Strategic Recommendations
Frequently Asked Questions About the Market Study (FAQs):
6Wresearch actively monitors the Croatia Bisphenol Market and publishes its comprehensive annual report, highlighting emerging trends, growth drivers, revenue analysis, and forecast outlook. Our insights help businesses to make data-backed strategic decisions with ongoing market dynamics. Our analysts track relevent industries related to the Croatia Bisphenol Market, allowing our clients with actionable intelligence and reliable forecasts tailored to emerging regional needs.
Yes, we provide customisation as per your requirements. To learn more, feel free to contact us on sales@6wresearch.com
1 Executive Summary |
2 Introduction |
2.1 Key Highlights of the Report |
2.2 Report Description |
2.3 Market Scope & Segmentation |
2.4 Research Methodology |
2.5 Assumptions |
3 Croatia Bisphenol Market Overview |
3.1 Croatia Country Macro Economic Indicators |
3.2 Croatia Bisphenol Market Revenues & Volume, 2022 & 2032F |
3.3 Croatia Bisphenol Market - Industry Life Cycle |
3.4 Croatia Bisphenol Market - Porter's Five Forces |
3.5 Croatia Bisphenol Market Revenues & Volume Share, By Product Type, 2022 & 2032F |
3.6 Croatia Bisphenol Market Revenues & Volume Share, By End-Use? , 2022 & 2032F |
3.7 Croatia Bisphenol Market Revenues & Volume Share, By Application, 2022 & 2032F |
3.8 Croatia Bisphenol Market Revenues & Volume Share, By Sales Channels, 2022 & 2032F |
4 Croatia Bisphenol Market Dynamics |
4.1 Impact Analysis |
4.2 Market Drivers |
4.2.1 Increasing demand for bisphenol in various industries such as automotive, electronics, and packaging |
4.2.2 Growing awareness about the benefits of bisphenol in enhancing the performance of end products |
4.2.3 Technological advancements leading to the development of innovative bisphenol-based products |
4.3 Market Restraints |
4.3.1 Stringent regulations and restrictions on the use of bisphenol due to its potential health and environmental risks |
4.3.2 Fluctuating prices of raw materials used in the production of bisphenol |
4.3.3 Competition from alternative materials with similar properties but perceived as safer substitutes |
5 Croatia Bisphenol Market Trends |
6 Croatia Bisphenol Market Segmentations |
6.1 Croatia Bisphenol Market, By Product Type |
6.1.1 Overview and Analysis |
6.1.2 Croatia Bisphenol Market Revenues & Volume, By Polymer BPA, 2022 - 2032F |
6.1.3 Croatia Bisphenol Market Revenues & Volume, By Non-Polymer BPA, 2022 - 2032F |
6.2 Croatia Bisphenol Market, By End-Use? |
6.2.1 Overview and Analysis |
6.2.2 Croatia Bisphenol Market Revenues & Volume, By Polycarbonate Resin, 2022 - 2032F |
6.2.3 Croatia Bisphenol Market Revenues & Volume, By Epoxy Resin, 2022 - 2032F |
6.2.4 Croatia Bisphenol Market Revenues & Volume, By Others, 2022 - 2032F |
6.3 Croatia Bisphenol Market, By Application |
6.3.1 Overview and Analysis |
6.3.2 Croatia Bisphenol Market Revenues & Volume, By Chemical Intermediates, 2022 - 2032F |
6.3.3 Croatia Bisphenol Market Revenues & Volume, By Additive, 2022 - 2032F |
6.3.4 Croatia Bisphenol Market Revenues & Volume, By Others, 2022 - 2032F |
6.4 Croatia Bisphenol Market, By Sales Channels |
6.4.1 Overview and Analysis |
6.4.2 Croatia Bisphenol Market Revenues & Volume, By Direct/Institutional Sales, 2022 - 2032F |
6.4.3 Croatia Bisphenol Market Revenues & Volume, By Retail Sales, 2022 - 2032F |
6.4.4 Croatia Bisphenol Market Revenues & Volume, By Other Channel Sales, 2022 - 2032F |
7 Croatia Bisphenol Market Import-Export Trade Statistics |
7.1 Croatia Bisphenol Market Export to Major Countries |
7.2 Croatia Bisphenol Market Imports from Major Countries |
8 Croatia Bisphenol Market Key Performance Indicators |
8.1 Research and development investment in new bisphenol formulations and applications |
8.2 Number of patents filed for bisphenol-related products or processes |
8.3 Percentage of bisphenol sales attributed to new markets or applications |
8.4 Environmental impact metrics related to bisphenol production and usage |
8.5 Level of compliance with regulatory standards and certifications for bisphenol products |
9 Croatia Bisphenol Market - Opportunity Assessment |
9.1 Croatia Bisphenol Market Opportunity Assessment, By Product Type, 2022 & 2032F |
9.2 Croatia Bisphenol Market Opportunity Assessment, By End-Use? , 2022 & 2032F |
9.3 Croatia Bisphenol Market Opportunity Assessment, By Application, 2022 & 2032F |
9.4 Croatia Bisphenol Market Opportunity Assessment, By Sales Channels, 2022 & 2032F |
10 Croatia Bisphenol Market - Competitive Landscape |
10.1 Croatia Bisphenol Market Revenue Share, By Companies, 2025 |
10.2 Croatia Bisphenol Market Competitive Benchmarking, By Operating and Technical Parameters |
11 Company Profiles |
12 Recommendations | 13 Disclaimer |
Global Go To Market Strategy - 2030
Export potential enables firms to identify high-growth global markets with greater confidence by combining advanced trade intelligence with a structured quantitative methodology. The framework analyzes emerging demand trends and country-level import patterns while integrating macroeconomic and trade datasets such as GDP and population forecasts, bilateral import–export flows, tariff structures, elasticity differentials between developed and developing economies, geographic distance, and import demand projections. Using weighted trade values from 2020–2024 as the base period to project country-to-country export potential for 2030, these inputs are operationalized through calculated drivers such as gravity model parameters, tariff impact factors, and projected GDP per-capita growth. Through an analysis of hidden potentials, demand hotspots, and market conditions that are most favorable to success, this method enables firms to focus on target countries, maximize returns, and global expansion with data, backed by accuracy.
By factoring in the projected importer demand gap that is currently unmet and could be potential opportunity, it identifies the potential for the Exporter (Country) among 190 countries, against the general trade analysis, which identifies the biggest importer or exporter.
To discover high-growth global markets and optimize your business strategy:
Click Here
Pricing
- Single User License$ 1,995
- Department License$ 2,400
- Site License$ 3,120
- Global License$ 3,795

Leadership Perspectives from Industry Events
Search
Thought Leadership and Analyst Meet


Our Clients
6WResearch In News
- Doha a strategic location for EV manufacturing hub: IPA Qatar
- Demand for luxury TVs surging in the GCC, says Samsung
- Empowering Growth: The Thriving Journey of Bangladesh’s Cable Industry
- Demand for luxury TVs surging in the GCC, says Samsung
- Video call with a traditional healer? Once unthinkable, it’s now common in South Africa
- Intelligent Buildings To Smooth GCC’s Path To Net Zero
Latest Reports
- Cape Verde Portable Hand-Thrown Extinguisher Market (2026-2032)
- Canada Portable Hand-Thrown Extinguisher Market (2026-2032)
- Cameroon Portable Hand-Thrown Extinguisher Market (2026-2032)
- Burundi Portable Hand-Thrown Extinguisher Market (2026-2032)
- Burkina Faso Portable Hand-Thrown Extinguisher Market (2026-2032)
- Bulgaria Portable Hand-Thrown Extinguisher Market (2026-2032)
- Brunei Portable Hand-Thrown Extinguisher Market (2026-2032)
- Botswana Portable Hand-Thrown Extinguisher Market (2026-2032)
- Bosnia and Herzegovina Portable Hand-Thrown Extinguisher Market (2026-2032)
- Bolivia Portable Hand-Thrown Extinguisher Market (2026-2032)
Industry Events and Analyst Meet

HIMTEX 2026

India Refining Summit 2026

India EV Show 2026

EV tech India Expo 2026

Auto Tech Asia 2026
Whitepaper
- Middle East & Africa Commercial Security Market Click here to view more.
- Middle East & Africa Fire Safety Systems & Equipment Market Click here to view more.
- GCC Drone Market Click here to view more.
- Middle East Lighting Fixture Market Click here to view more.
- GCC Physical & Perimeter Security Market Click here to view more.