Croatia Cake Market (2026-2032) | Forecast, Supply, Growth, Challenges, Industry, Competitive, Pricing Analysis, Strategic Insights, Outlook, Restraints, Trends, Investment Trends, Competition, Consumer Insights, Value, Companies, Demand, Size, Share, Segments, Opportunities, Strategy, Analysis, Revenue, Drivers, Segmentation
Market Forecast By Product Type (Sponge Cake, Cheesecake, Fruit Cake), By Application (Bakery, Desserts, Celebrations), By End User (Restaurants, Cafes, Households), By Ingredient (Flour-Based, Sugar-Based, Egg-Free), By Packaging Type (Boxes, Trays, Wrappers) And Competitive Landscape
| Product Code: ETC11466965 | Publication Date: Apr 2025 | Updated Date: Apr 2026 | Product Type: Market Research Report | |
| Publisher: 6Wresearch | No. of Pages: 65 | No. of Figures: 34 | No. of Tables: 19 | |
Croatia Cake Market Size (2020-2030)
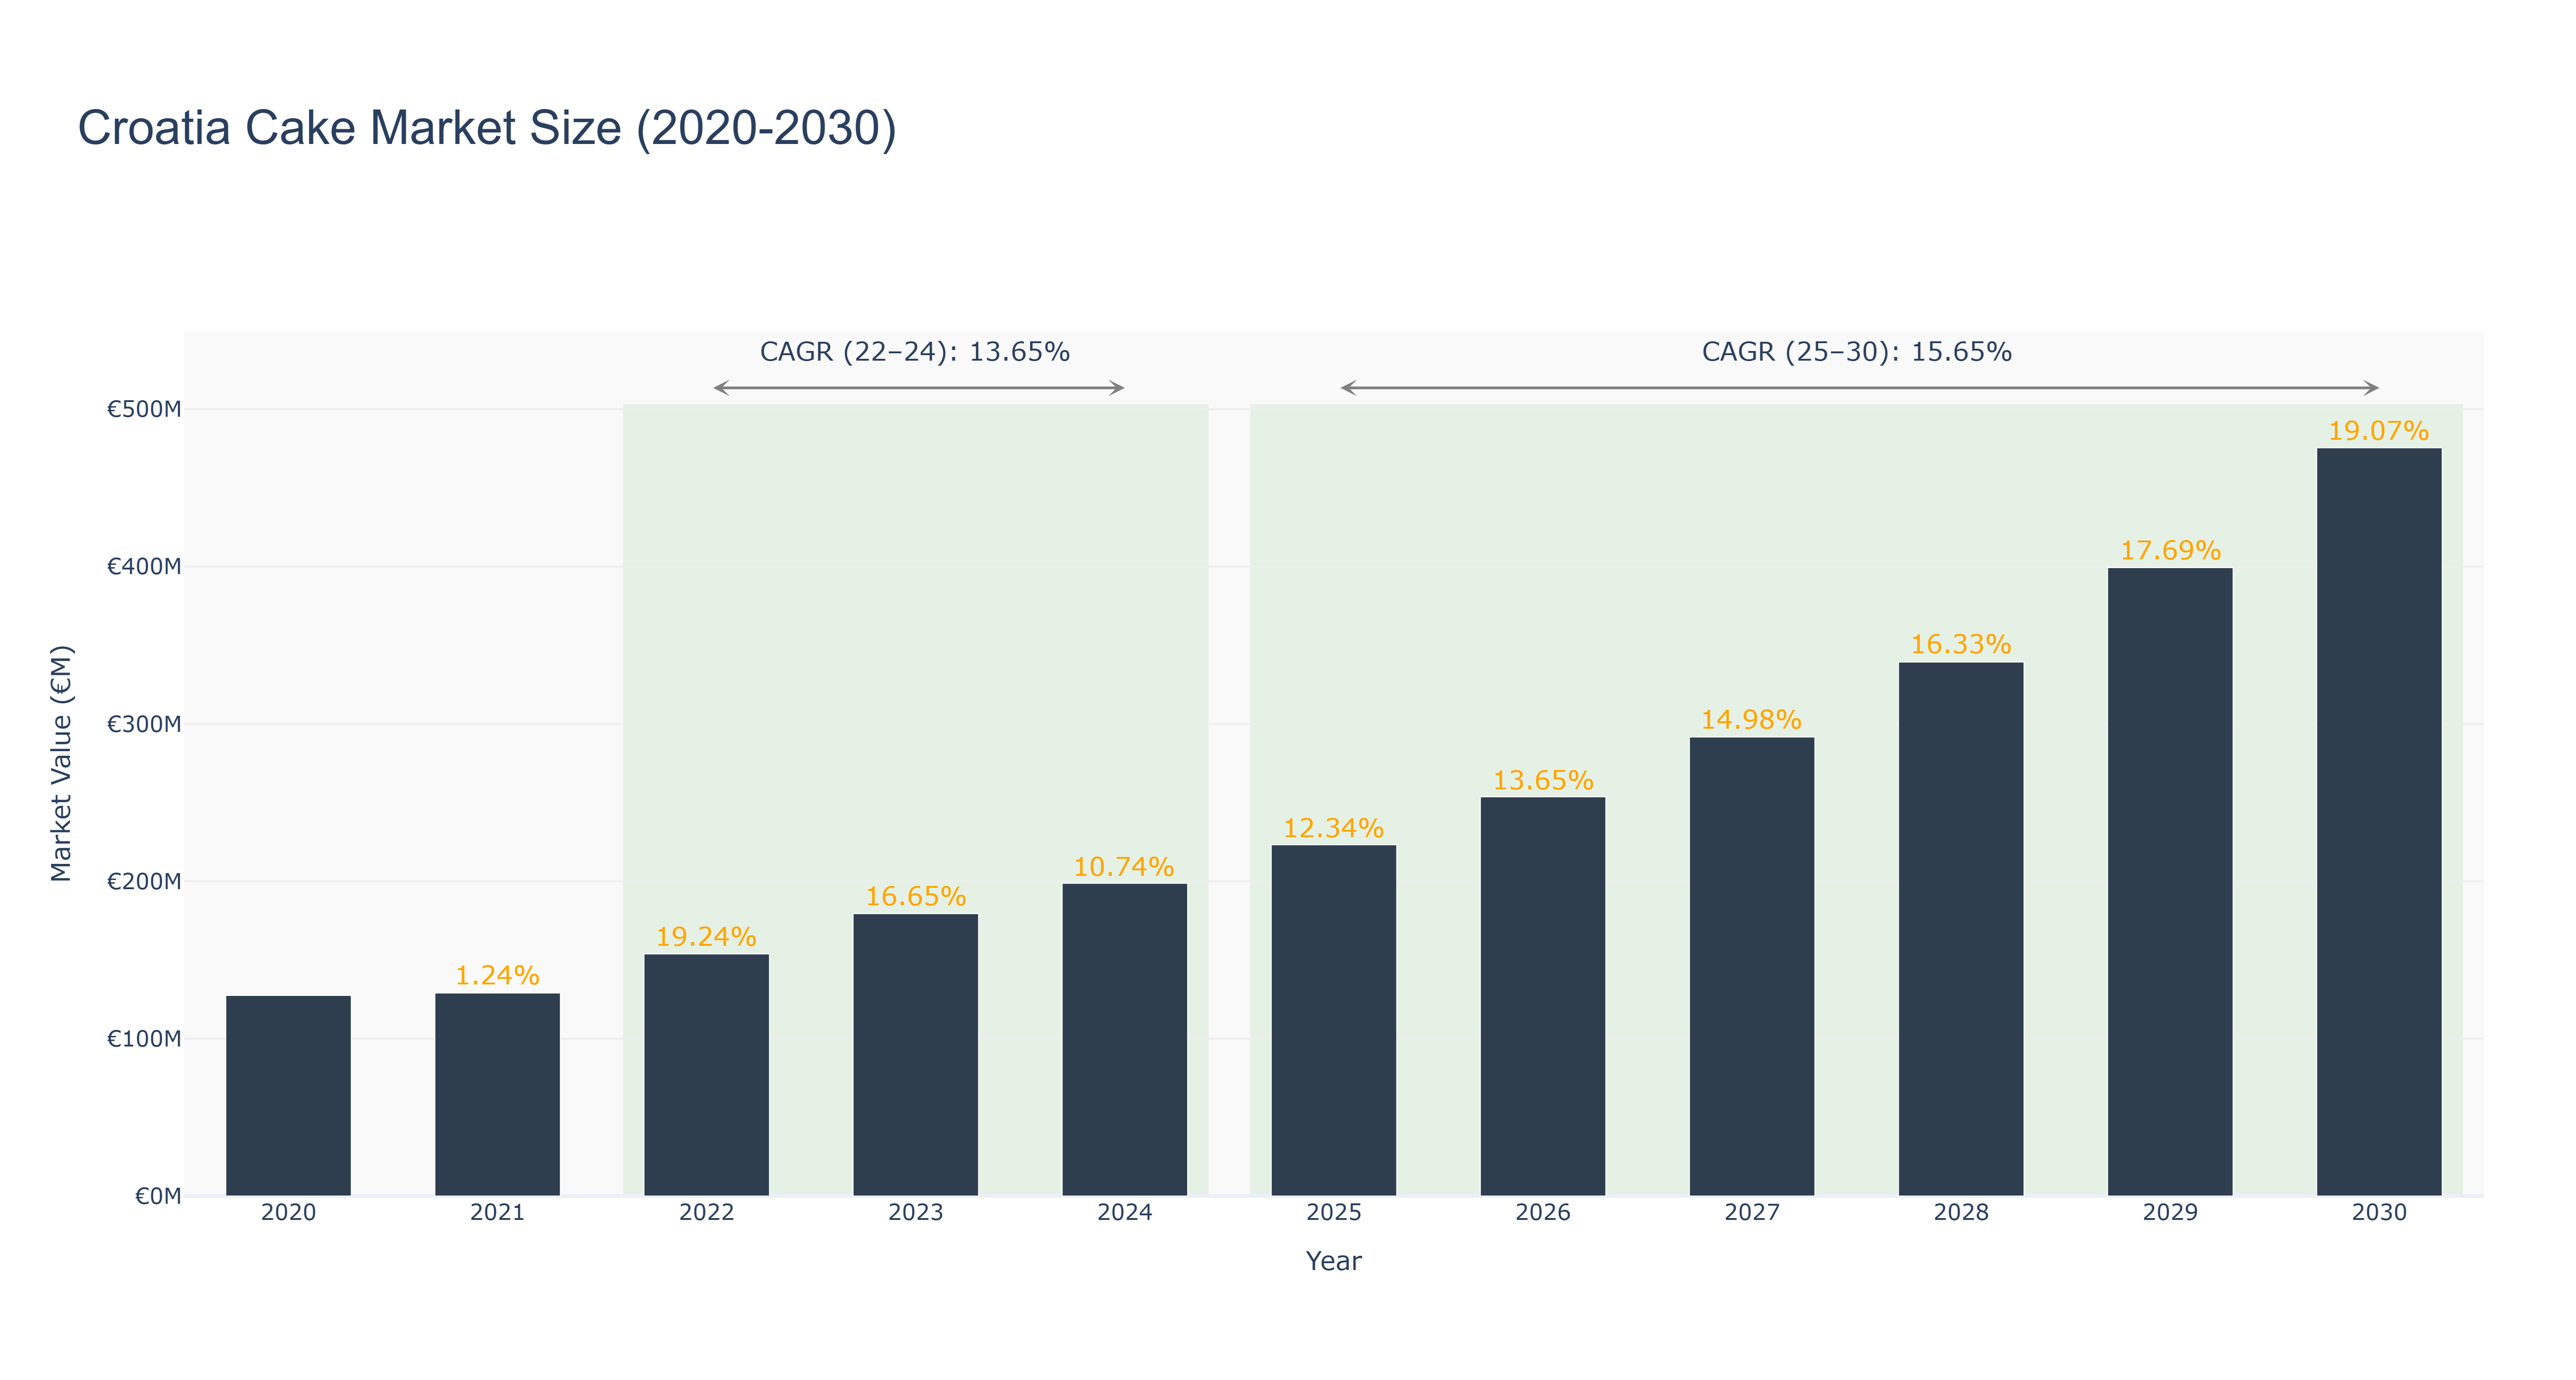
The Croatia Cake Market has shown significant growth over the years. The market size increased from €127.43 million in 2020 to €198.69 million in 2024, experiencing a steady upward trend. The peak market size was recorded in 2030 at €475.49 million. The CAGR for the period 2022-24 was 13.65%, while for 2025-30, it is forecasted to be 15.65%. This growth can be attributed to increasing consumer demand for premium cakes and desserts, coupled with a rise in disposable income. Looking ahead, the market is expected to continue its upward trajectory, with ongoing investments in product innovation and marketing strategies. Additionally, upcoming collaborations with renowned pastry chefs are set to further boost market visibility and drive sales in the near future.
Croatia Cake Market: Production & Trade Performance (2019-2025)
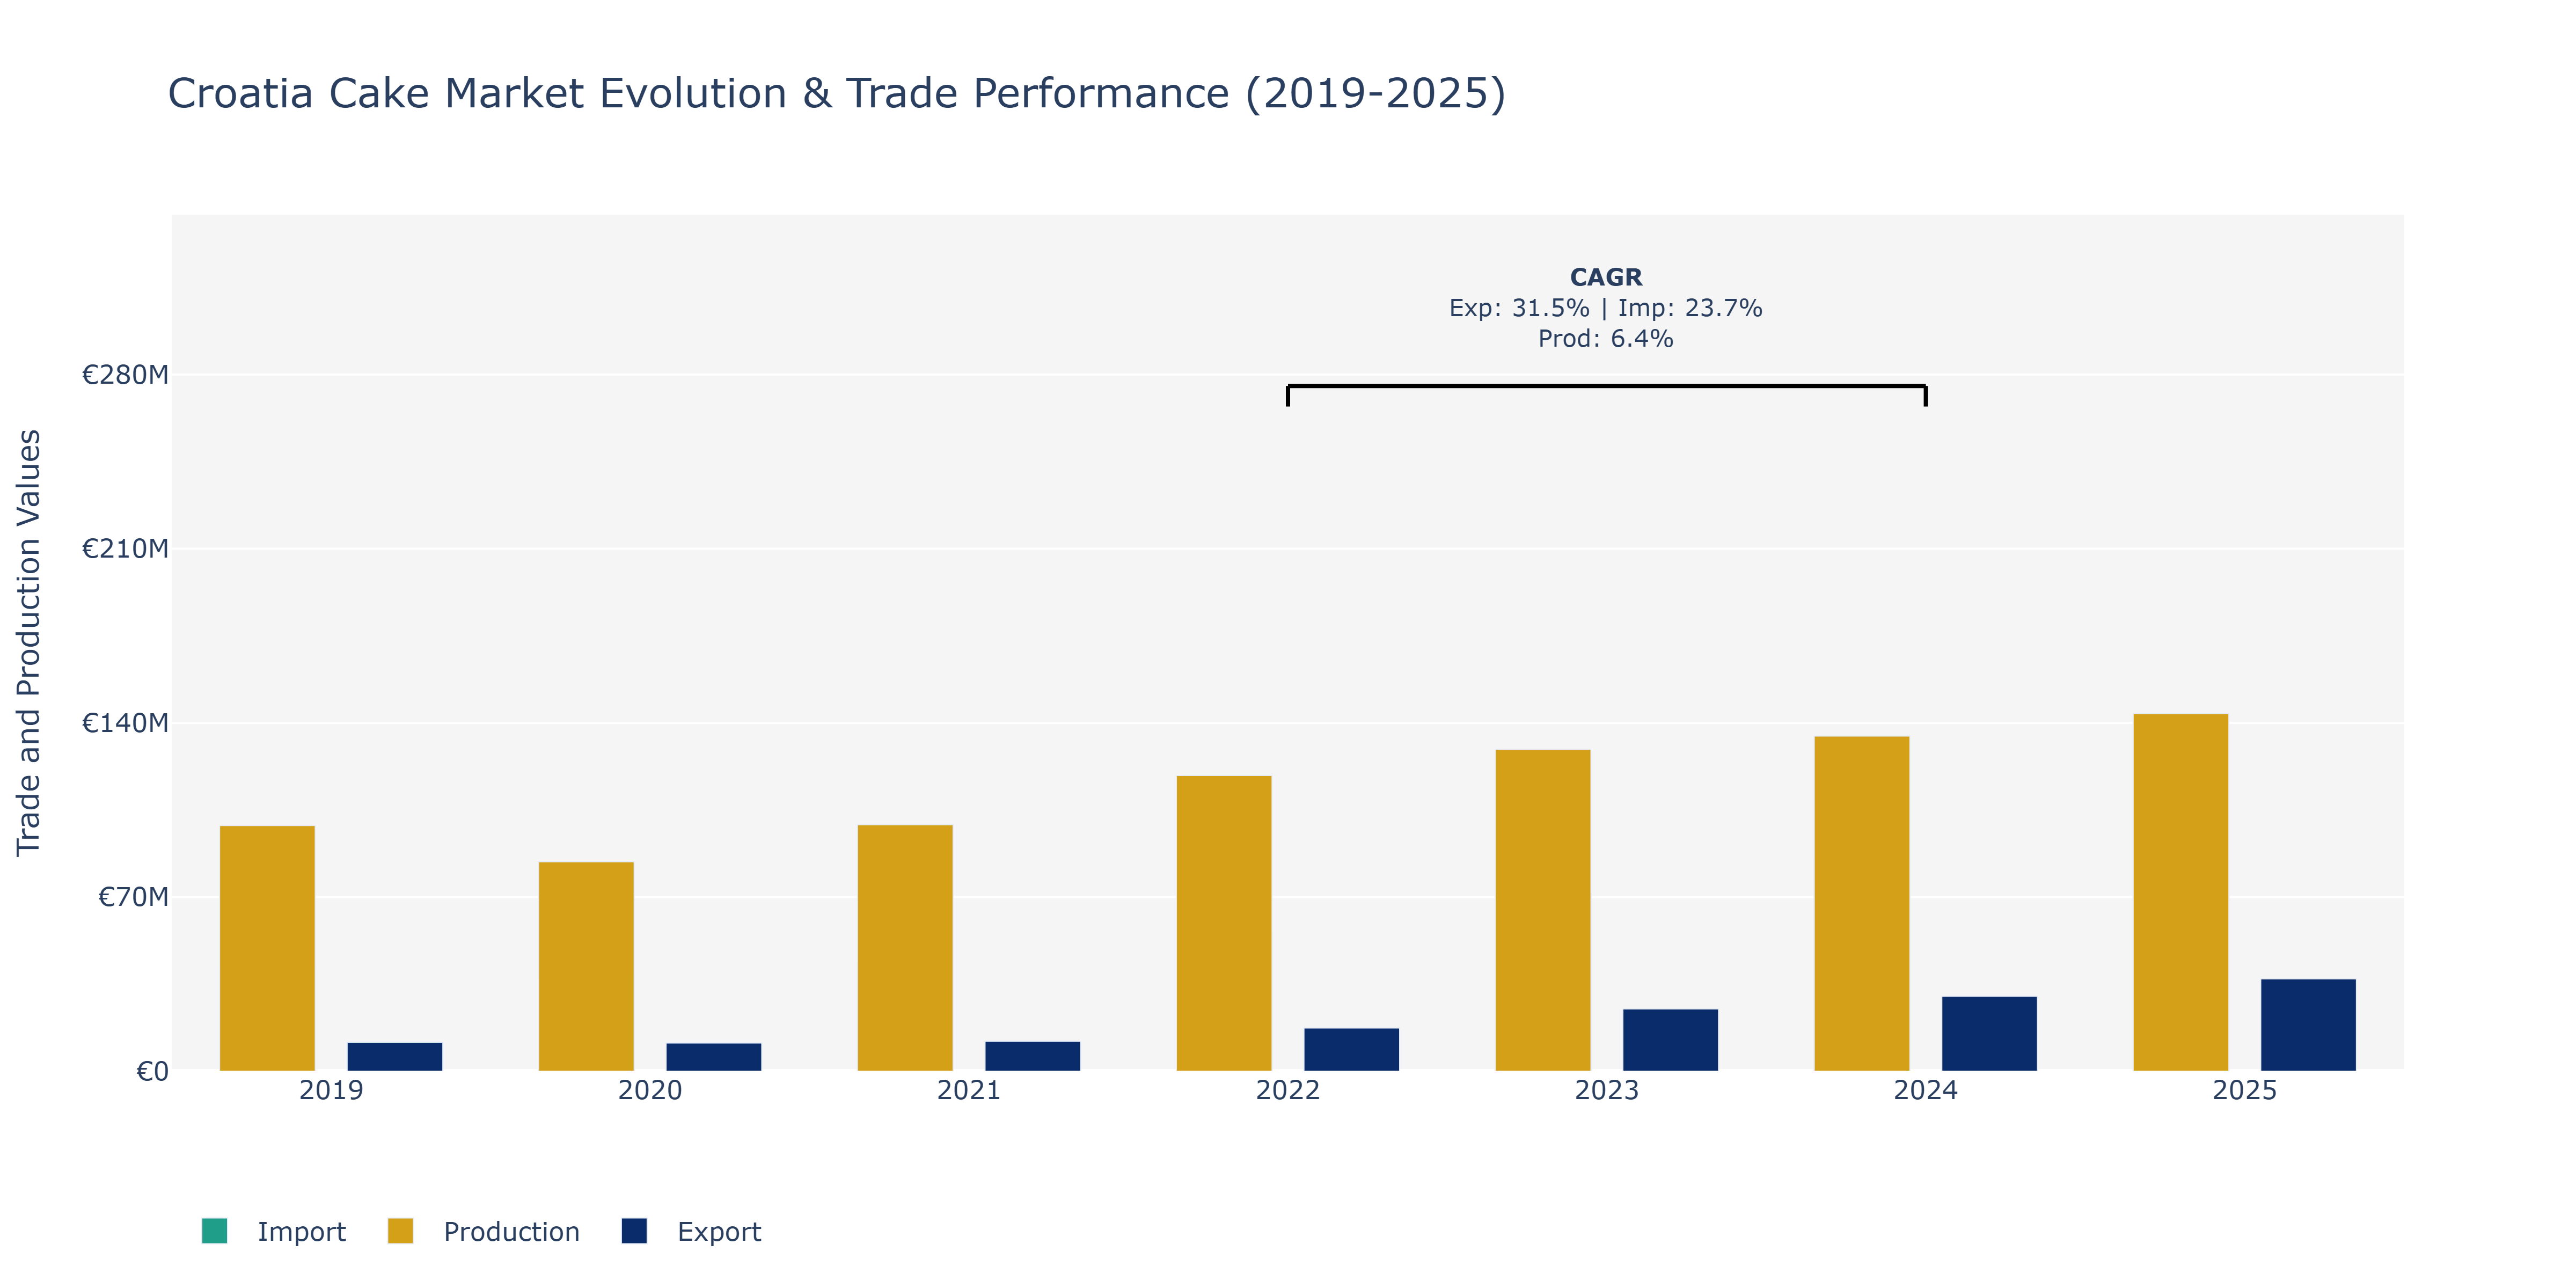
Between 2019 and 2025, Croatia's Cake Market displayed dynamic trends in exports, imports, and production. Exports saw a steady increase from €11.67 million in 2019 to €37.09 million in 2025, indicating a growing international demand for Croatian cakes. Import value also surged, rising from €41.02 million in 2019 to €102.16 million in 2025, reflecting a consistent appetite for foreign cake varieties within the country. Production levels fluctuated, with a peak at €143.75 million in 2025, showcasing the domestic market's capacity to meet both local and export requirements. Factors contributing to these trends could include evolving consumer preferences, increased global trade partnerships, and advancements in production technologies. The rise in exports could be attributed to enhanced product quality and effective marketing strategies, while the surge in imports may stem from a desire for product diversification and access to unique flavors not readily available domestically. The gradual increase in production reflects the industry's efforts to meet rising demand, potentially fueled by investments in production facilities and innovation to maintain product competitiveness in the market.
Key Highlights of the Report:
- Croatia Cake Market Outlook
- Market Size of Croatia Cake Market, 2025
- Forecast of Croatia Cake Market, 2032
- Historical Data and Forecast of Croatia Cake Revenues & Volume for the Period 2022 - 2032F
- Croatia Cake Market Trend Evolution
- Croatia Cake Market Drivers and Challenges
- Croatia Cake Price Trends
- Croatia Cake Porter's Five Forces
- Croatia Cake Industry Life Cycle
- Historical Data and Forecast of Croatia Cake Market Revenues & Volume By Product Type for the Period 2022 - 2032F
- Historical Data and Forecast of Croatia Cake Market Revenues & Volume By Sponge Cake for the Period 2022 - 2032F
- Historical Data and Forecast of Croatia Cake Market Revenues & Volume By Cheesecake for the Period 2022 - 2032F
- Historical Data and Forecast of Croatia Cake Market Revenues & Volume By Fruit Cake for the Period 2022 - 2032F
- Historical Data and Forecast of Croatia Cake Market Revenues & Volume By Application for the Period 2022 - 2032F
- Historical Data and Forecast of Croatia Cake Market Revenues & Volume By Bakery for the Period 2022 - 2032F
- Historical Data and Forecast of Croatia Cake Market Revenues & Volume By Desserts for the Period 2022 - 2032F
- Historical Data and Forecast of Croatia Cake Market Revenues & Volume By Celebrations for the Period 2022 - 2032F
- Historical Data and Forecast of Croatia Cake Market Revenues & Volume By End User for the Period 2022 - 2032F
- Historical Data and Forecast of Croatia Cake Market Revenues & Volume By Restaurants for the Period 2022 - 2032F
- Historical Data and Forecast of Croatia Cake Market Revenues & Volume By Cafes for the Period 2022 - 2032F
- Historical Data and Forecast of Croatia Cake Market Revenues & Volume By Households for the Period 2022 - 2032F
- Historical Data and Forecast of Croatia Cake Market Revenues & Volume By Ingredient for the Period 2022 - 2032F
- Historical Data and Forecast of Croatia Cake Market Revenues & Volume By Flour-Based for the Period 2022 - 2032F
- Historical Data and Forecast of Croatia Cake Market Revenues & Volume By Sugar-Based for the Period 2022 - 2032F
- Historical Data and Forecast of Croatia Cake Market Revenues & Volume By Egg-Free for the Period 2022 - 2032F
- Historical Data and Forecast of Croatia Cake Market Revenues & Volume By Packaging Type for the Period 2022 - 2032F
- Historical Data and Forecast of Croatia Cake Market Revenues & Volume By Boxes for the Period 2022 - 2032F
- Historical Data and Forecast of Croatia Cake Market Revenues & Volume By Trays for the Period 2022 - 2032F
- Historical Data and Forecast of Croatia Cake Market Revenues & Volume By Wrappers for the Period 2022 - 2032F
- Croatia Cake Import Export Trade Statistics
- Market Opportunity Assessment By Product Type
- Market Opportunity Assessment By Application
- Market Opportunity Assessment By End User
- Market Opportunity Assessment By Ingredient
- Market Opportunity Assessment By Packaging Type
- Croatia Cake Top Companies Market Share
- Croatia Cake Competitive Benchmarking By Technical and Operational Parameters
- Croatia Cake Company Profiles
- Croatia Cake Key Strategic Recommendations
Frequently Asked Questions About the Market Study (FAQs):
6Wresearch actively monitors the Croatia Cake Market and publishes its comprehensive annual report, highlighting emerging trends, growth drivers, revenue analysis, and forecast outlook. Our insights help businesses to make data-backed strategic decisions with ongoing market dynamics. Our analysts track relevent industries related to the Croatia Cake Market, allowing our clients with actionable intelligence and reliable forecasts tailored to emerging regional needs.
Yes, we provide customisation as per your requirements. To learn more, feel free to contact us on sales@6wresearch.com
1 Executive Summary |
2 Introduction |
2.1 Key Highlights of the Report |
2.2 Report Description |
2.3 Market Scope & Segmentation |
2.4 Research Methodology |
2.5 Assumptions |
3 Croatia Cake Market Overview |
3.1 Croatia Country Macro Economic Indicators |
3.2 Croatia Cake Market Revenues & Volume, 2022 & 2032F |
3.3 Croatia Cake Market - Industry Life Cycle |
3.4 Croatia Cake Market - Porter's Five Forces |
3.5 Croatia Cake Market Revenues & Volume Share, By Product Type, 2022 & 2032F |
3.6 Croatia Cake Market Revenues & Volume Share, By Application, 2022 & 2032F |
3.7 Croatia Cake Market Revenues & Volume Share, By End User, 2022 & 2032F |
3.8 Croatia Cake Market Revenues & Volume Share, By Ingredient, 2022 & 2032F |
3.9 Croatia Cake Market Revenues & Volume Share, By Packaging Type, 2022 & 2032F |
4 Croatia Cake Market Dynamics |
4.1 Impact Analysis |
4.2 Market Drivers |
4.3 Market Restraints |
5 Croatia Cake Market Trends |
6 Croatia Cake Market, By Types |
6.1 Croatia Cake Market, By Product Type |
6.1.1 Overview and Analysis |
6.1.2 Croatia Cake Market Revenues & Volume, By Product Type, 2022 - 2032F |
6.1.3 Croatia Cake Market Revenues & Volume, By Sponge Cake, 2022 - 2032F |
6.1.4 Croatia Cake Market Revenues & Volume, By Cheesecake, 2022 - 2032F |
6.1.5 Croatia Cake Market Revenues & Volume, By Fruit Cake, 2022 - 2032F |
6.2 Croatia Cake Market, By Application |
6.2.1 Overview and Analysis |
6.2.2 Croatia Cake Market Revenues & Volume, By Bakery, 2022 - 2032F |
6.2.3 Croatia Cake Market Revenues & Volume, By Desserts, 2022 - 2032F |
6.2.4 Croatia Cake Market Revenues & Volume, By Celebrations, 2022 - 2032F |
6.3 Croatia Cake Market, By End User |
6.3.1 Overview and Analysis |
6.3.2 Croatia Cake Market Revenues & Volume, By Restaurants, 2022 - 2032F |
6.3.3 Croatia Cake Market Revenues & Volume, By Cafes, 2022 - 2032F |
6.3.4 Croatia Cake Market Revenues & Volume, By Households, 2022 - 2032F |
6.4 Croatia Cake Market, By Ingredient |
6.4.1 Overview and Analysis |
6.4.2 Croatia Cake Market Revenues & Volume, By Flour-Based, 2022 - 2032F |
6.4.3 Croatia Cake Market Revenues & Volume, By Sugar-Based, 2022 - 2032F |
6.4.4 Croatia Cake Market Revenues & Volume, By Egg-Free, 2022 - 2032F |
6.5 Croatia Cake Market, By Packaging Type |
6.5.1 Overview and Analysis |
6.5.2 Croatia Cake Market Revenues & Volume, By Boxes, 2022 - 2032F |
6.5.3 Croatia Cake Market Revenues & Volume, By Trays, 2022 - 2032F |
6.5.4 Croatia Cake Market Revenues & Volume, By Wrappers, 2022 - 2032F |
7 Croatia Cake Market Import-Export Trade Statistics |
7.1 Croatia Cake Market Export to Major Countries |
7.2 Croatia Cake Market Imports from Major Countries |
8 Croatia Cake Market Key Performance Indicators |
9 Croatia Cake Market - Opportunity Assessment |
9.1 Croatia Cake Market Opportunity Assessment, By Product Type, 2022 & 2032F |
9.2 Croatia Cake Market Opportunity Assessment, By Application, 2022 & 2032F |
9.3 Croatia Cake Market Opportunity Assessment, By End User, 2022 & 2032F |
9.4 Croatia Cake Market Opportunity Assessment, By Ingredient, 2022 & 2032F |
9.5 Croatia Cake Market Opportunity Assessment, By Packaging Type, 2022 & 2032F |
10 Croatia Cake Market - Competitive Landscape |
10.1 Croatia Cake Market Revenue Share, By Companies, 2025 |
10.2 Croatia Cake Market Competitive Benchmarking, By Operating and Technical Parameters |
11 Company Profiles |
12 Recommendations |
13 Disclaimer |
Global Go To Market Strategy - 2030
Export potential enables firms to identify high-growth global markets with greater confidence by combining advanced trade intelligence with a structured quantitative methodology. The framework analyzes emerging demand trends and country-level import patterns while integrating macroeconomic and trade datasets such as GDP and population forecasts, bilateral import–export flows, tariff structures, elasticity differentials between developed and developing economies, geographic distance, and import demand projections. Using weighted trade values from 2020–2024 as the base period to project country-to-country export potential for 2030, these inputs are operationalized through calculated drivers such as gravity model parameters, tariff impact factors, and projected GDP per-capita growth. Through an analysis of hidden potentials, demand hotspots, and market conditions that are most favorable to success, this method enables firms to focus on target countries, maximize returns, and global expansion with data, backed by accuracy.
By factoring in the projected importer demand gap that is currently unmet and could be potential opportunity, it identifies the potential for the Exporter (Country) among 190 countries, against the general trade analysis, which identifies the biggest importer or exporter.
To discover high-growth global markets and optimize your business strategy:
Click Here
Pricing
- Single User License$ 1,995
- Department License$ 2,400
- Site License$ 3,120
- Global License$ 3,795

Leadership Perspectives from Industry Events
Search
Thought Leadership and Analyst Meet


Our Clients
6WResearch In News
- Doha a strategic location for EV manufacturing hub: IPA Qatar
- Demand for luxury TVs surging in the GCC, says Samsung
- Empowering Growth: The Thriving Journey of Bangladesh’s Cable Industry
- Demand for luxury TVs surging in the GCC, says Samsung
- Video call with a traditional healer? Once unthinkable, it’s now common in South Africa
- Intelligent Buildings To Smooth GCC’s Path To Net Zero
Latest Reports
- Taiwan Airport Wireless Infrastructure Market (2026-2032)
- Vietnam Airport Wireless Infrastructure Market (2026-2032)
- Thailand Airport Wireless Infrastructure Market (2026-2032)
- South Korea Airport Wireless Infrastructure Market (2026-2032)
- Romania Airport Wireless Infrastructure Market (2026-2032)
- Qatar Airport Wireless Infrastructure Market (2026-2032)
- Philippines Airport Wireless Infrastructure Market (2026-2032)
- Japan Airport Wireless Infrastructure Market (2026-2032)
- Taiwan Airport Winter Services Market (2026-2032)
- Vietnam Airport Winter Services Market (2026-2032)
Industry Events and Analyst Meet

HIMTEX 2026

India Refining Summit 2026

India EV Show 2026

EV tech India Expo 2026

Auto Tech Asia 2026
Whitepaper
- Middle East & Africa Commercial Security Market Click here to view more.
- Middle East & Africa Fire Safety Systems & Equipment Market Click here to view more.
- GCC Drone Market Click here to view more.
- Middle East Lighting Fixture Market Click here to view more.
- GCC Physical & Perimeter Security Market Click here to view more.