Croatia Dyes Market (2026-2032) | Analysis, Trends, Companies, Outlook, Value, Size & Revenue, Share, Growth, Segmentation, Competitive Landscape, Forecast, Industry
Market Forecast By Product Type (Reactive Dyes, Disperse Dyes, Vat Dyes, Direct Dyes, Acid Dyes, Other Dyes), By Application (Textile, Leather, Paper, Printing Inks, Other) And Competitive Landscape
| Product Code: ETC6849980 | Publication Date: Sep 2024 | Updated Date: Apr 2026 | Product Type: Market Research Report | |
| Publisher: 6Wresearch | Author: Vasudha | No. of Pages: 75 | No. of Figures: 35 | No. of Tables: 20 |
Croatia Dyes Market Size (2020-2030)
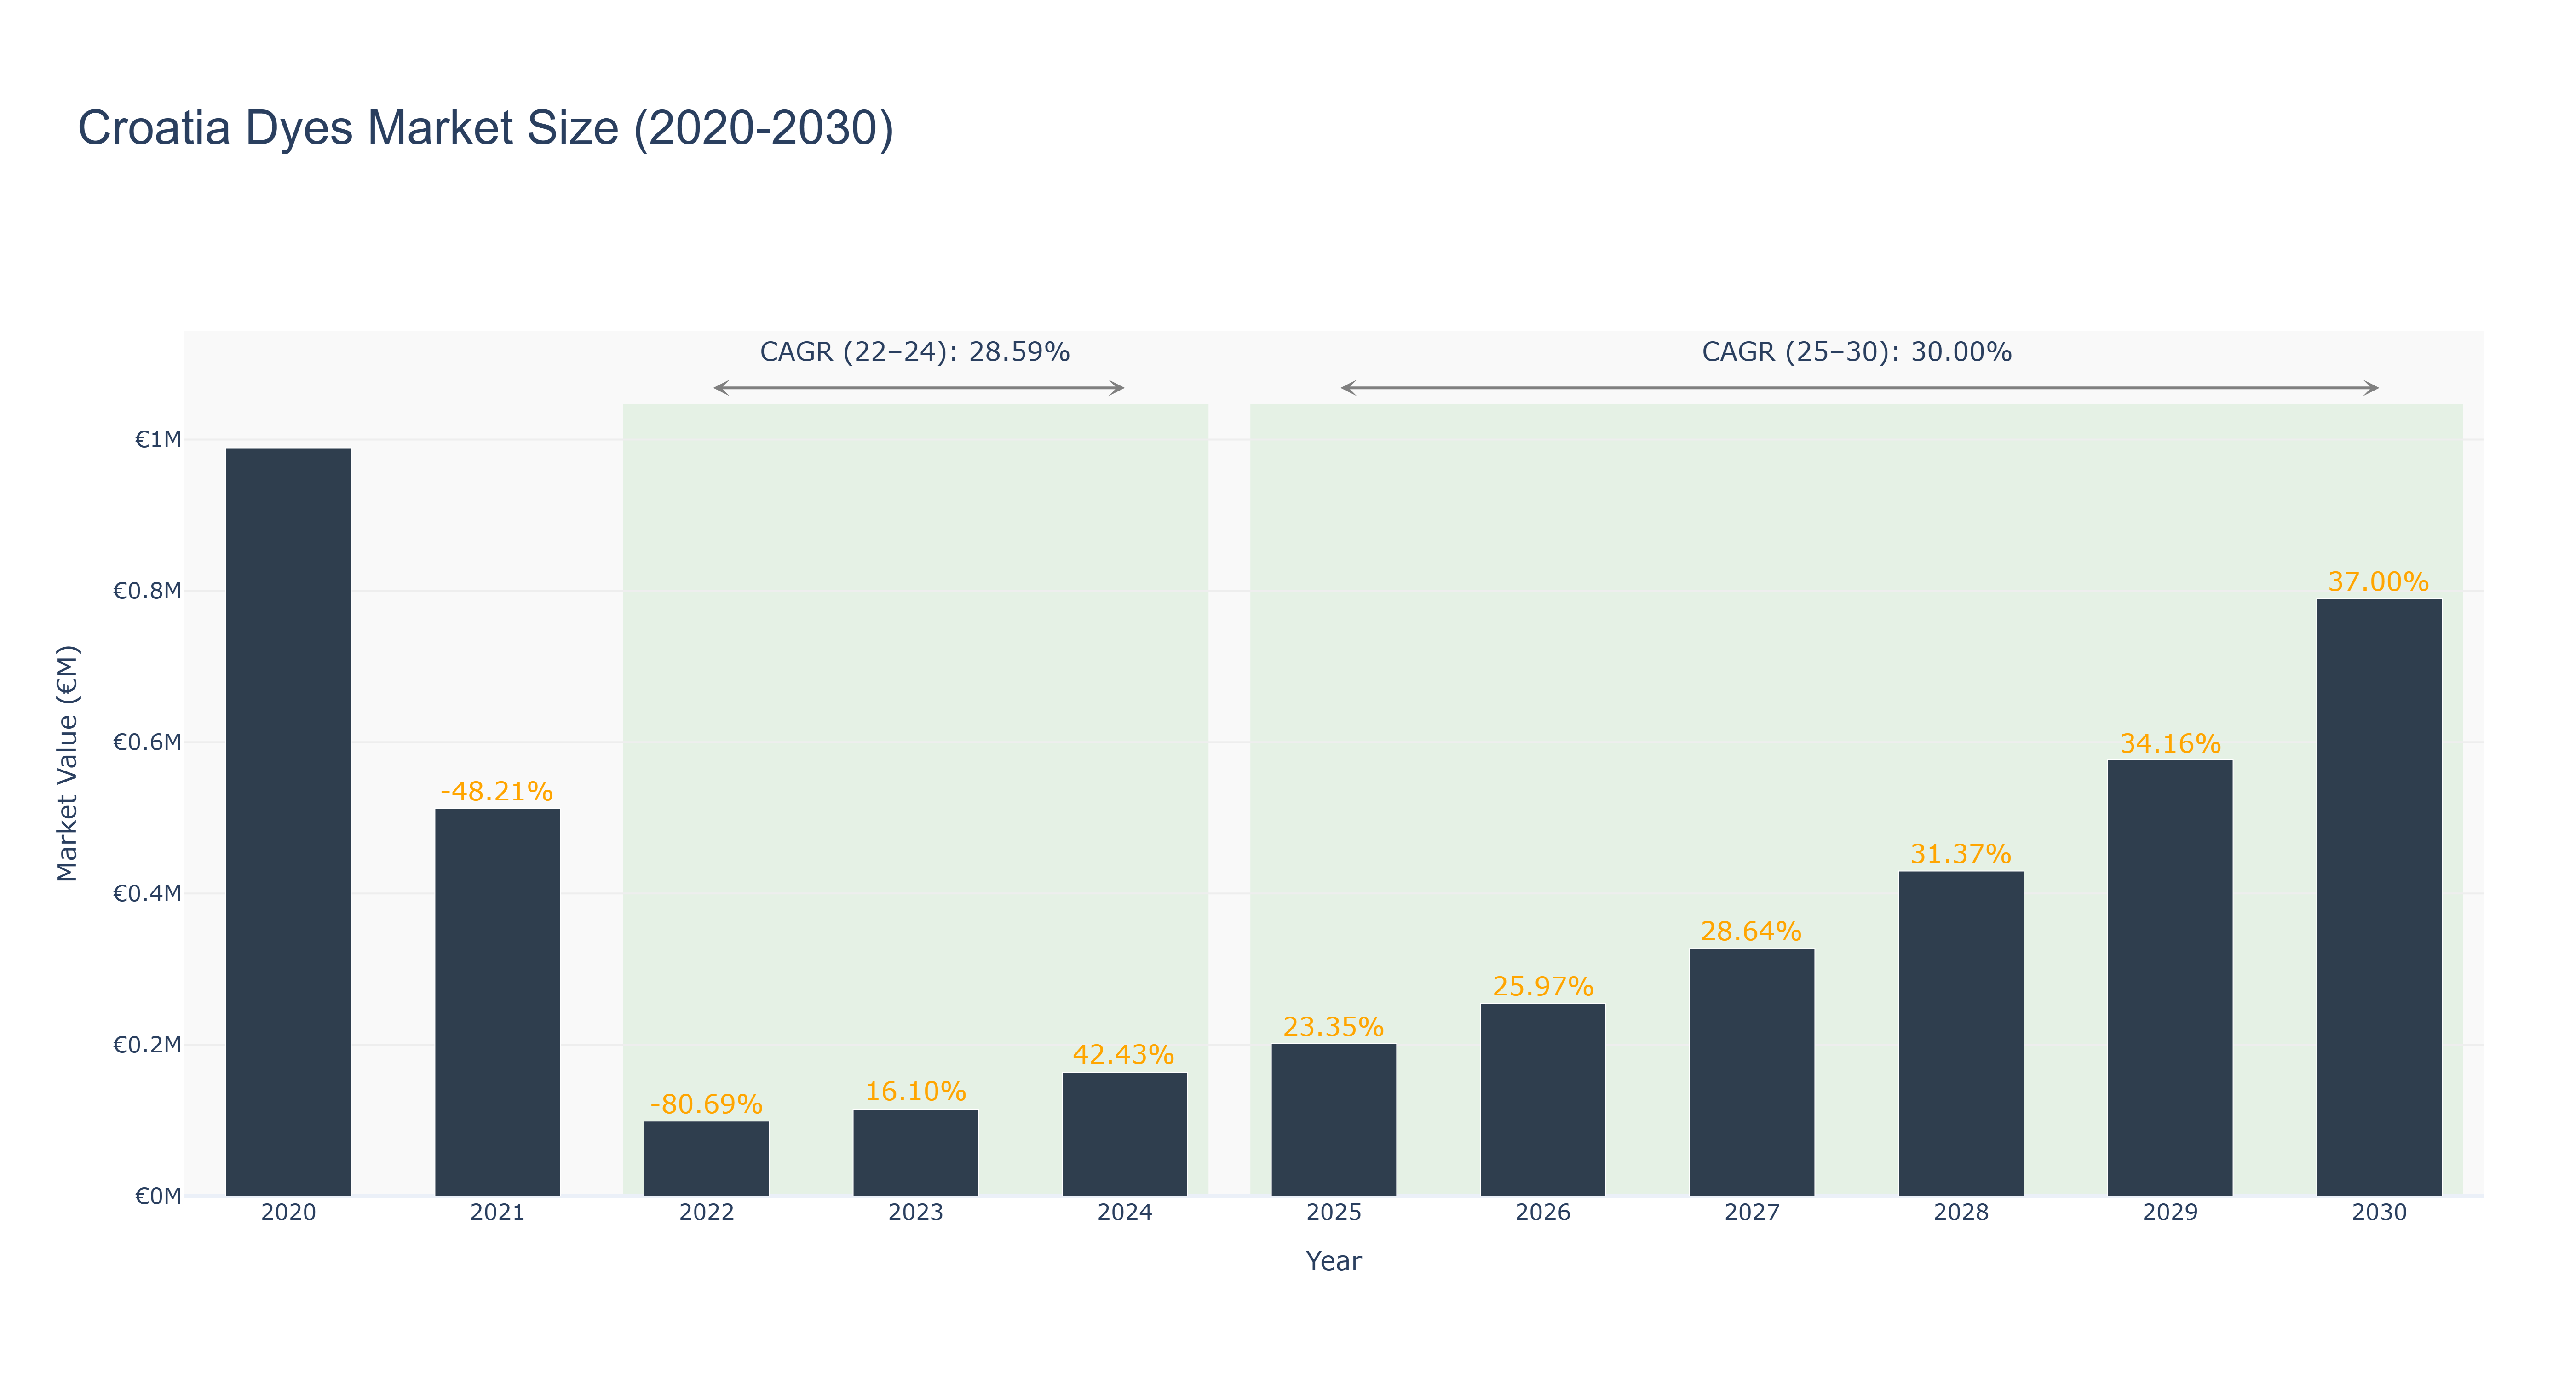
Croatia Dyes Market has experienced fluctuating market sizes in recent years. The peak market size of €0.79 million was achieved in 2030. From 2020 to 2024, the market size decreased from €0.99 million to €0.16 million due to a significant decline in demand and economic challenges. However, a positive trend emerged from 2025 onwards, with forecasted market sizes increasing steadily from €0.20 million in 2025 to €0.79 million in 2030. The CAGR for the periods 2022-24 and 2025-30 were 28.59% and 30.0% respectively. Industry drivers such as technological advancements, increasing demand for eco-friendly dyes, and growing textile industry are propelling the market growth. In the near future, Croatia is set to launch a sustainable dyeing project aimed at reducing environmental impact, which is expected to further boost market expansion.
Croatia Dyes Market: Production & Trade Performance (2019-2025)
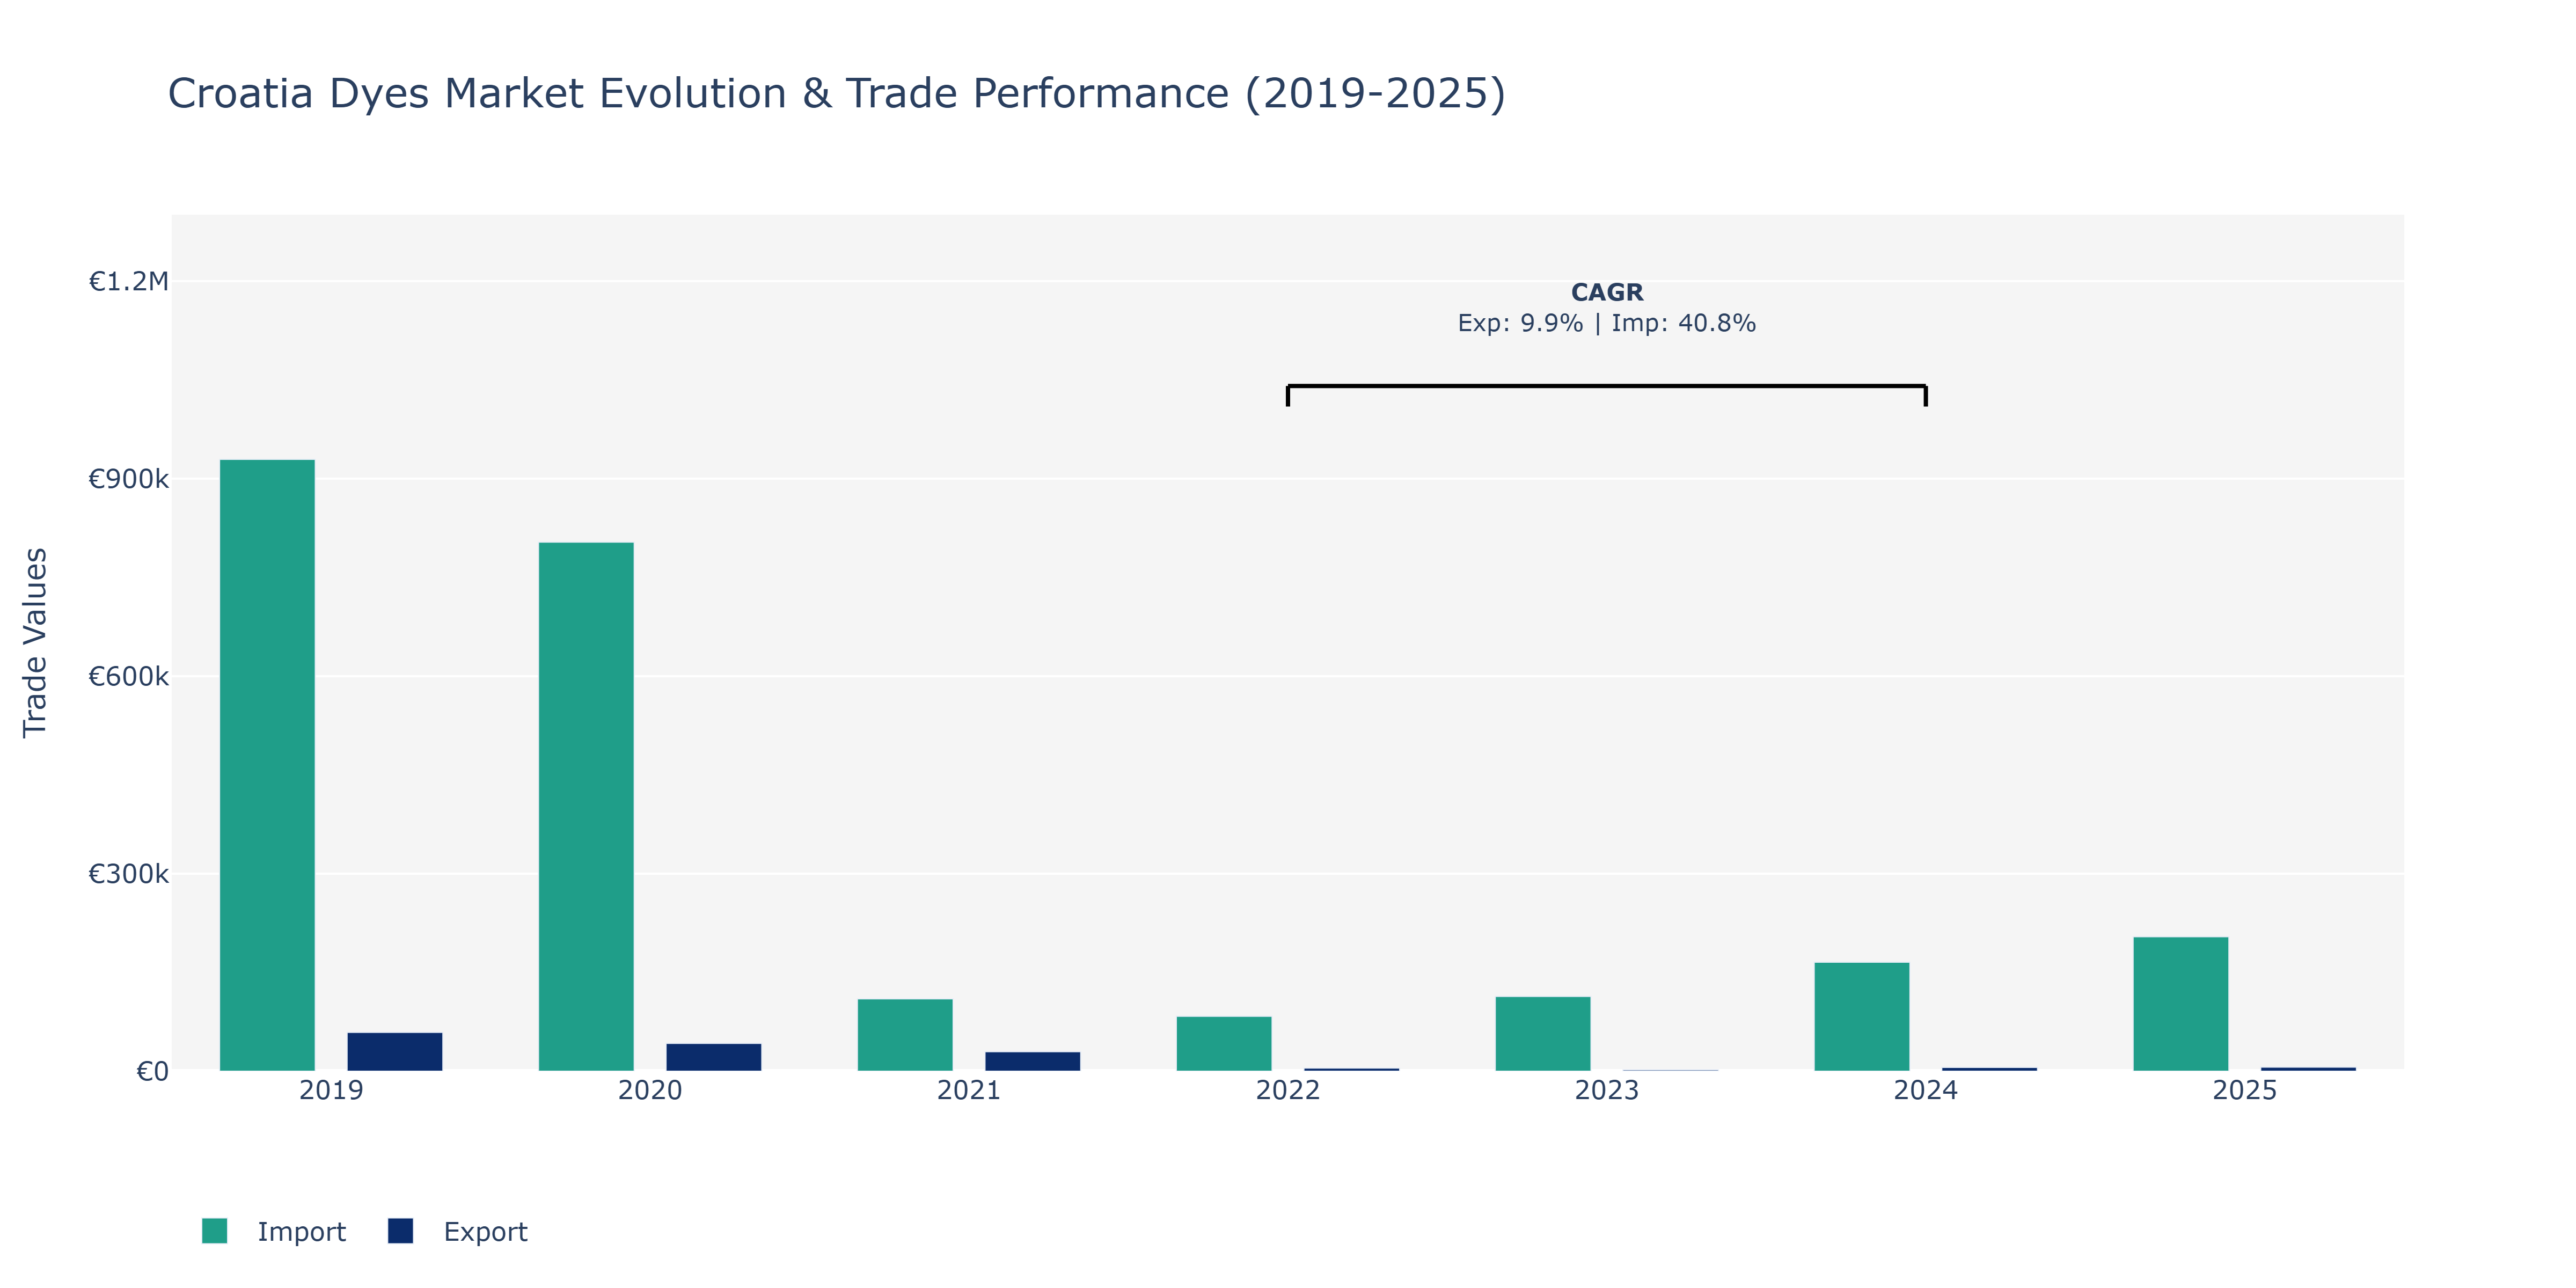
The Croatia Dyes Market witnessed notable fluctuations in Exports and Imports over the years. In 2019, Imports were substantially higher than Exports, with Imports at €929.2 thousand and Exports at €58.91 thousand. However, a shift occurred in 2020, as both Exports and Imports experienced a decline, attributed to global economic uncertainties. In 2021, Exports dropped to €29.46 thousand, while Imports decreased to €109.91 thousand, indicating a continued downward trend. The year 2022 saw a slight recovery in Exports to €4.66 thousand but Imports remained relatively stable at €83.41 thousand. By 2024, Exports increased to €5.63 thousand and Imports surged to €165.45 thousand, showcasing a notable growth in the market. The upward trajectory of Imports can be linked to increasing demand for specialized dyes in Croatia's textile industry, while the fluctuating Exports may reflect evolving market dynamics and competition within the sector. The recent uptick in both Exports and Imports in 2025 suggests a potential rebound and growth opportunities for the Croatia Dyes Market, aligning with the sector's recovery post-pandemic as indicated by industry reports.
Key Highlights of the Report:
- Croatia Dyes Market Outlook
- Market Size of Croatia Dyes Market, 2025
- Forecast of Croatia Dyes Market, 2032
- Historical Data and Forecast of Croatia Dyes Revenues & Volume for the Period 2022 - 2032
- Croatia Dyes Market Trend Evolution
- Croatia Dyes Market Drivers and Challenges
- Croatia Dyes Price Trends
- Croatia Dyes Porter's Five Forces
- Croatia Dyes Industry Life Cycle
- Historical Data and Forecast of Croatia Dyes Market Revenues & Volume By Product Type for the Period 2022 - 2032
- Historical Data and Forecast of Croatia Dyes Market Revenues & Volume By Reactive Dyes for the Period 2022 - 2032
- Historical Data and Forecast of Croatia Dyes Market Revenues & Volume By Disperse Dyes for the Period 2022 - 2032
- Historical Data and Forecast of Croatia Dyes Market Revenues & Volume By Vat Dyes for the Period 2022 - 2032
- Historical Data and Forecast of Croatia Dyes Market Revenues & Volume By Direct Dyes for the Period 2022 - 2032
- Historical Data and Forecast of Croatia Dyes Market Revenues & Volume By Acid Dyes for the Period 2022 - 2032
- Historical Data and Forecast of Croatia Dyes Market Revenues & Volume By Other Dyes for the Period 2022 - 2032
- Historical Data and Forecast of Croatia Dyes Market Revenues & Volume By Application for the Period 2022 - 2032
- Historical Data and Forecast of Croatia Dyes Market Revenues & Volume By Textile for the Period 2022 - 2032
- Historical Data and Forecast of Croatia Dyes Market Revenues & Volume By Leather for the Period 2022 - 2032
- Historical Data and Forecast of Croatia Dyes Market Revenues & Volume By Paper for the Period 2022 - 2032
- Historical Data and Forecast of Croatia Dyes Market Revenues & Volume By Printing Inks for the Period 2022 - 2032
- Historical Data and Forecast of Croatia Dyes Market Revenues & Volume By Other for the Period 2022 - 2032
- Croatia Dyes Import Export Trade Statistics
- Market Opportunity Assessment By Product Type
- Market Opportunity Assessment By Application
- Croatia Dyes Top Companies Market Share
- Croatia Dyes Competitive Benchmarking By Technical and Operational Parameters
- Croatia Dyes Company Profiles
- Croatia Dyes Key Strategic Recommendations
Frequently Asked Questions About the Market Study (FAQs):
6Wresearch actively monitors the Croatia Dyes Market and publishes its comprehensive annual report, highlighting emerging trends, growth drivers, revenue analysis, and forecast outlook. Our insights help businesses to make data-backed strategic decisions with ongoing market dynamics. Our analysts track relevent industries related to the Croatia Dyes Market, allowing our clients with actionable intelligence and reliable forecasts tailored to emerging regional needs.
Yes, we provide customisation as per your requirements. To learn more, feel free to contact us on sales@6wresearch.com
1 Executive Summary |
2 Introduction |
2.1 Key Highlights of the Report |
2.2 Report Description |
2.3 Market Scope & Segmentation |
2.4 Research Methodology |
2.5 Assumptions |
3 Croatia Dyes Market Overview |
3.1 Croatia Country Macro Economic Indicators |
3.2 Croatia Dyes Market Revenues & Volume, 2022 & 2032F |
3.3 Croatia Dyes Market - Industry Life Cycle |
3.4 Croatia Dyes Market - Porter's Five Forces |
3.5 Croatia Dyes Market Revenues & Volume Share, By Product Type, 2022 & 2032F |
3.6 Croatia Dyes Market Revenues & Volume Share, By Application, 2022 & 2032F |
4 Croatia Dyes Market Dynamics |
4.1 Impact Analysis |
4.2 Market Drivers |
4.2.1 Increasing demand for dyes in textile and leather industries |
4.2.2 Growth in the construction sector leading to higher demand for dyes in paints and coatings |
4.2.3 Favorable government policies supporting the chemical industry in Croatia |
4.3 Market Restraints |
4.3.1 Fluctuating prices of raw materials impacting production costs |
4.3.2 Stringent environmental regulations affecting the production and usage of certain types of dyes |
4.3.3 Competition from substitute products like natural dyes or digital printing technologies |
5 Croatia Dyes Market Trends |
6 Croatia Dyes Market, By Types |
6.1 Croatia Dyes Market, By Product Type |
6.1.1 Overview and Analysis |
6.1.2 Croatia Dyes Market Revenues & Volume, By Product Type, 2022 - 2032F |
6.1.3 Croatia Dyes Market Revenues & Volume, By Reactive Dyes, 2022 - 2032F |
6.1.4 Croatia Dyes Market Revenues & Volume, By Disperse Dyes, 2022 - 2032F |
6.1.5 Croatia Dyes Market Revenues & Volume, By Vat Dyes, 2022 - 2032F |
6.1.6 Croatia Dyes Market Revenues & Volume, By Direct Dyes, 2022 - 2032F |
6.1.7 Croatia Dyes Market Revenues & Volume, By Acid Dyes, 2022 - 2032F |
6.1.8 Croatia Dyes Market Revenues & Volume, By Other Dyes, 2022 - 2032F |
6.2 Croatia Dyes Market, By Application |
6.2.1 Overview and Analysis |
6.2.2 Croatia Dyes Market Revenues & Volume, By Textile, 2022 - 2032F |
6.2.3 Croatia Dyes Market Revenues & Volume, By Leather, 2022 - 2032F |
6.2.4 Croatia Dyes Market Revenues & Volume, By Paper, 2022 - 2032F |
6.2.5 Croatia Dyes Market Revenues & Volume, By Printing Inks, 2022 - 2032F |
6.2.6 Croatia Dyes Market Revenues & Volume, By Other, 2022 - 2032F |
7 Croatia Dyes Market Import-Export Trade Statistics |
7.1 Croatia Dyes Market Export to Major Countries |
7.2 Croatia Dyes Market Imports from Major Countries |
8 Croatia Dyes Market Key Performance Indicators |
8.1 Research and development investment in eco-friendly dye technologies |
8.2 Adoption rate of advanced dyeing techniques in the market |
8.3 Percentage of dyes produced meeting environmental standards |
8.4 Innovation rate in product development for new applications of dyes |
9 Croatia Dyes Market - Opportunity Assessment |
9.1 Croatia Dyes Market Opportunity Assessment, By Product Type, 2022 & 2032F |
9.2 Croatia Dyes Market Opportunity Assessment, By Application, 2022 & 2032F |
10 Croatia Dyes Market - Competitive Landscape |
10.1 Croatia Dyes Market Revenue Share, By Companies, 2025 |
10.2 Croatia Dyes Market Competitive Benchmarking, By Operating and Technical Parameters |
11 Company Profiles |
12 Recommendations |
13 Disclaimer |
Global Go To Market Strategy - 2030
Export potential enables firms to identify high-growth global markets with greater confidence by combining advanced trade intelligence with a structured quantitative methodology. The framework analyzes emerging demand trends and country-level import patterns while integrating macroeconomic and trade datasets such as GDP and population forecasts, bilateral import–export flows, tariff structures, elasticity differentials between developed and developing economies, geographic distance, and import demand projections. Using weighted trade values from 2020–2024 as the base period to project country-to-country export potential for 2030, these inputs are operationalized through calculated drivers such as gravity model parameters, tariff impact factors, and projected GDP per-capita growth. Through an analysis of hidden potentials, demand hotspots, and market conditions that are most favorable to success, this method enables firms to focus on target countries, maximize returns, and global expansion with data, backed by accuracy.
By factoring in the projected importer demand gap that is currently unmet and could be potential opportunity, it identifies the potential for the Exporter (Country) among 190 countries, against the general trade analysis, which identifies the biggest importer or exporter.
To discover high-growth global markets and optimize your business strategy:
Click Here
Pricing
- Single User License$ 1,995
- Department License$ 2,400
- Site License$ 3,120
- Global License$ 3,795

Leadership Perspectives from Industry Events
Search
Thought Leadership and Analyst Meet


Our Clients
6WResearch In News
- India Air Conditioner Market Set for Strong Rebound in 2026 After Weather-Led Correction and GST-Driven Recovery: 6Wresearch
- ADAS in India: How Automatic Emergency Braking, Blind Spot Detection & Driver Monitoring are Transforming Road Safety
- Doha a strategic location for EV manufacturing hub: IPA Qatar
- Demand for luxury TVs surging in the GCC, says Samsung
- Empowering Growth: The Thriving Journey of Bangladesh’s Cable Industry
- Demand for luxury TVs surging in the GCC, says Samsung
Latest Reports
- Poland Fire Protection Systems Market (2026-2032)
- Cape Verde Portable Hand-Thrown Extinguisher Market (2026-2032)
- Canada Portable Hand-Thrown Extinguisher Market (2026-2032)
- Cameroon Portable Hand-Thrown Extinguisher Market (2026-2032)
- Burundi Portable Hand-Thrown Extinguisher Market (2026-2032)
- Burkina Faso Portable Hand-Thrown Extinguisher Market (2026-2032)
- Bulgaria Portable Hand-Thrown Extinguisher Market (2026-2032)
- Brunei Portable Hand-Thrown Extinguisher Market (2026-2032)
- Botswana Portable Hand-Thrown Extinguisher Market (2026-2032)
- Bosnia and Herzegovina Portable Hand-Thrown Extinguisher Market (2026-2032)
Industry Events and Analyst Meet

HIMTEX 2026

India Refining Summit 2026

India EV Show 2026

EV tech India Expo 2026

Auto Tech Asia 2026
Whitepaper
- Middle East & Africa Commercial Security Market Click here to view more.
- Middle East & Africa Fire Safety Systems & Equipment Market Click here to view more.
- GCC Drone Market Click here to view more.
- Middle East Lighting Fixture Market Click here to view more.
- GCC Physical & Perimeter Security Market Click here to view more.