Croatia Electrodeionization Market (2025-2031) | Revenue, Value, Segmentation, Companies, Growth, Size, Industry, Forecast, Outlook, Analysis, Share & Trends
Market Forecast By Design (Plate , Frame Construction, Spiral Wound Construction), By End Use Industry (Power Generation, Pharmaceuticals, Electronics & Semiconductor) And Competitive Landscape
| Product Code: ETC5698255 | Publication Date: Nov 2023 | Updated Date: Apr 2026 | Product Type: Market Research Report | |
| Publisher: 6Wresearch | Author: Ravi Bhandari | No. of Pages: 60 | No. of Figures: 30 | No. of Tables: 5 |
Croatia Electrodeionization Market Size (2020-2030)
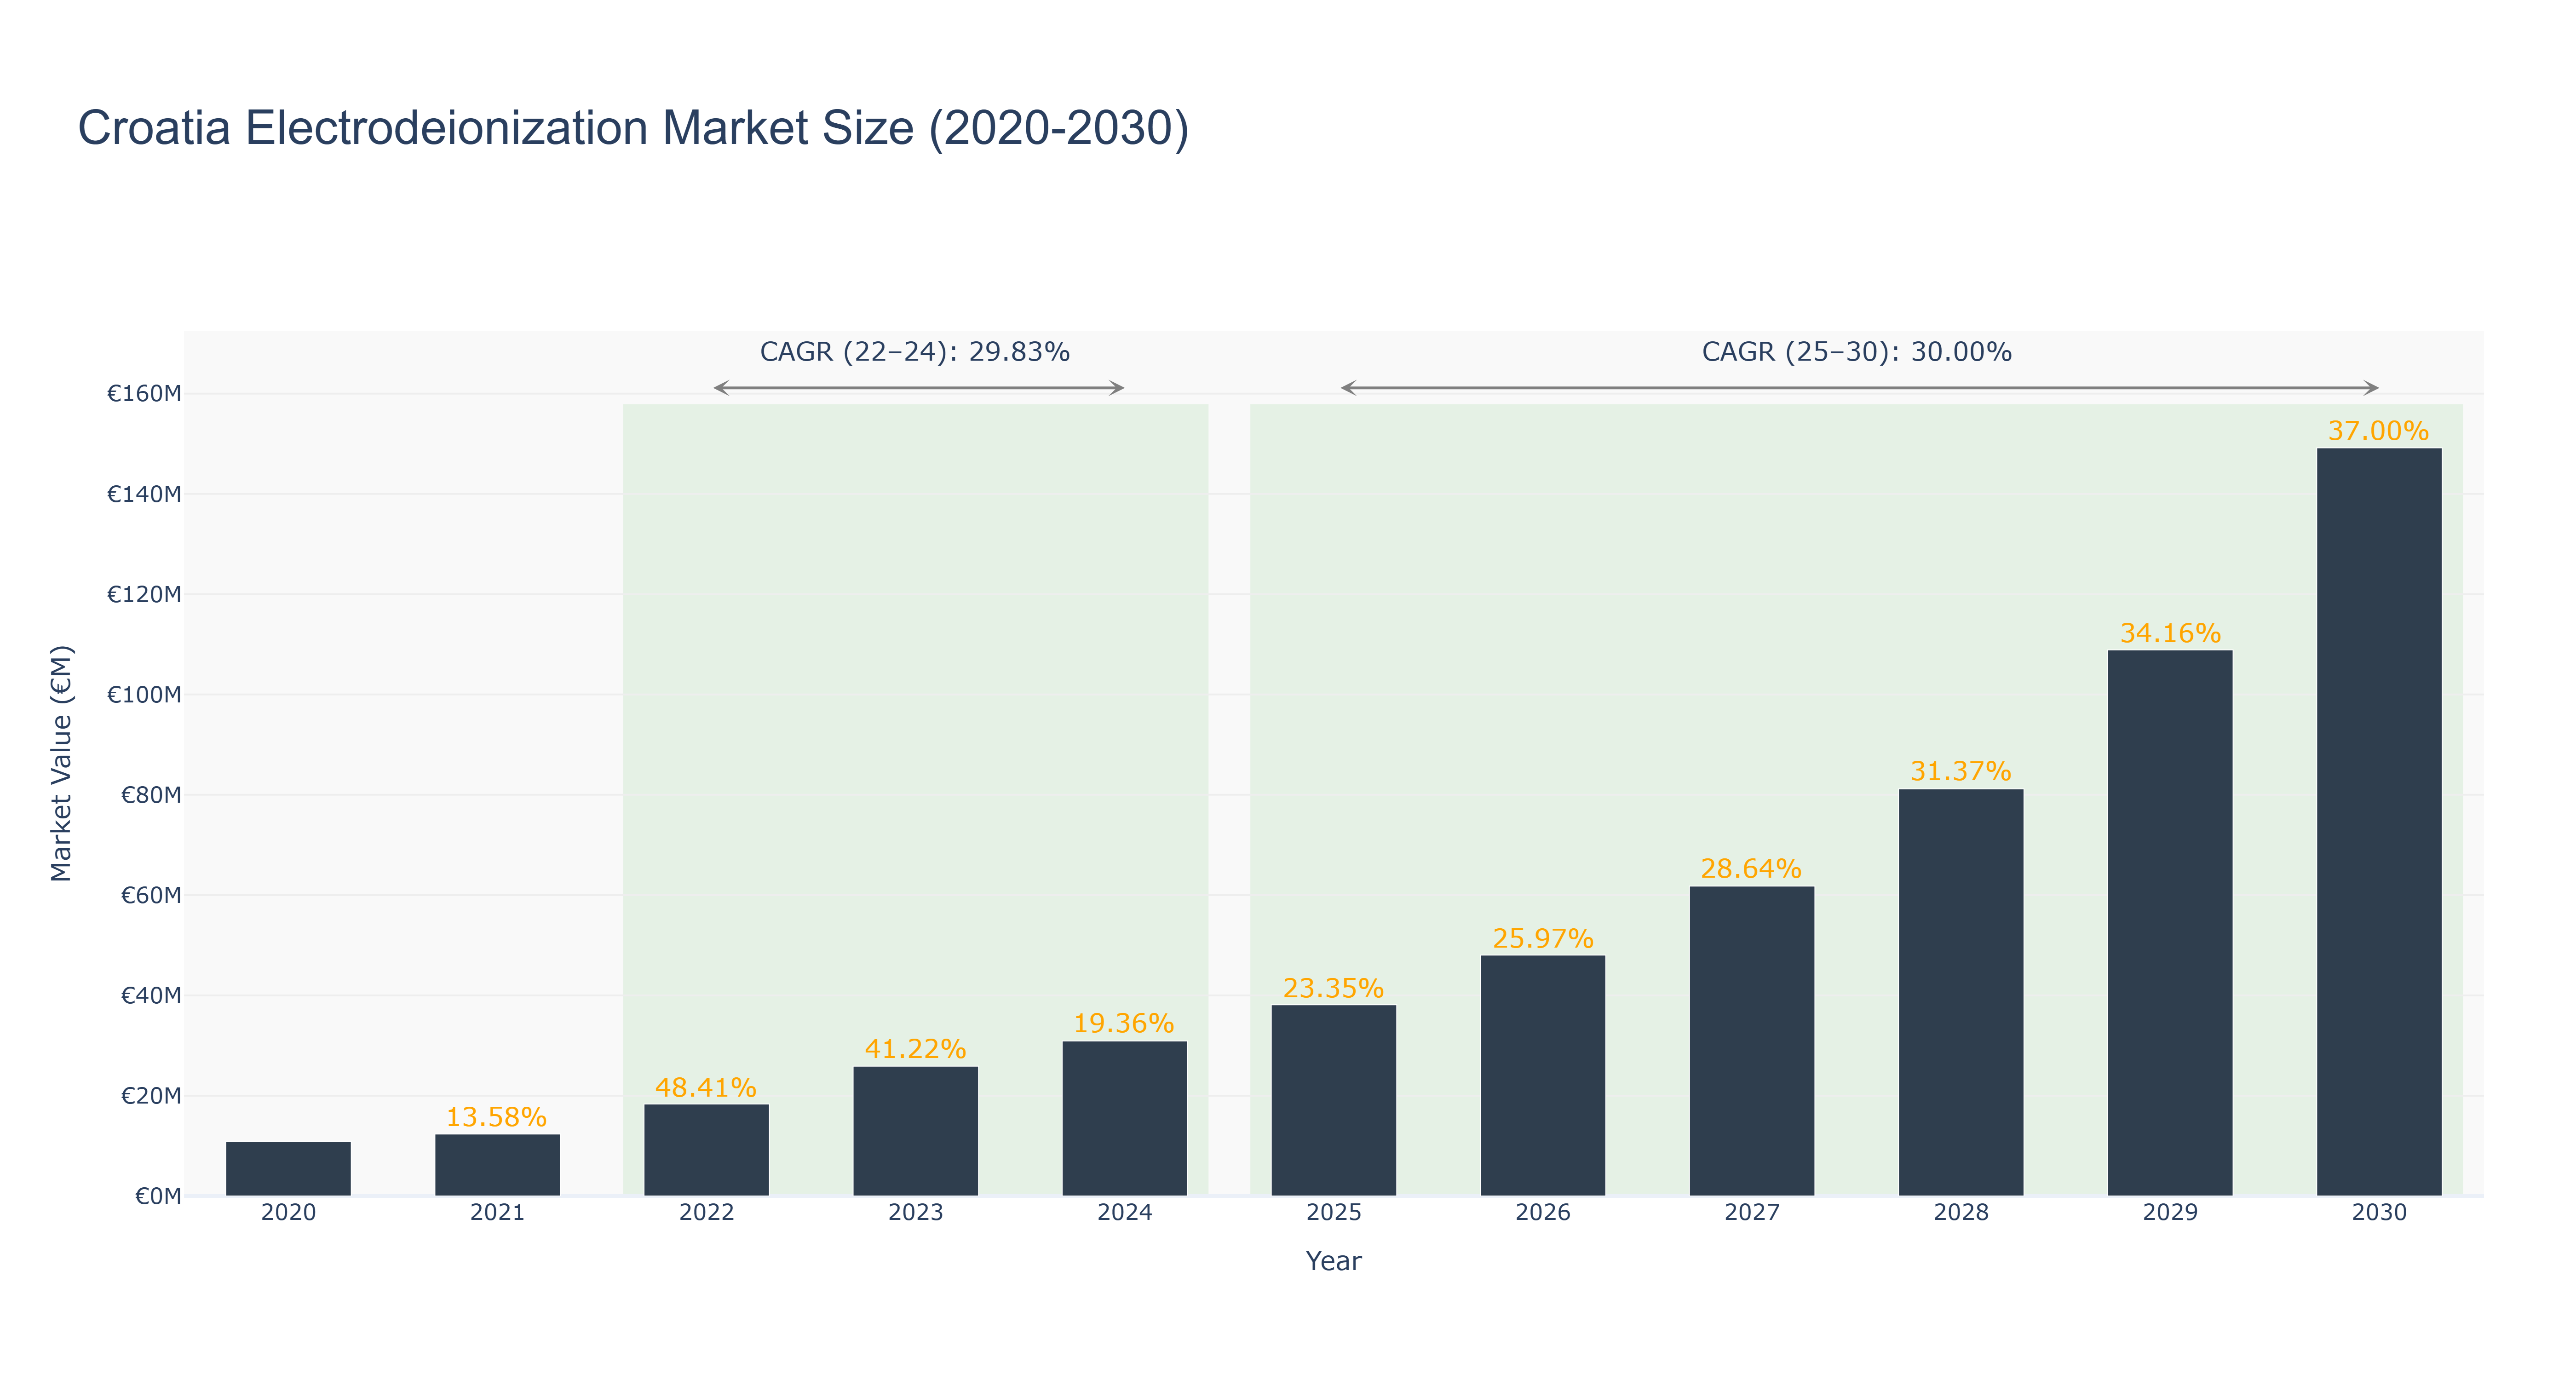
The Croatia Electrodeionization Market experienced significant growth from €10.88 million in 2020 to €30.91 million in 2024, with a remarkable CAGR of 29.83% between 2022 and 2024. This growth trajectory reflects an increasing demand for advanced water purification technologies, driven by heightened environmental regulations and the need for high-quality water in various industries. Transitioning to the forecasted period from 2025 to 2030, the market is projected to expand further, reaching €149.20 million by 2030, with a CAGR of 30.00%. This optimistic outlook is supported by ongoing investments in wastewater treatment infrastructure and the rising adoption of electrodeionization systems in sectors such as pharmaceuticals and food processing. As the market matures, stakeholders must remain agile to capitalize on emerging trends and technological advancements that could shape the future landscape of water treatment solutions in Croatia.
Croatia Electrodeionization Market: Production & Trade Performance (2019-2025)
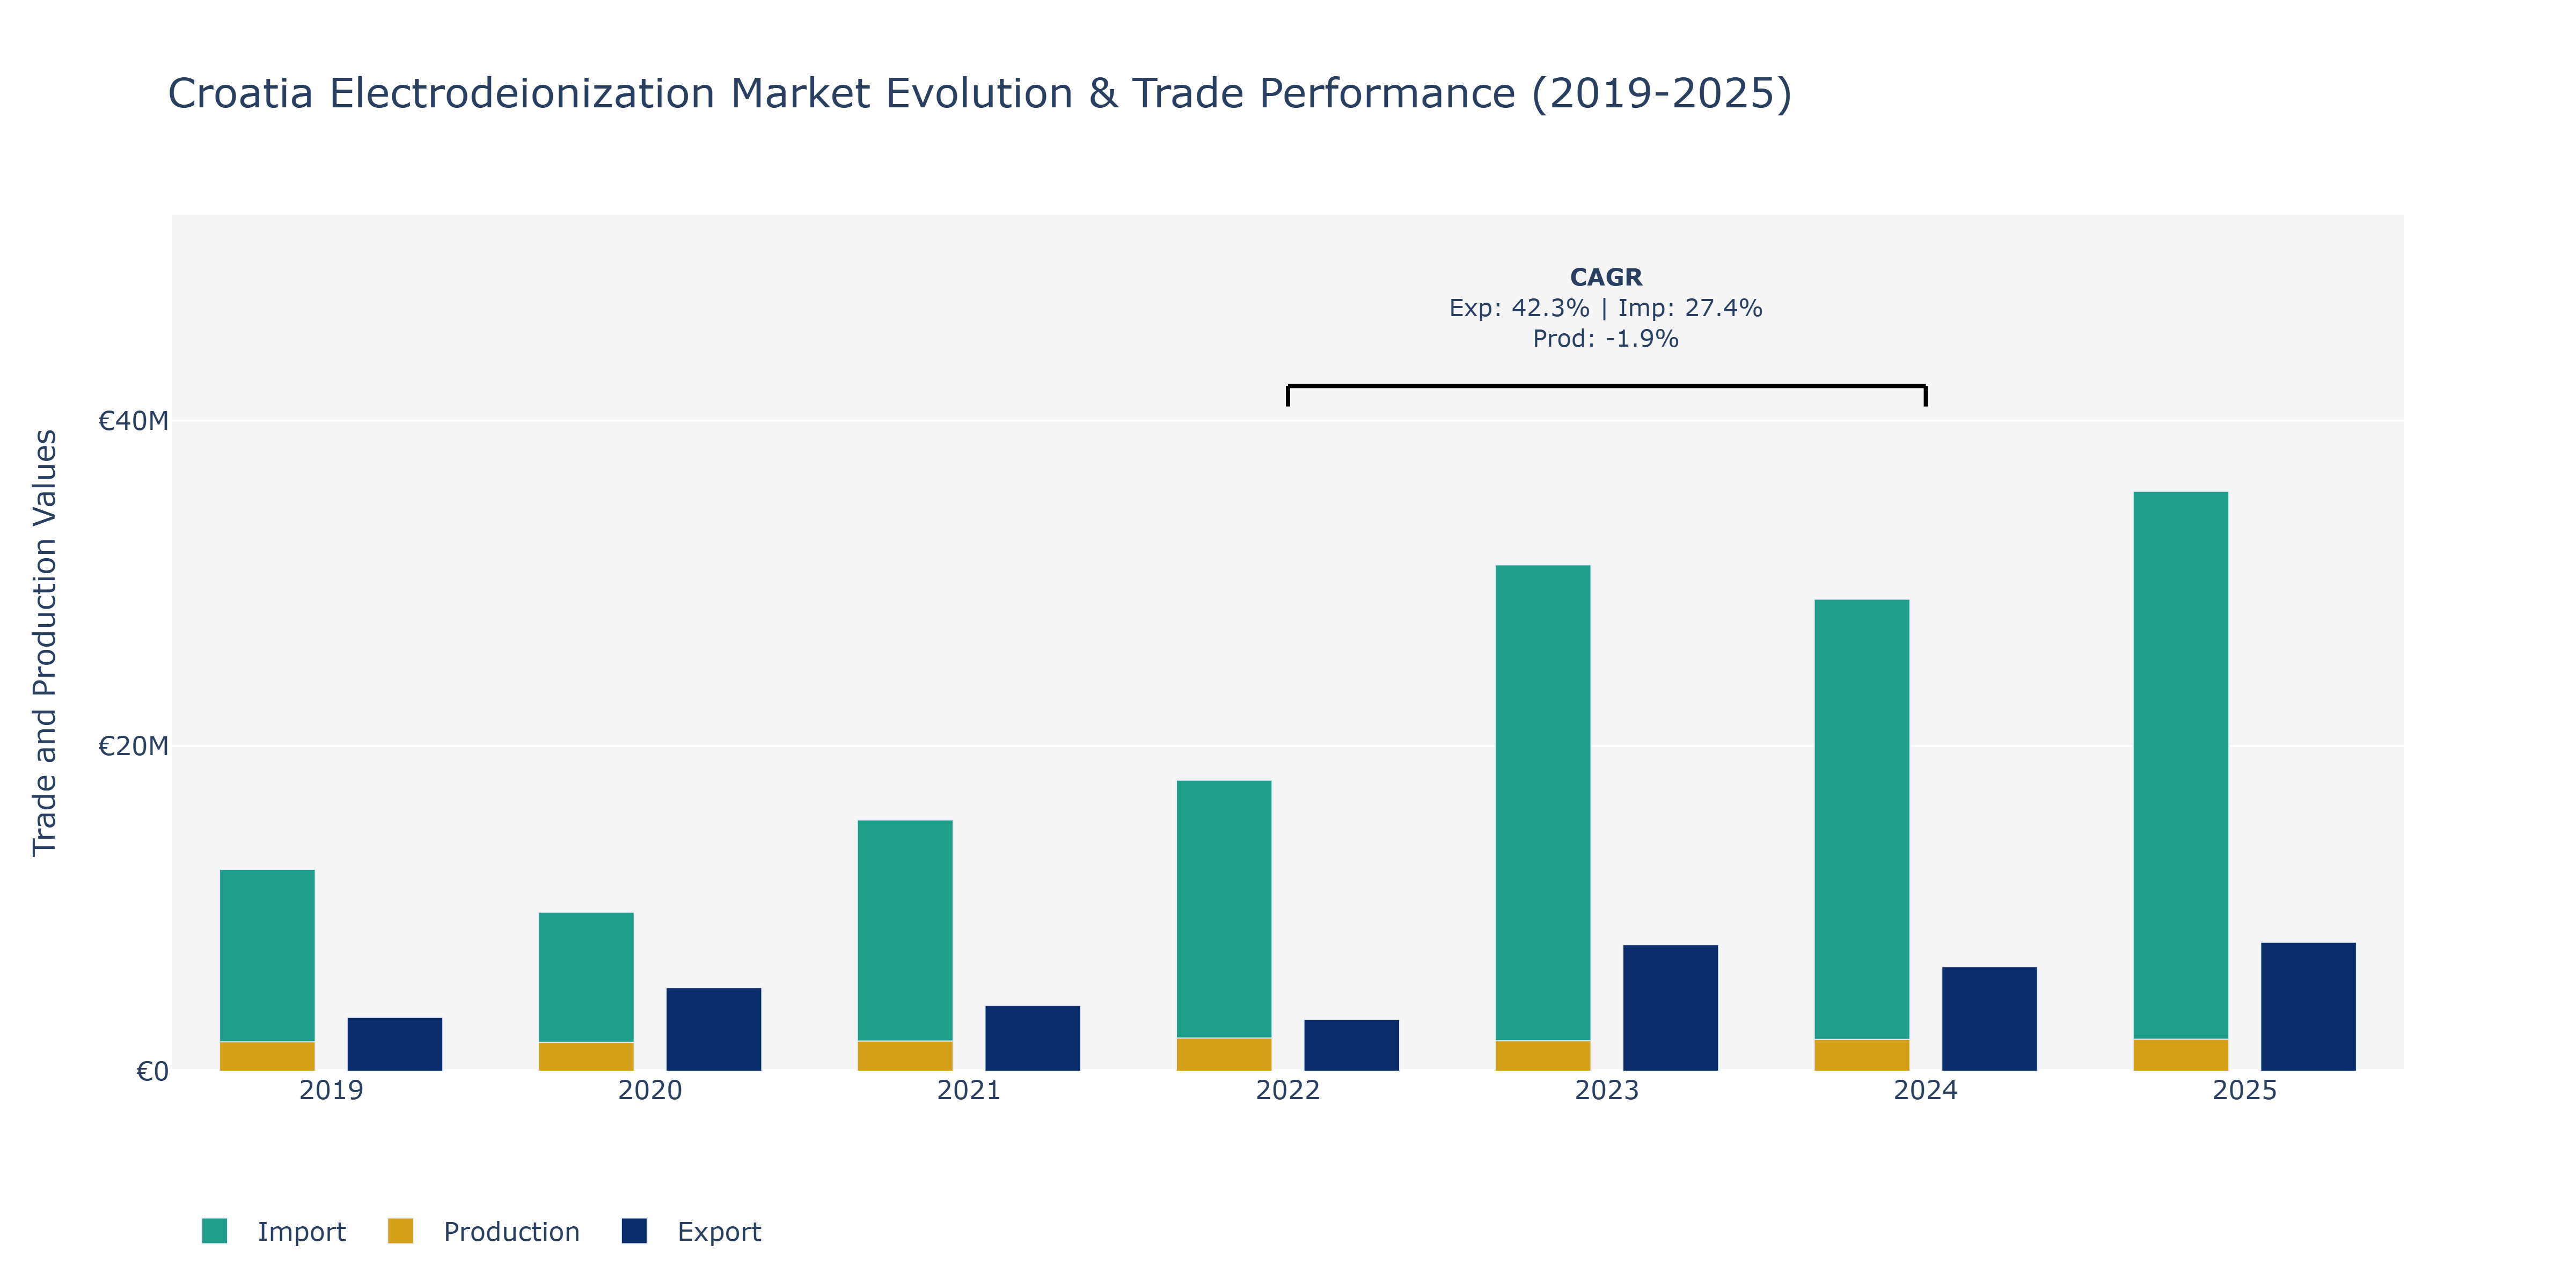
In the Croatia Electrodeionization Market, a notable fluctuation can be observed in Exports, Imports, and Production from 2019 to 2025. Exports experienced a significant increase from €3.31 million in 2019 to €7.93 million in 2025, with a peak in 2023. Conversely, Imports grew steadily from €12.41 million in 2019 to €35.66 million in 2025, showing a continuous upward trend each year. Production, however, exhibited a varied pattern, decreasing slightly from €1.81 million in 2019 to €1.86 million in 2021, before reaching €1.96 million in 2025. The surge in Exports can be attributed to Croatia's technological advancements in electrodeionization systems, catering to a rising global demand for water treatment solutions. The steady growth in Imports reflects the country's increasing reliance on foreign electrodeionization technologies to meet domestic needs. The slight production decline followed by a rebound suggests internal market adjustments and potential shifts in technology adoption within Croatia's electrodeionization sector.
Key Highlights of the Report:
- Croatia Electrodeionization Market Outlook
- Market Size of Croatia Electrodeionization Market, 2024
- Forecast of Croatia Electrodeionization Market, 2031
- Historical Data and Forecast of Croatia Electrodeionization Revenues & Volume for the Period 2021-2031
- Croatia Electrodeionization Market Trend Evolution
- Croatia Electrodeionization Market Drivers and Challenges
- Croatia Electrodeionization Price Trends
- Croatia Electrodeionization Porter`s Five Forces
- Croatia Electrodeionization Industry Life Cycle
- Historical Data and Forecast of Croatia Electrodeionization Market Revenues & Volume By Design for the Period 2021-2031
- Historical Data and Forecast of Croatia Electrodeionization Market Revenues & Volume By Plate for the Period 2021-2031
- Historical Data and Forecast of Croatia Electrodeionization Market Revenues & Volume By Frame Construction for the Period 2021-2031
- Historical Data and Forecast of Croatia Electrodeionization Market Revenues & Volume By Spiral Wound Construction for the Period 2021-2031
- Historical Data and Forecast of Croatia Electrodeionization Market Revenues & Volume By End Use Industry for the Period 2021-2031
- Historical Data and Forecast of Croatia Electrodeionization Market Revenues & Volume By Power Generation for the Period 2021-2031
- Historical Data and Forecast of Croatia Electrodeionization Market Revenues & Volume By Pharmaceuticals for the Period 2021-2031
- Historical Data and Forecast of Croatia Electrodeionization Market Revenues & Volume By Electronics & Semiconductor for the Period 2021-2031
- Croatia Electrodeionization Import Export Trade Statistics
- Market Opportunity Assessment By Design
- Market Opportunity Assessment By End Use Industry
- Croatia Electrodeionization Top Companies Market Share
- Croatia Electrodeionization Competitive Benchmarking By Technical and Operational Parameters
- Croatia Electrodeionization Company Profiles
- Croatia Electrodeionization Key Strategic Recommendations
Frequently Asked Questions About the Market Study (FAQs):
6Wresearch actively monitors the Croatia Electrodeionization Market and publishes its comprehensive annual report, highlighting emerging trends, growth drivers, revenue analysis, and forecast outlook. Our insights help businesses to make data-backed strategic decisions with ongoing market dynamics. Our analysts track relevent industries related to the Croatia Electrodeionization Market, allowing our clients with actionable intelligence and reliable forecasts tailored to emerging regional needs.
Yes, we provide customisation as per your requirements. To learn more, feel free to contact us on sales@6wresearch.com
1 Executive Summary |
2 Introduction |
2.1 Key Highlights of the Report |
2.2 Report Description |
2.3 Market Scope & Segmentation |
2.4 Research Methodology |
2.5 Assumptions |
3 Croatia Electrodeionization Market Overview |
3.1 Croatia Country Macro Economic Indicators |
3.2 Croatia Electrodeionization Market Revenues & Volume, 2021 & 2031F |
3.3 Croatia Electrodeionization Market - Industry Life Cycle |
3.4 Croatia Electrodeionization Market - Porter's Five Forces |
3.5 Croatia Electrodeionization Market Revenues & Volume Share, By Design, 2021 & 2031F |
3.6 Croatia Electrodeionization Market Revenues & Volume Share, By End Use Industry, 2021 & 2031F |
4 Croatia Electrodeionization Market Dynamics |
4.1 Impact Analysis |
4.2 Market Drivers |
4.2.1 Increasing focus on water purification and treatment in Croatia |
4.2.2 Growing awareness about the benefits of electrodeionization technology |
4.2.3 Stringent regulations and standards related to water quality in Croatia |
4.3 Market Restraints |
4.3.1 High initial investment cost for electrodeionization systems |
4.3.2 Lack of skilled professionals to operate and maintain electrodeionization systems |
4.3.3 Competition from other water treatment technologies in the Croatian market |
5 Croatia Electrodeionization Market Trends |
6 Croatia Electrodeionization Market Segmentations |
6.1 Croatia Electrodeionization Market, By Design |
6.1.1 Overview and Analysis |
6.1.2 Croatia Electrodeionization Market Revenues & Volume, By Plate , 2021-2031F |
6.1.3 Croatia Electrodeionization Market Revenues & Volume, By Frame Construction, 2021-2031F |
6.1.4 Croatia Electrodeionization Market Revenues & Volume, By Spiral Wound Construction, 2021-2031F |
6.2 Croatia Electrodeionization Market, By End Use Industry |
6.2.1 Overview and Analysis |
6.2.2 Croatia Electrodeionization Market Revenues & Volume, By Power Generation, 2021-2031F |
6.2.3 Croatia Electrodeionization Market Revenues & Volume, By Pharmaceuticals, 2021-2031F |
6.2.4 Croatia Electrodeionization Market Revenues & Volume, By Electronics & Semiconductor, 2021-2031F |
7 Croatia Electrodeionization Market Import-Export Trade Statistics |
7.1 Croatia Electrodeionization Market Export to Major Countries |
7.2 Croatia Electrodeionization Market Imports from Major Countries |
8 Croatia Electrodeionization Market Key Performance Indicators |
8.1 Percentage increase in the number of electrodeionization system installations in Croatia |
8.2 Average time taken for ROI (Return on Investment) for electrodeionization systems in Croatia |
8.3 Level of compliance with water quality regulations and standards in Croatia |
9 Croatia Electrodeionization Market - Opportunity Assessment |
9.1 Croatia Electrodeionization Market Opportunity Assessment, By Design, 2021 & 2031F |
9.2 Croatia Electrodeionization Market Opportunity Assessment, By End Use Industry, 2021 & 2031F |
10 Croatia Electrodeionization Market - Competitive Landscape |
10.1 Croatia Electrodeionization Market Revenue Share, By Companies, 2024 |
10.2 Croatia Electrodeionization Market Competitive Benchmarking, By Operating and Technical Parameters |
11 Company Profiles |
12 Recommendations | 13 Disclaimer |
Export potential assessment - trade Analytics for 2030
Export potential enables firms to identify high-growth global markets with greater confidence by combining advanced trade intelligence with a structured quantitative methodology. The framework analyzes emerging demand trends and country-level import patterns while integrating macroeconomic and trade datasets such as GDP and population forecasts, bilateral import–export flows, tariff structures, elasticity differentials between developed and developing economies, geographic distance, and import demand projections. Using weighted trade values from 2020–2024 as the base period to project country-to-country export potential for 2030, these inputs are operationalized through calculated drivers such as gravity model parameters, tariff impact factors, and projected GDP per-capita growth. Through an analysis of hidden potentials, demand hotspots, and market conditions that are most favorable to success, this method enables firms to focus on target countries, maximize returns, and global expansion with data, backed by accuracy.
By factoring in the projected importer demand gap that is currently unmet and could be potential opportunity, it identifies the potential for the Exporter (Country) among 190 countries, against the general trade analysis, which identifies the biggest importer or exporter.
To discover high-growth global markets and optimize your business strategy:
Click Here
Pricing
- Single User License$ 1,995
- Department License$ 2,400
- Site License$ 3,120
- Global License$ 3,795

Search
Thought Leadership and Analyst Meet


Our Clients
Latest Reports
- France Thermally Conductive Filler Dispersants Market (2026-2032) | Challenges, Restraints, Value, Share, Size, segmentation, Analysis, Trends, Investment Opportunities, Outlook, Pricing, Demand, Forecast, Revenue, Companies, Growth, Drivers, Strategy, Insights, Competition
- Egypt Thermally Conductive Filler Dispersants Market (2026-2032) | Competition, Forecast, Strategy, Value, Insights, Outlook, Investment Opportunities, Pricing, Demand, Share, segmentation, Drivers, Size, Companies, Restraints, Growth, Trends, Revenue, Challenges, Analysis
- Czech Republic Thermally Conductive Filler Dispersants Market (2026-2032) | Forecast, Pricing, Analysis, Drivers, Insights, Size, Demand, Growth, Challenges, segmentation, Competition, Outlook, Trends, Investment Opportunities, Companies, Strategy, Revenue, Share, Value, Restraints
- Colombia Thermally Conductive Filler Dispersants Market (2026-2032) | segmentation, Trends, Share, Drivers, Strategy, Companies, Demand, Insights, Size, Challenges, Value, Competition, Analysis, Growth, Revenue, Restraints, Forecast, Pricing, Outlook, Investment Opportunities
- China Thermally Conductive Filler Dispersants Market (2026-2032) | Restraints, Investment Opportunities, Pricing, Companies, Share, Size, Challenges, Trends, Outlook, Value, Analysis, Competition, Revenue, Drivers, Forecast, Demand, Insights, Growth, Strategy, segmentation
- Chile Thermally Conductive Filler Dispersants Market (2026-2032) | Investment Opportunities, Trends, Value, Restraints, Share, Companies, Forecast, segmentation, Pricing, Challenges, Demand, Size, Analysis, Drivers, Outlook, Growth, Competition, Strategy, Revenue, Insights
- Cambodia Thermally Conductive Filler Dispersants Market (2026-2032) | Analysis, Share, Outlook, Strategy, Pricing, Demand, Size, Growth, segmentation, Insights, Revenue, Forecast, Challenges, Competition, Companies, Investment Opportunities, Trends, Restraints, Value, Drivers
- Brazil Thermally Conductive Filler Dispersants Market (2026-2032) | Restraints, Forecast, Competition, Size, Revenue, Value, Investment Opportunities, Trends, Insights, Outlook, Growth, Analysis, Drivers, segmentation, Pricing, Challenges, Strategy, Share, Companies, Demand
- Bangladesh Thermally Conductive Filler Dispersants Market (2026-2032) | Restraints, Trends, Analysis, Competition, Insights, Forecast, Value, Investment Opportunities, Pricing, Share, Demand, Outlook, Revenue, segmentation, Companies, Drivers, Growth, Size, Challenges, Strategy
- Bahrain Thermally Conductive Filler Dispersants Market (2026-2032) | Trends, Outlook, Pricing, Demand, Value, Competition, Forecast, Growth, segmentation, Revenue, Companies, Analysis, Insights, Size, Drivers, Challenges, Strategy, Investment Opportunities, Share, Restraints
Industry Events and Analyst Meet

HIMTEX 2026

India Refining Summit 2026

India EV Show 2026

EV tech India Expo 2026

Auto Tech Asia 2026
Whitepaper
- Middle East & Africa Commercial Security Market Click here to view more.
- Middle East & Africa Fire Safety Systems & Equipment Market Click here to view more.
- GCC Drone Market Click here to view more.
- Middle East Lighting Fixture Market Click here to view more.
- GCC Physical & Perimeter Security Market Click here to view more.
6WResearch In News
- Doha a strategic location for EV manufacturing hub: IPA Qatar
- Demand for luxury TVs surging in the GCC, says Samsung
- Empowering Growth: The Thriving Journey of Bangladesh’s Cable Industry
- Demand for luxury TVs surging in the GCC, says Samsung
- Video call with a traditional healer? Once unthinkable, it’s now common in South Africa
- Intelligent Buildings To Smooth GCC’s Path To Net Zero