Croatia Erucic Acid Market (2026-2032) | Forecast, Size, Outlook, Growth, Share, Analysis, Value, Revenue, Trends, Segmentation, Companies & Industry
Market Forecast By Grade (Erucic acid 43-50%, Erucic acid >50%), By Application (Slip Agent, Emollient, Hair care and textile softening, Pour point depressant, Lubricants, Food emulsifier, Others), By Source (Rapeseed oil, Canola, Tame Mustard, Fish, Others), By End Users (Plastic, Printing Ink, Food, Personal Care, Rubber, Pharmaceutical, Others) And Competitive Landscape
| Product Code: ETC5343829 | Publication Date: Nov 2023 | Updated Date: Apr 2026 | Product Type: Market Research Report | |
| Publisher: 6Wresearch | Author: Ravi Bhandari | No. of Pages: 60 | No. of Figures: 30 | No. of Tables: 5 |
Croatia Erucic Acid Market Size (2020-2030)
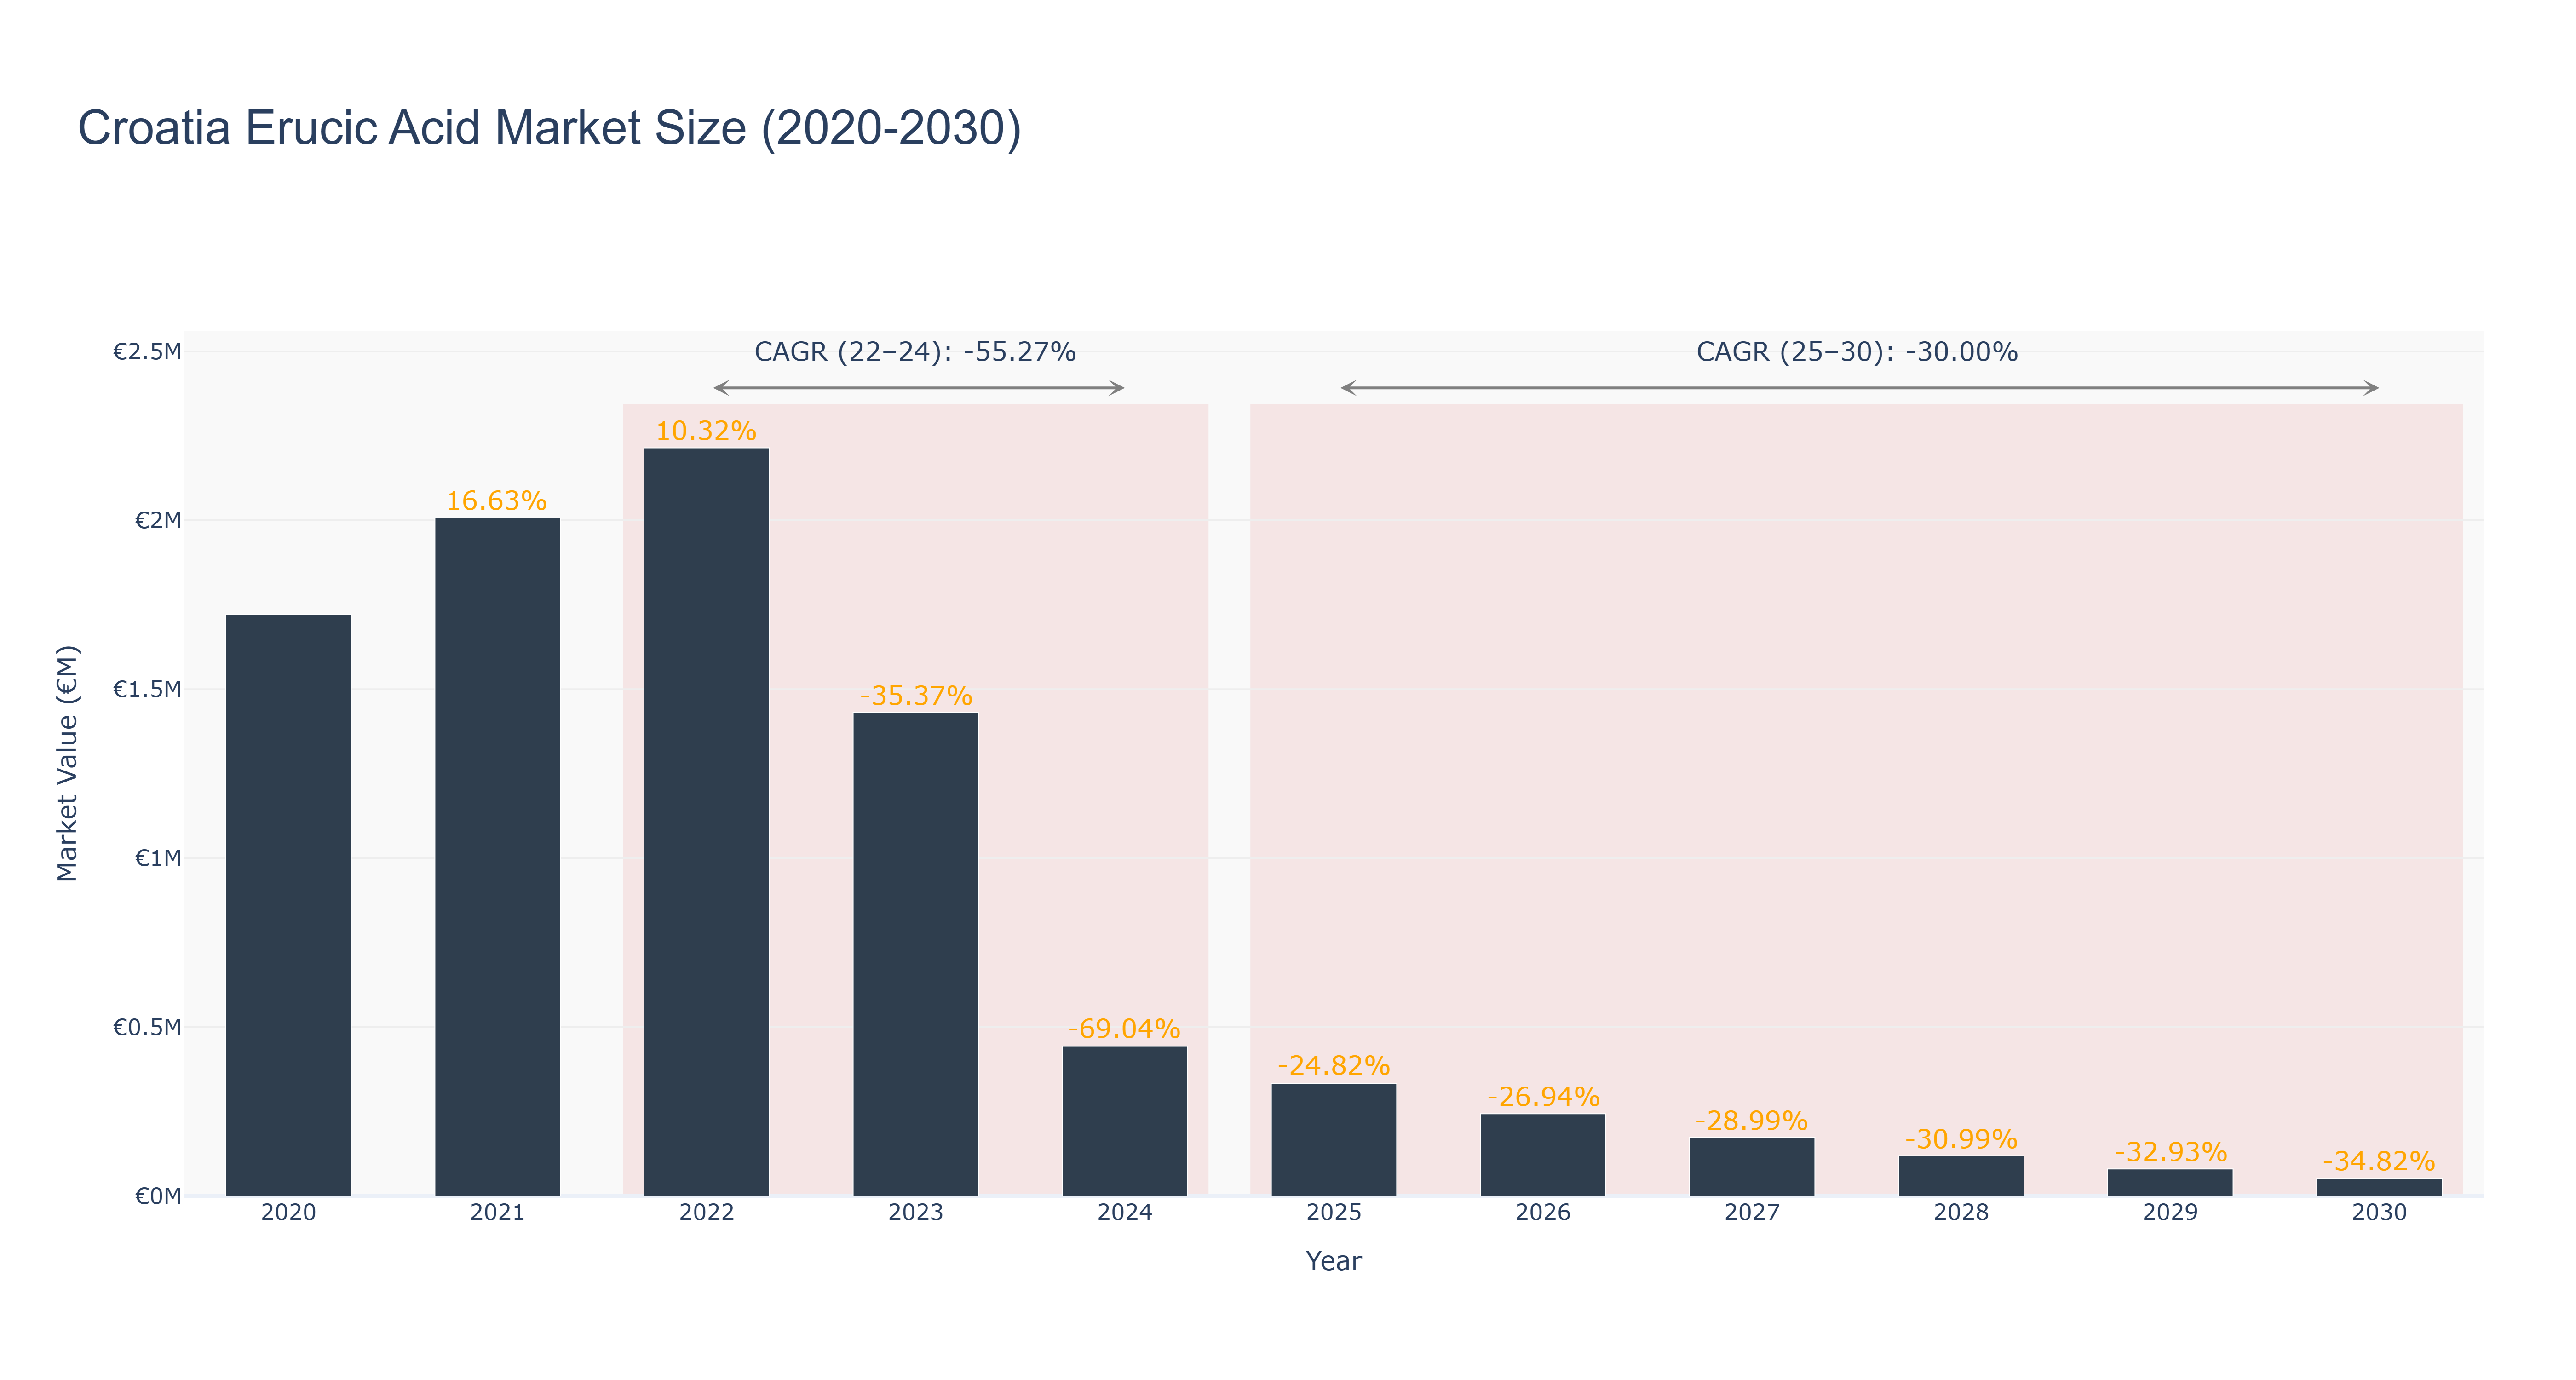
Croatia Erucic Acid Market has experienced a significant decline in market size from €1.72 million in 2020 to €0.44 million in 2024, with a negative CAGR of -55.27% during 2022-24. The downward trend continued until 2030, with the market size forecasted to be €0.05 million, indicating a CAGR of -30.0% during 2025-30. The market faced challenges due to factors such as changing consumer preferences towards alternative products and regulatory restrictions impacting production. However, recent developments in sustainable production methods and increased demand for eco-friendly products are expected to drive growth in the future. The introduction of new technologies for efficient extraction processes and collaborations with key players in the industry are anticipated to revitalize the Croatia Erucic Acid Market in the coming years.
Croatia Erucic Acid Market: Production & Trade Performance (2019-2025)
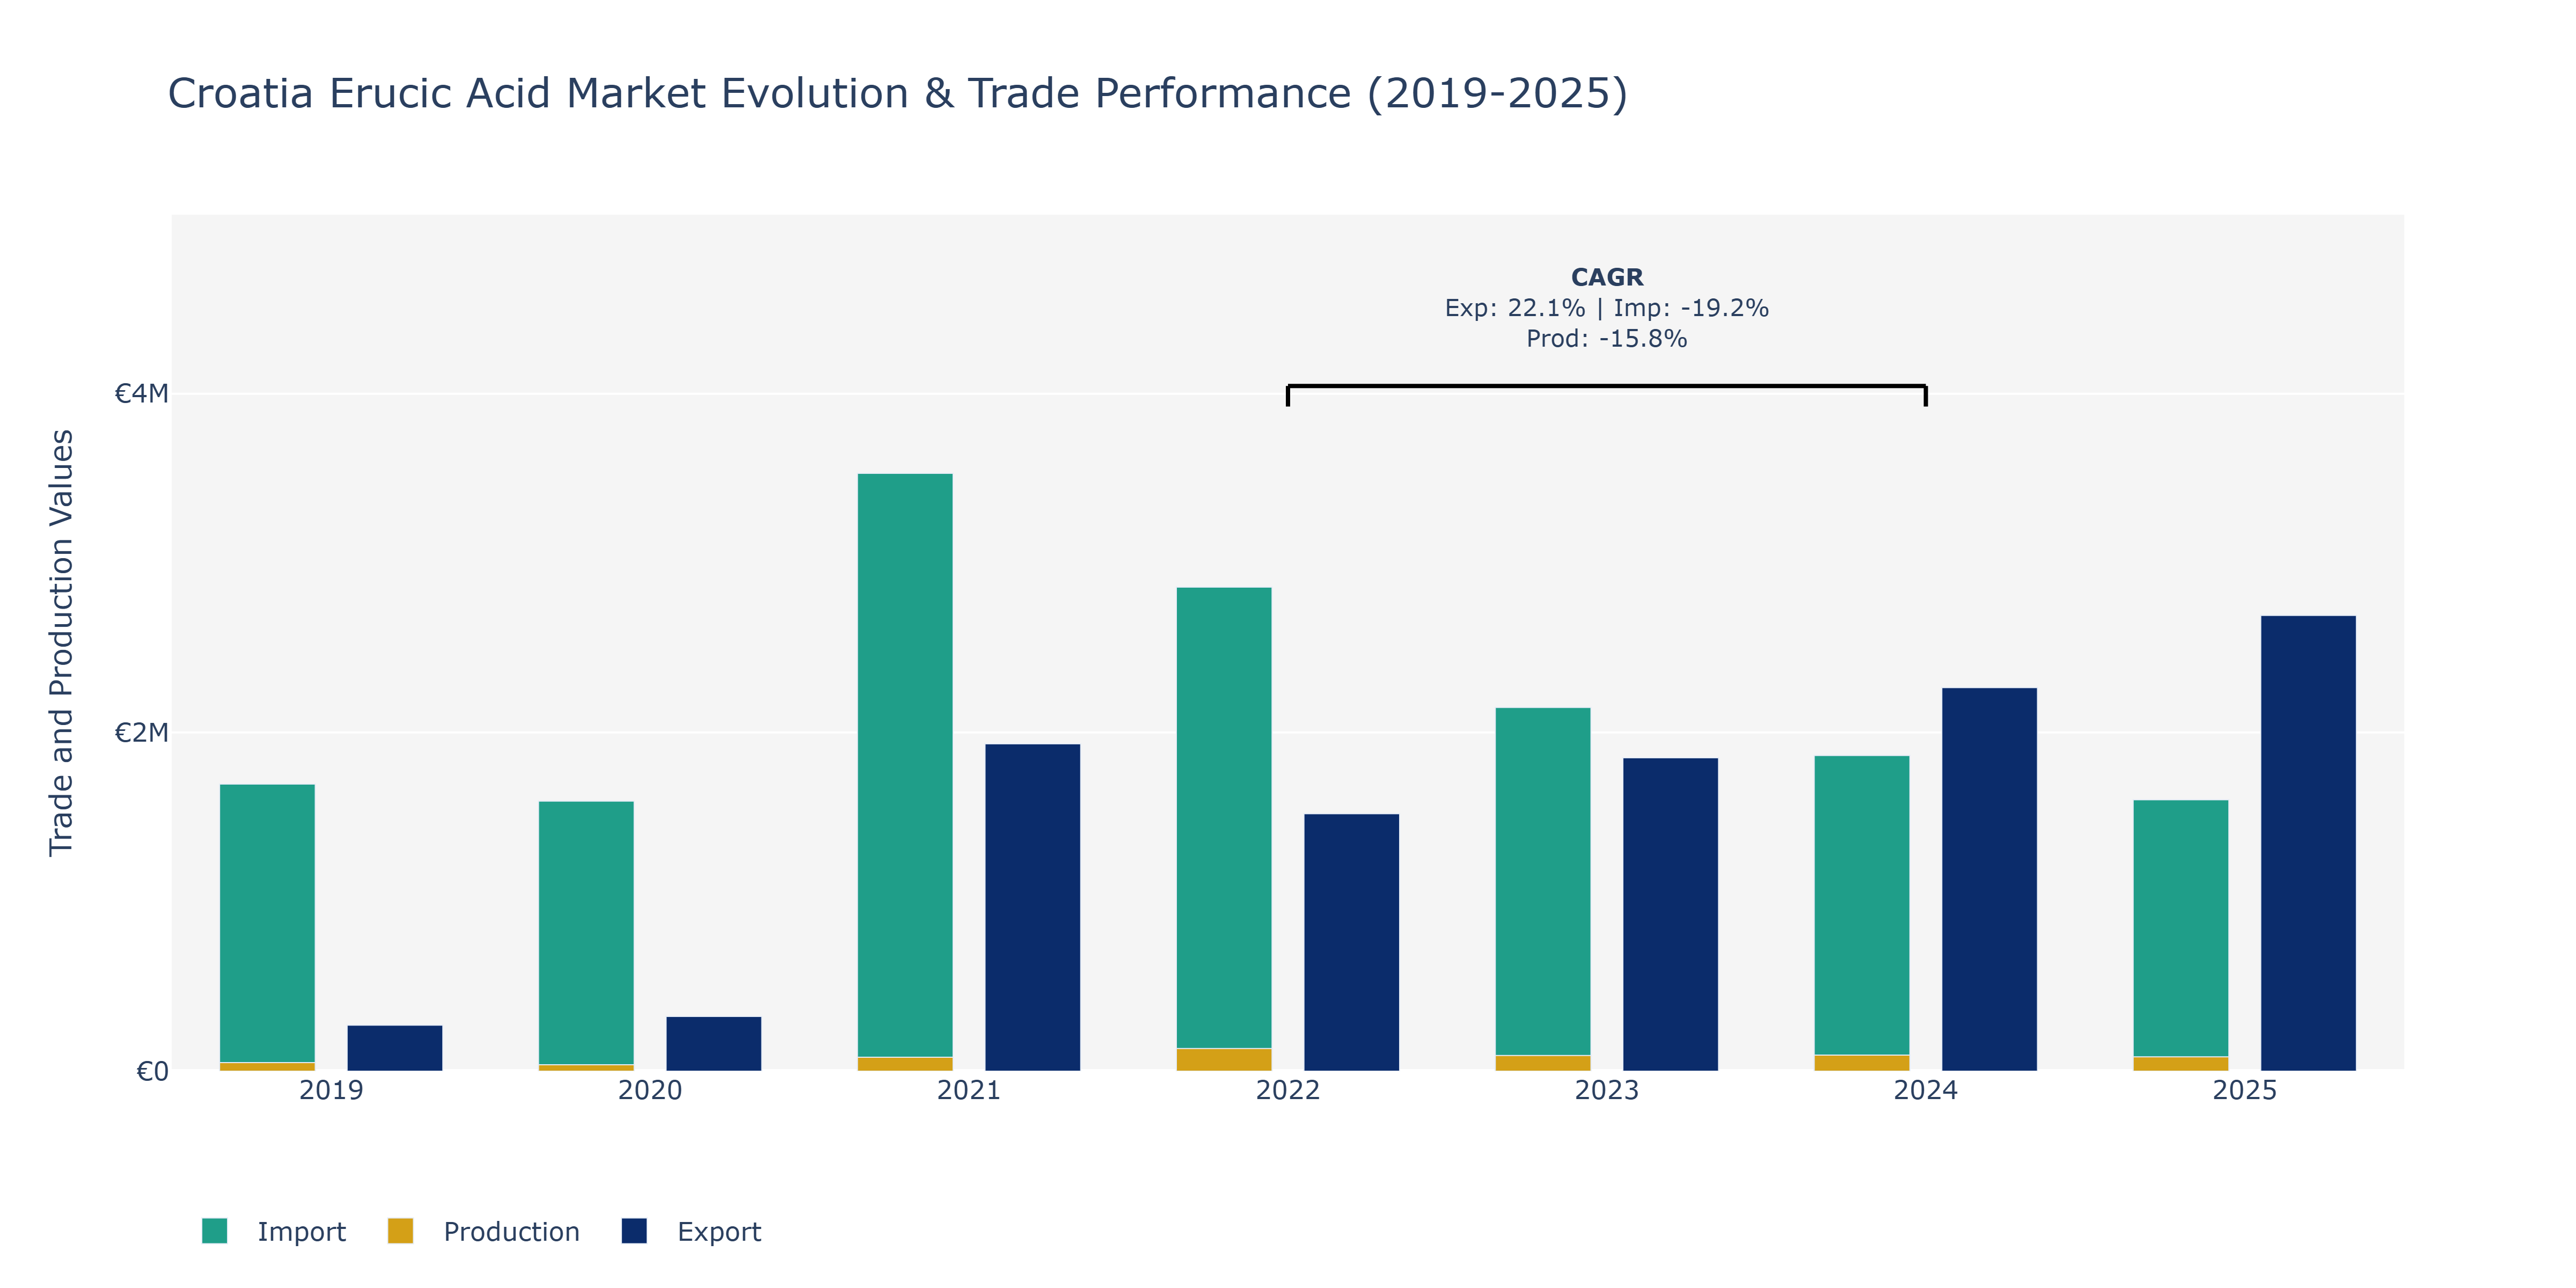
In the Croatia Erucic Acid Market, exports experienced a notable fluctuation over the years, starting at €271.94 thousand in 2019, peaking at €2.69 million in 2025. This substantial increase could be attributed to enhanced production capacities and strategic market expansion efforts. Conversely, imports followed a different trend, declining from €1.7 million in 2019 to €1.6 million in 2025, possibly due to a shift towards prioritizing domestic production or changes in global trade dynamics impacting import volumes. Production levels showcased a varied pattern, from €51.12 thousand in 2019 to €95.00 million in 2024, with a subsequent slight decline in 2025 to €84.36 million. This dip might reflect adjustments in production techniques or regulatory changes influencing output efficiency. The market's export growth aligns with the rising global demand for erucic acid in various industrial applications, while import fluctuations could be linked to trade agreements or shifts in sourcing strategies for raw materials.
Key Highlights of the Report:
- Croatia Erucic Acid Market Outlook
- Market Size of Croatia Erucic Acid Market, 2025
- Forecast of Croatia Erucic Acid Market, 2032
- Historical Data and Forecast of Croatia Erucic Acid Revenues & Volume for the Period 2022 - 2032F
- Croatia Erucic Acid Market Trend Evolution
- Croatia Erucic Acid Market Drivers and Challenges
- Croatia Erucic Acid Price Trends
- Croatia Erucic Acid Porter`s Five Forces
- Croatia Erucic Acid Industry Life Cycle
- Historical Data and Forecast of Croatia Erucic Acid Market Revenues & Volume By Grade for the Period 2022 - 2032F
- Historical Data and Forecast of Croatia Erucic Acid Market Revenues & Volume By Erucic acid 43-50% for the Period 2022 - 2032F
- Historical Data and Forecast of Croatia Erucic Acid Market Revenues & Volume By Erucic acid >50% for the Period 2022 - 2032F
- Historical Data and Forecast of Croatia Erucic Acid Market Revenues & Volume By Application for the Period 2022 - 2032F
- Historical Data and Forecast of Croatia Erucic Acid Market Revenues & Volume By Slip Agent for the Period 2022 - 2032F
- Historical Data and Forecast of Croatia Erucic Acid Market Revenues & Volume By Emollient for the Period 2022 - 2032F
- Historical Data and Forecast of Croatia Erucic Acid Market Revenues & Volume By Hair care and textile softening for the Period 2022 - 2032F
- Historical Data and Forecast of Croatia Erucic Acid Market Revenues & Volume By Pour point depressant for the Period 2022 - 2032F
- Historical Data and Forecast of Croatia Erucic Acid Market Revenues & Volume By Lubricants for the Period 2022 - 2032F
- Historical Data and Forecast of Croatia Erucic Acid Market Revenues & Volume By Food emulsifier for the Period 2022 - 2032F
- Historical Data and Forecast of Croatia Erucic Acid Market Revenues & Volume By Others for the Period 2022 - 2032F
- Historical Data and Forecast of Croatia Erucic Acid Market Revenues & Volume By Source for the Period 2022 - 2032F
- Historical Data and Forecast of Croatia Erucic Acid Market Revenues & Volume By Rapeseed oil for the Period 2022 - 2032F
- Historical Data and Forecast of Croatia Erucic Acid Market Revenues & Volume By Canola for the Period 2022 - 2032F
- Historical Data and Forecast of Croatia Erucic Acid Market Revenues & Volume By Tame Mustard for the Period 2022 - 2032F
- Historical Data and Forecast of Croatia Erucic Acid Market Revenues & Volume By Fish for the Period 2022 - 2032F
- Historical Data and Forecast of Croatia Erucic Acid Market Revenues & Volume By Others for the Period 2022 - 2032F
- Historical Data and Forecast of Croatia Erucic Acid Market Revenues & Volume By End Users for the Period 2022 - 2032F
- Historical Data and Forecast of Croatia Erucic Acid Market Revenues & Volume By Plastic for the Period 2022 - 2032F
- Historical Data and Forecast of Croatia Erucic Acid Market Revenues & Volume By Printing Ink for the Period 2022 - 2032F
- Historical Data and Forecast of Croatia Erucic Acid Market Revenues & Volume By Food for the Period 2022 - 2032F
- Historical Data and Forecast of Croatia Erucic Acid Market Revenues & Volume By Personal Care for the Period 2022 - 2032F
- Historical Data and Forecast of Croatia Erucic Acid Market Revenues & Volume By Rubber for the Period 2022 - 2032F
- Historical Data and Forecast of Croatia Erucic Acid Market Revenues & Volume By Pharmaceutical for the Period 2022 - 2032F
- Historical Data and Forecast of Croatia Erucic Acid Market Revenues & Volume By Others for the Period 2022 - 2032F
- Croatia Erucic Acid Import Export Trade Statistics
- Market Opportunity Assessment By Grade
- Market Opportunity Assessment By Application
- Market Opportunity Assessment By Source
- Market Opportunity Assessment By End Users
- Croatia Erucic Acid Top Companies Market Share
- Croatia Erucic Acid Competitive Benchmarking By Technical and Operational Parameters
- Croatia Erucic Acid Company Profiles
- Croatia Erucic Acid Key Strategic Recommendations
Frequently Asked Questions About the Market Study (FAQs):
6Wresearch actively monitors the Croatia Erucic Acid Market and publishes its comprehensive annual report, highlighting emerging trends, growth drivers, revenue analysis, and forecast outlook. Our insights help businesses to make data-backed strategic decisions with ongoing market dynamics. Our analysts track relevent industries related to the Croatia Erucic Acid Market, allowing our clients with actionable intelligence and reliable forecasts tailored to emerging regional needs.
Yes, we provide customisation as per your requirements. To learn more, feel free to contact us on sales@6wresearch.com
1 Executive Summary |
2 Introduction |
2.1 Key Highlights of the Report |
2.2 Report Description |
2.3 Market Scope & Segmentation |
2.4 Research Methodology |
2.5 Assumptions |
3 Croatia Erucic Acid Market Overview |
3.1 Croatia Country Macro Economic Indicators |
3.2 Croatia Erucic Acid Market Revenues & Volume, 2022 & 2032F |
3.3 Croatia Erucic Acid Market - Industry Life Cycle |
3.4 Croatia Erucic Acid Market - Porter's Five Forces |
3.5 Croatia Erucic Acid Market Revenues & Volume Share, By Grade, 2022 & 2032F |
3.6 Croatia Erucic Acid Market Revenues & Volume Share, By Application, 2022 & 2032F |
3.7 Croatia Erucic Acid Market Revenues & Volume Share, By Source, 2022 & 2032F |
3.8 Croatia Erucic Acid Market Revenues & Volume Share, By End Users, 2022 & 2032F |
4 Croatia Erucic Acid Market Dynamics |
4.1 Impact Analysis |
4.2 Market Drivers |
4.2.1 Increasing demand for erucic acid in the food industry for its various applications such as in food additives and flavorings. |
4.2.2 Growing awareness about the health benefits of erucic acid, leading to its use in pharmaceuticals and nutraceuticals. |
4.2.3 Rise in demand for erucic acid-based products in the cosmetics and personal care industry due to its moisturizing properties. |
4.3 Market Restraints |
4.3.1 Fluctuating prices of raw materials used in the production of erucic acid, impacting the overall cost of manufacturing. |
4.3.2 Stringent regulations regarding the use of erucic acid in certain regions, affecting market penetration. |
4.3.3 Competition from alternative products with similar functionalities, posing a challenge to market growth. |
5 Croatia Erucic Acid Market Trends |
6 Croatia Erucic Acid Market Segmentations |
6.1 Croatia Erucic Acid Market, By Grade |
6.1.1 Overview and Analysis |
6.1.2 Croatia Erucic Acid Market Revenues & Volume, By Erucic acid 43-50%, 2022 - 2032F |
6.1.3 Croatia Erucic Acid Market Revenues & Volume, By Erucic acid >50%, 2022 - 2032F |
6.2 Croatia Erucic Acid Market, By Application |
6.2.1 Overview and Analysis |
6.2.2 Croatia Erucic Acid Market Revenues & Volume, By Slip Agent, 2022 - 2032F |
6.2.3 Croatia Erucic Acid Market Revenues & Volume, By Emollient, 2022 - 2032F |
6.2.4 Croatia Erucic Acid Market Revenues & Volume, By Hair care and textile softening, 2022 - 2032F |
6.2.5 Croatia Erucic Acid Market Revenues & Volume, By Pour point depressant, 2022 - 2032F |
6.2.6 Croatia Erucic Acid Market Revenues & Volume, By Lubricants, 2022 - 2032F |
6.2.7 Croatia Erucic Acid Market Revenues & Volume, By Food emulsifier, 2022 - 2032F |
6.3 Croatia Erucic Acid Market, By Source |
6.3.1 Overview and Analysis |
6.3.2 Croatia Erucic Acid Market Revenues & Volume, By Rapeseed oil, 2022 - 2032F |
6.3.3 Croatia Erucic Acid Market Revenues & Volume, By Canola, 2022 - 2032F |
6.3.4 Croatia Erucic Acid Market Revenues & Volume, By Tame Mustard, 2022 - 2032F |
6.3.5 Croatia Erucic Acid Market Revenues & Volume, By Fish, 2022 - 2032F |
6.3.6 Croatia Erucic Acid Market Revenues & Volume, By Others, 2022 - 2032F |
6.4 Croatia Erucic Acid Market, By End Users |
6.4.1 Overview and Analysis |
6.4.2 Croatia Erucic Acid Market Revenues & Volume, By Plastic, 2022 - 2032F |
6.4.3 Croatia Erucic Acid Market Revenues & Volume, By Printing Ink, 2022 - 2032F |
6.4.4 Croatia Erucic Acid Market Revenues & Volume, By Food, 2022 - 2032F |
6.4.5 Croatia Erucic Acid Market Revenues & Volume, By Personal Care, 2022 - 2032F |
6.4.6 Croatia Erucic Acid Market Revenues & Volume, By Rubber, 2022 - 2032F |
6.4.7 Croatia Erucic Acid Market Revenues & Volume, By Pharmaceutical, 2022 - 2032F |
7 Croatia Erucic Acid Market Import-Export Trade Statistics |
7.1 Croatia Erucic Acid Market Export to Major Countries |
7.2 Croatia Erucic Acid Market Imports from Major Countries |
8 Croatia Erucic Acid Market Key Performance Indicators |
8.1 Research and development investments in new applications and formulations of erucic acid. |
8.2 Adoption rate of erucic acid in emerging industries such as biotechnology and renewable energy. |
8.3 Number of patents filed for innovative processes or technologies related to erucic acid production. |
8.4 Consumer perception and acceptance of erucic acid-based products in different market segments. |
9 Croatia Erucic Acid Market - Opportunity Assessment |
9.1 Croatia Erucic Acid Market Opportunity Assessment, By Grade, 2022 & 2032F |
9.2 Croatia Erucic Acid Market Opportunity Assessment, By Application, 2022 & 2032F |
9.3 Croatia Erucic Acid Market Opportunity Assessment, By Source, 2022 & 2032F |
9.4 Croatia Erucic Acid Market Opportunity Assessment, By End Users, 2022 & 2032F |
10 Croatia Erucic Acid Market - Competitive Landscape |
10.1 Croatia Erucic Acid Market Revenue Share, By Companies, 2025 |
10.2 Croatia Erucic Acid Market Competitive Benchmarking, By Operating and Technical Parameters |
11 Company Profiles |
12 Recommendations | 13 Disclaimer |
Export potential assessment - trade Analytics for 2030
Export potential enables firms to identify high-growth global markets with greater confidence by combining advanced trade intelligence with a structured quantitative methodology. The framework analyzes emerging demand trends and country-level import patterns while integrating macroeconomic and trade datasets such as GDP and population forecasts, bilateral import–export flows, tariff structures, elasticity differentials between developed and developing economies, geographic distance, and import demand projections. Using weighted trade values from 2020–2024 as the base period to project country-to-country export potential for 2030, these inputs are operationalized through calculated drivers such as gravity model parameters, tariff impact factors, and projected GDP per-capita growth. Through an analysis of hidden potentials, demand hotspots, and market conditions that are most favorable to success, this method enables firms to focus on target countries, maximize returns, and global expansion with data, backed by accuracy.
By factoring in the projected importer demand gap that is currently unmet and could be potential opportunity, it identifies the potential for the Exporter (Country) among 190 countries, against the general trade analysis, which identifies the biggest importer or exporter.
To discover high-growth global markets and optimize your business strategy:
Click Here
Pricing
- Single User License$ 1,995
- Department License$ 2,400
- Site License$ 3,120
- Global License$ 3,795

Search
Thought Leadership and Analyst Meet


Our Clients
Latest Reports
- Canada Cloud CFD Market (2026-2032) | Size & Revenue, Industry, Growth, Competitive Landscape, Forecast, Segmentation, Value, Outlook, Trends, Share, Analysis, Companies
- Taiwan Food Delivery Platform Market (2026-2032) | Companies, Outlook, Analysis, Trends, Value, Revenue, Segmentation, Share, Forecast, Competitive Landscape, Growth, Size & Forecast
- United Kingdom (UK) Long-term Care Insurance Market (2026-2032) | Growth, Share, Consumer Insights, Drivers, Opportunities, Competition, Pricing Analysis, Segments, Restraints, Companies, Competitive, Value, Outlook, Size, Demand, Analysis, Challenges, Strategic Insights, Investment Trends, Revenue, Trends, Supply, Forecast
- United Kingdom (UK) Long Term Care Market (2026-2032) | Companies, Outlook, Analysis, Trends, Value, Revenue, Segmentation, Share, Forecast, Competitive Landscape, Growth, Size & Forecast
- Iraq Insulation and Waterproofing Market (2026-2032) | Outlook, Drivers, Growth, Size, Share, Industry, Revenue, Trends, Demand, Competitive, Strategic Insights, Opportunities, Segments, Companies, Challenges, Strategy, Consumer Insights, Analysis, Investment Trends, Value, Segmentation, Forecast, Restraints
- India Switchgear Market Outlook (2026-2032) | Size, Share, Trends, Growth, Revenue, Forecast, Analysis, Value, Outlook
- Pakistan Contraceptive Implants Market (2025-2031) | Demand, Growth, Size, Share, Industry, Pricing Analysis, Competitive, Strategic Insights, Strategy, Consumer Insights, Analysis, Investment Trends, Opportunities, Revenue, Segments, Value, Segmentation, Supply, Forecast, Restraints, Outlook, Competition, Drivers, Trends, Companies, Challenges
- Sri Lanka Packaging Market (2026-2032) | Outlook, Competition, Drivers, Trends, Demand, Pricing Analysis, Competitive, Strategic Insights, Companies, Challenges, Strategy, Consumer Insights, Analysis, Investment Trends, Opportunities, Growth, Size, Share, Industry, Revenue, Segments, Value, Segmentation, Supply, Forecast, Restraints
- India Kids Watches Market (2026-2032) | Strategy, Consumer Insights, Analysis, Investment Trends, Opportunities, Growth, Size, Share, Industry, Revenue, Segments, Value, Segmentation, Supply, Forecast, Restraints, Outlook, Competition, Drivers, Trends, Demand, Pricing Analysis, Competitive, Strategic Insights, Companies, Challenges
- Saudi Arabia Core Assurance Service Market (2025-2031) | Strategy, Consumer Insights, Analysis, Investment Trends, Opportunities, Growth, Size, Share, Industry, Revenue, Segments, Value, Segmentation, Supply, Forecast, Restraints, Outlook, Competition, Drivers, Trends, Demand, Pricing Analysis, Competitive, Strategic Insights, Companies, Challenges
Industry Events and Analyst Meet

India EV Show 2026

EV tech India Expo 2026

Auto Tech Asia 2026

Battery Tech India 2026

Smart Production Solutions Guangzhou 2026
Whitepaper
- Middle East & Africa Commercial Security Market Click here to view more.
- Middle East & Africa Fire Safety Systems & Equipment Market Click here to view more.
- GCC Drone Market Click here to view more.
- Middle East Lighting Fixture Market Click here to view more.
- GCC Physical & Perimeter Security Market Click here to view more.
6WResearch In News
- Doha a strategic location for EV manufacturing hub: IPA Qatar
- Demand for luxury TVs surging in the GCC, says Samsung
- Empowering Growth: The Thriving Journey of Bangladesh’s Cable Industry
- Demand for luxury TVs surging in the GCC, says Samsung
- Video call with a traditional healer? Once unthinkable, it’s now common in South Africa
- Intelligent Buildings To Smooth GCC’s Path To Net Zero