Croatia Fully Automatic Vending Machines Market (2026-2032) | Analysis, Companies, Competitive Landscape, Forecast, Growth, Segmentation, Value, Trends, Share, Industry, Outlook, Size & Revenue
Market Forecast By Type (Beverage Machines, Snacks Machines, Sanitary Napkin Machines, Ticket Machines, Water Machines, Others (Cigarette Machines, etc.)), By Operational Mode (Single Product Vending Machine, Multiple Product Vending Machine), By End-user (Industrial, Commercial, Shopping Malls and Retail Stores, Corporate Offices/Banks, Hotels & Restaurants, Educational Institutions, Others (Sports Stadiums, etc.)), By Distribution Channel (Direct Sales, Indirect Sales) And Competitive Landscape
| Product Code: ETC6851834 | Publication Date: Sep 2024 | Updated Date: Apr 2026 | Product Type: Market Research Report | |
| Publisher: 6Wresearch | Author: Vasudha | No. of Pages: 75 | No. of Figures: 35 | No. of Tables: 20 |
Croatia Fully Automatic Vending Machines Market Size (2020-2030)
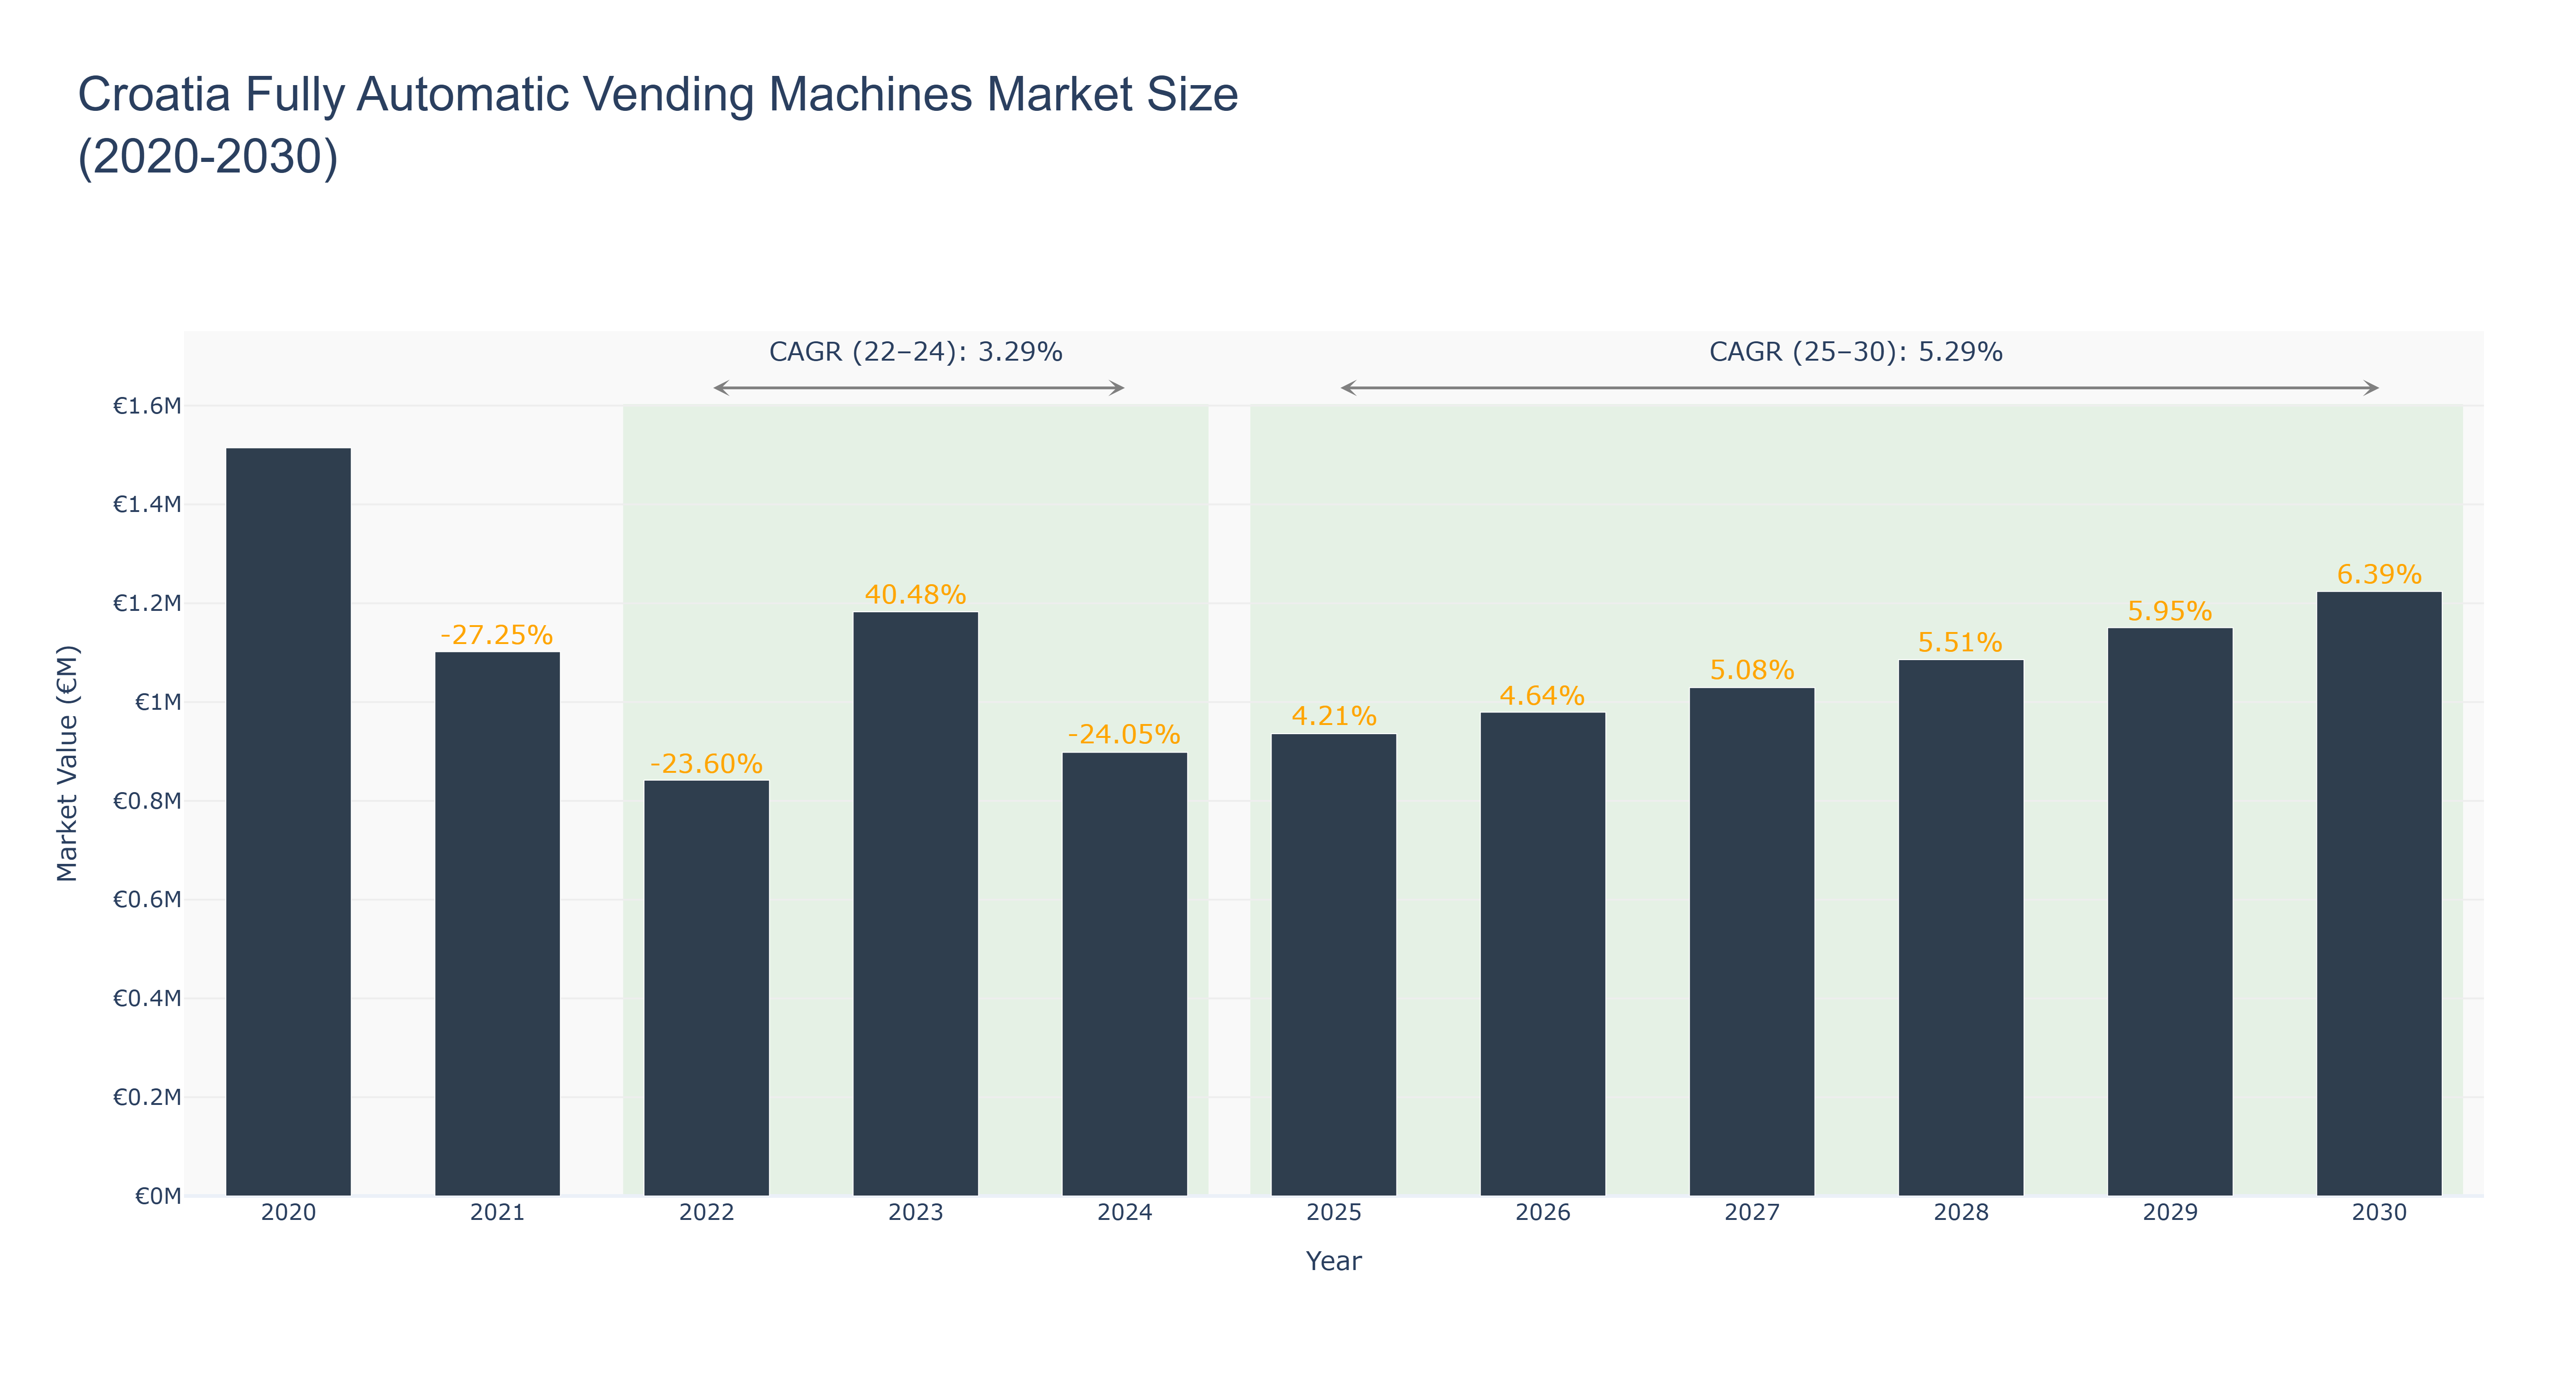
Croatia Fully Automatic Vending Machines Market has seen fluctuations in market size over the past decade. The peak market size of €1.51 million was observed in 2020, followed by a decline to €0.84 million in 2022. The market rebounded in 2023 to reach €1.18 million, showing a significant growth of 40.48%. Subsequently, the market experienced a dip in 2024 to €0.90 million, before stabilizing and showing steady growth from 2025 onwards. The forecasted market size is expected to reach €1.22 million in 2030 with a CAGR of 5.29% from 2025 to 2030. The market's growth can be attributed to increasing demand for automated services and convenience in the vending industry. In the near future, Croatia is set to introduce new regulations promoting the use of fully automatic vending machines in public spaces to enhance accessibility and customer experience.
Croatia Fully Automatic Vending Machines Market: Production & Trade Performance (2019-2025)
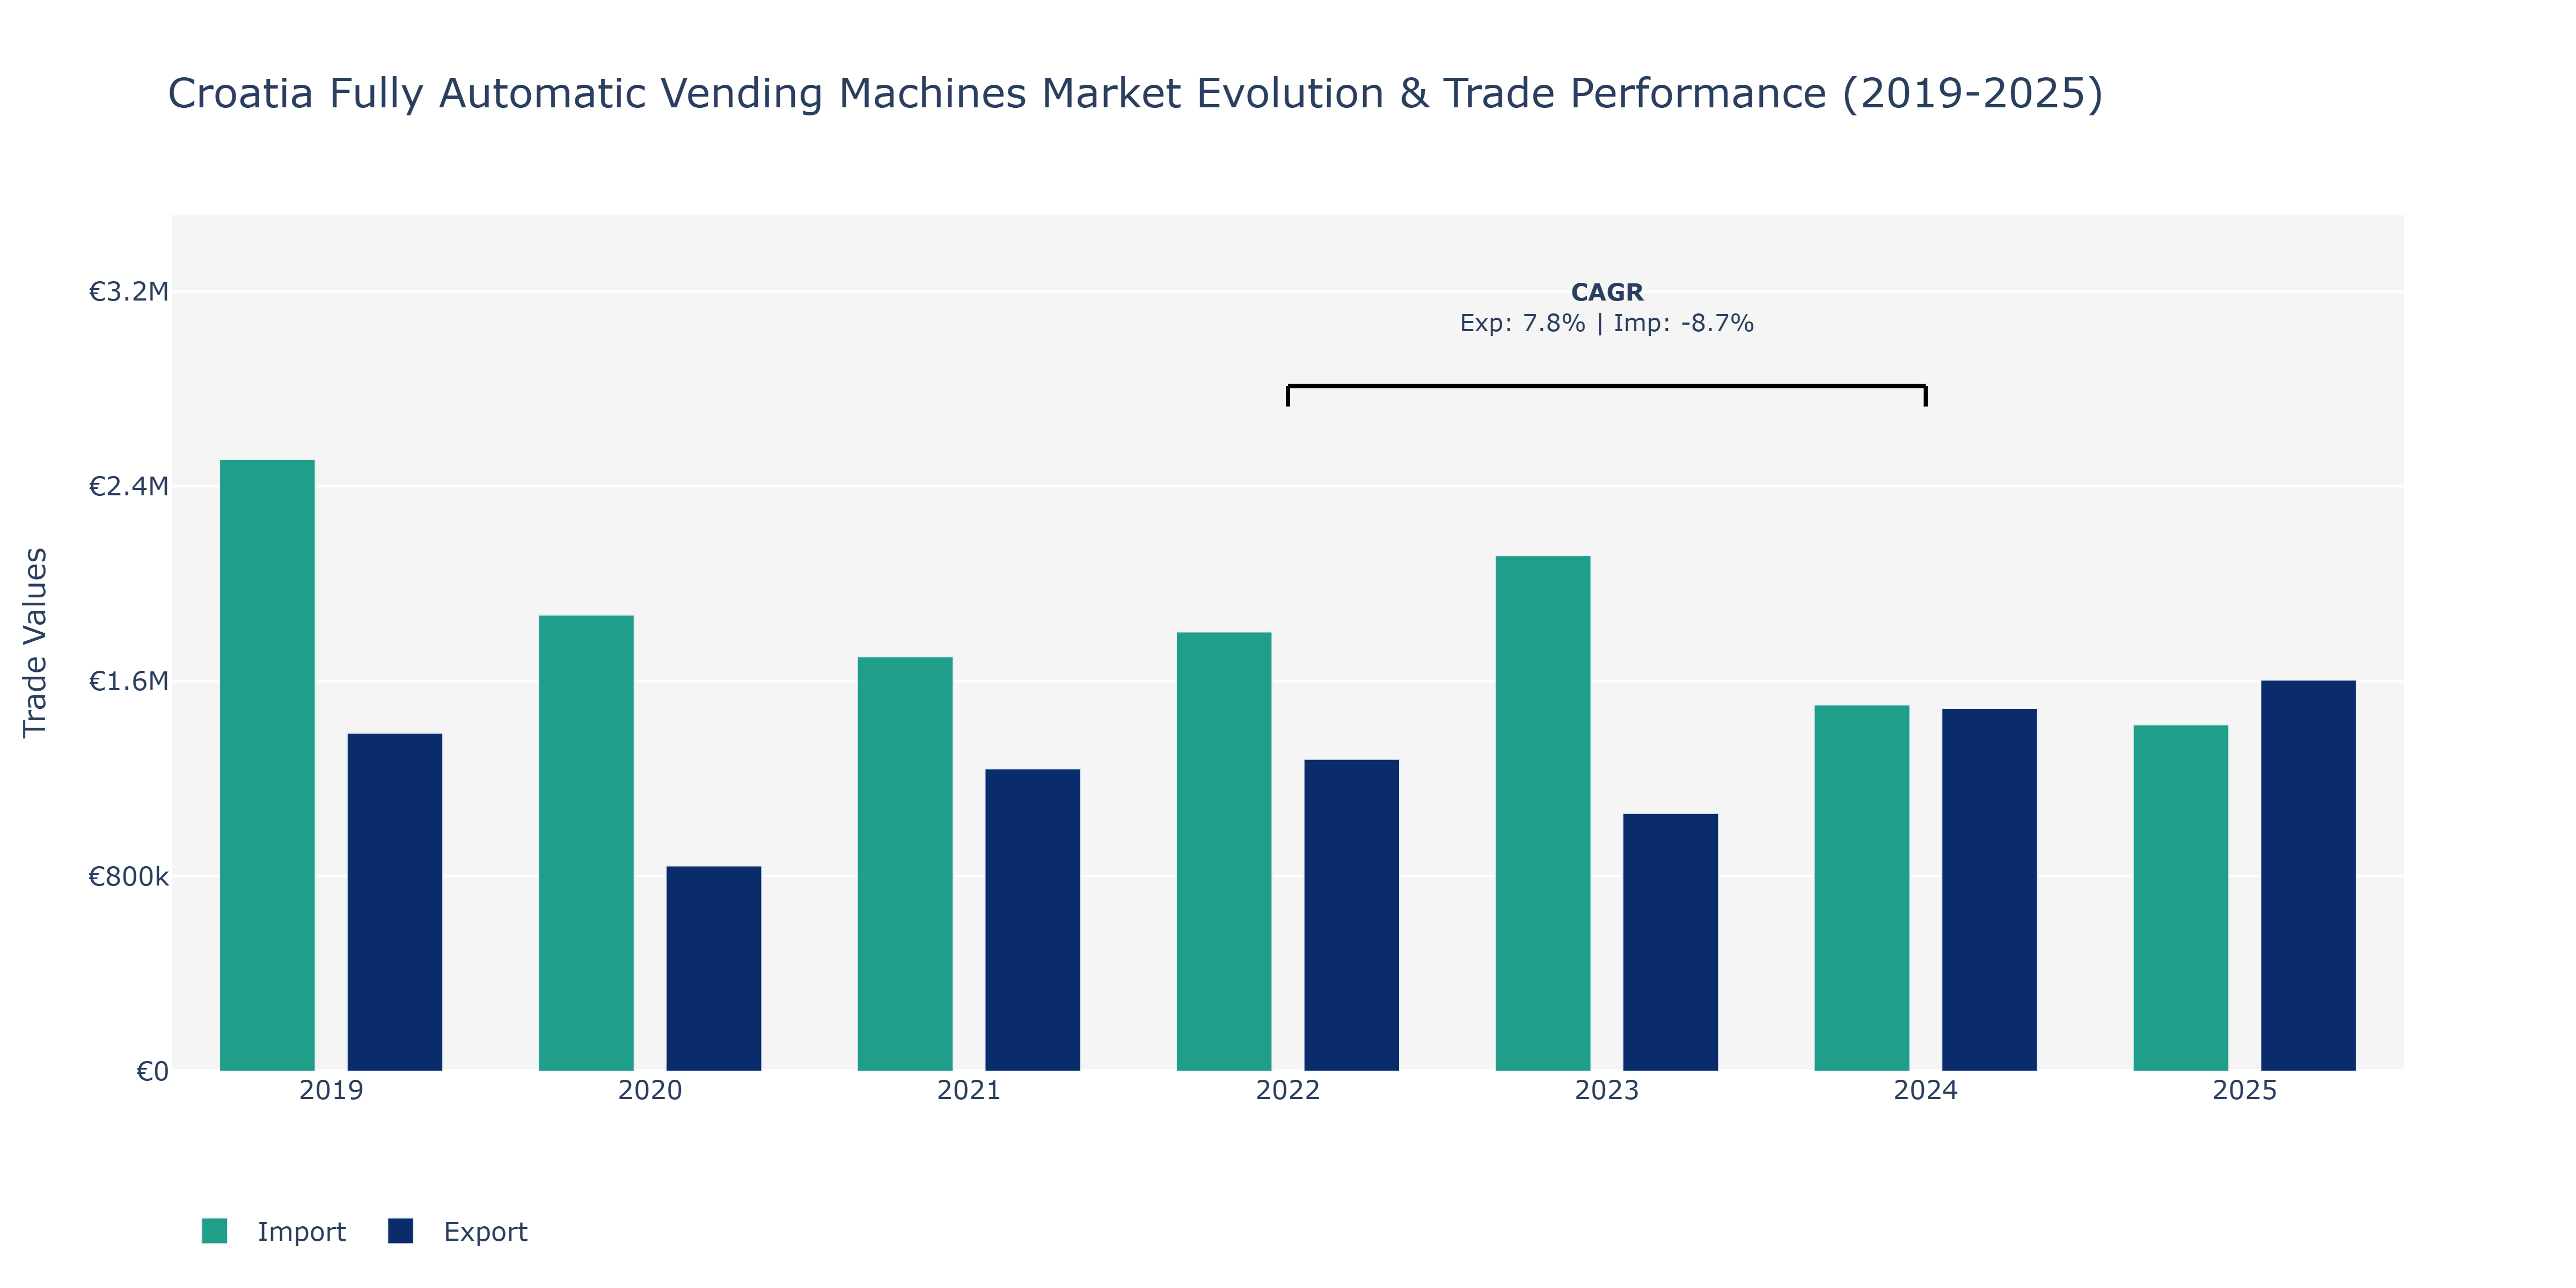
In the Croatia Fully Automatic Vending Machines Market, exports saw fluctuations over the years. In 2019, exports were at €1.39 million, showing a substantial decrease to €842.51 thousand in 2020. However, a recovery was evident in the following years, with exports reaching €1.49 million in 2024 and continuing to grow to €1.61 million in 2025. On the other hand, imports experienced a different trend, peaking at €2.51 million in 2019 before steadily declining to €1.5 million in 2024. The market may have witnessed these shifts due to various factors such as changes in consumer demand, fluctuations in global commodity prices, or shifts in trade agreements affecting the vending machine industry. As vending machines evolve with technological advancements, the demand for fully automatic vending machines might have influenced these export and import dynamics, aligning with the global trend of automated retail solutions becoming more prevalent.
Key Highlights of the Report:
- Croatia Fully Automatic Vending Machines Market Outlook
- Market Size of Croatia Fully Automatic Vending Machines Market, 2025
- Forecast of Croatia Fully Automatic Vending Machines Market, 2032
- Historical Data and Forecast of Croatia Fully Automatic Vending Machines Revenues & Volume for the Period 2022 - 2032
- Croatia Fully Automatic Vending Machines Market Trend Evolution
- Croatia Fully Automatic Vending Machines Market Drivers and Challenges
- Croatia Fully Automatic Vending Machines Price Trends
- Croatia Fully Automatic Vending Machines Porter's Five Forces
- Croatia Fully Automatic Vending Machines Industry Life Cycle
- Historical Data and Forecast of Croatia Fully Automatic Vending Machines Market Revenues & Volume By Type for the Period 2022 - 2032
- Historical Data and Forecast of Croatia Fully Automatic Vending Machines Market Revenues & Volume By Beverage Machines for the Period 2022 - 2032
- Historical Data and Forecast of Croatia Fully Automatic Vending Machines Market Revenues & Volume By Snacks Machines for the Period 2022 - 2032
- Historical Data and Forecast of Croatia Fully Automatic Vending Machines Market Revenues & Volume By Sanitary Napkin Machines for the Period 2022 - 2032
- Historical Data and Forecast of Croatia Fully Automatic Vending Machines Market Revenues & Volume By Ticket Machines for the Period 2022 - 2032
- Historical Data and Forecast of Croatia Fully Automatic Vending Machines Market Revenues & Volume By Water Machines for the Period 2022 - 2032
- Historical Data and Forecast of Croatia Fully Automatic Vending Machines Market Revenues & Volume By Others (Cigarette Machines, etc.) for the Period 2022 - 2032
- Historical Data and Forecast of Croatia Fully Automatic Vending Machines Market Revenues & Volume By Operational Mode for the Period 2022 - 2032
- Historical Data and Forecast of Croatia Fully Automatic Vending Machines Market Revenues & Volume By Single Product Vending Machine for the Period 2022 - 2032
- Historical Data and Forecast of Croatia Fully Automatic Vending Machines Market Revenues & Volume By Multiple Product Vending Machine for the Period 2022 - 2032
- Historical Data and Forecast of Croatia Fully Automatic Vending Machines Market Revenues & Volume By End-user for the Period 2022 - 2032
- Historical Data and Forecast of Croatia Fully Automatic Vending Machines Market Revenues & Volume By Industrial for the Period 2022 - 2032
- Historical Data and Forecast of Croatia Fully Automatic Vending Machines Market Revenues & Volume By Commercial for the Period 2022 - 2032
- Historical Data and Forecast of Croatia Fully Automatic Vending Machines Market Revenues & Volume By Shopping Malls and Retail Stores for the Period 2022 - 2032
- Historical Data and Forecast of Croatia Fully Automatic Vending Machines Market Revenues & Volume By Corporate Offices/Banks for the Period 2022 - 2032
- Historical Data and Forecast of Croatia Fully Automatic Vending Machines Market Revenues & Volume By Hotels & Restaurants for the Period 2022 - 2032
- Historical Data and Forecast of Croatia Fully Automatic Vending Machines Market Revenues & Volume By Educational Institutions for the Period 2022 - 2032
- Historical Data and Forecast of Croatia Fully Automatic Vending Machines Market Revenues & Volume By Others (Sports Stadiums, etc.) for the Period 2022 - 2032
- Historical Data and Forecast of Croatia Fully Automatic Vending Machines Market Revenues & Volume By Distribution Channel for the Period 2022 - 2032
- Historical Data and Forecast of Croatia Fully Automatic Vending Machines Market Revenues & Volume By Direct Sales for the Period 2022 - 2032
- Historical Data and Forecast of Croatia Fully Automatic Vending Machines Market Revenues & Volume By Indirect Sales for the Period 2022 - 2032
- Croatia Fully Automatic Vending Machines Import Export Trade Statistics
- Market Opportunity Assessment By Type
- Market Opportunity Assessment By Operational Mode
- Market Opportunity Assessment By End-user
- Market Opportunity Assessment By Distribution Channel
- Croatia Fully Automatic Vending Machines Top Companies Market Share
- Croatia Fully Automatic Vending Machines Competitive Benchmarking By Technical and Operational Parameters
- Croatia Fully Automatic Vending Machines Company Profiles
- Croatia Fully Automatic Vending Machines Key Strategic Recommendations
Frequently Asked Questions About the Market Study (FAQs):
6Wresearch actively monitors the Croatia Fully Automatic Vending Machines Market and publishes its comprehensive annual report, highlighting emerging trends, growth drivers, revenue analysis, and forecast outlook. Our insights help businesses to make data-backed strategic decisions with ongoing market dynamics. Our analysts track relevent industries related to the Croatia Fully Automatic Vending Machines Market, allowing our clients with actionable intelligence and reliable forecasts tailored to emerging regional needs.
Yes, we provide customisation as per your requirements. To learn more, feel free to contact us on sales@6wresearch.com
1 Executive Summary |
2 Introduction |
2.1 Key Highlights of the Report |
2.2 Report Description |
2.3 Market Scope & Segmentation |
2.4 Research Methodology |
2.5 Assumptions |
3 Croatia Fully Automatic Vending Machines Market Overview |
3.1 Croatia Country Macro Economic Indicators |
3.2 Croatia Fully Automatic Vending Machines Market Revenues & Volume, 2022 & 2032F |
3.3 Croatia Fully Automatic Vending Machines Market - Industry Life Cycle |
3.4 Croatia Fully Automatic Vending Machines Market - Porter's Five Forces |
3.5 Croatia Fully Automatic Vending Machines Market Revenues & Volume Share, By Type, 2022 & 2032F |
3.6 Croatia Fully Automatic Vending Machines Market Revenues & Volume Share, By Operational Mode, 2022 & 2032F |
3.7 Croatia Fully Automatic Vending Machines Market Revenues & Volume Share, By End-user, 2022 & 2032F |
3.8 Croatia Fully Automatic Vending Machines Market Revenues & Volume Share, By Distribution Channel, 2022 & 2032F |
4 Croatia Fully Automatic Vending Machines Market Dynamics |
4.1 Impact Analysis |
4.2 Market Drivers |
4.3 Market Restraints |
5 Croatia Fully Automatic Vending Machines Market Trends |
6 Croatia Fully Automatic Vending Machines Market, By Types |
6.1 Croatia Fully Automatic Vending Machines Market, By Type |
6.1.1 Overview and Analysis |
6.1.2 Croatia Fully Automatic Vending Machines Market Revenues & Volume, By Type, 2022 - 2032F |
6.1.3 Croatia Fully Automatic Vending Machines Market Revenues & Volume, By Beverage Machines, 2022 - 2032F |
6.1.4 Croatia Fully Automatic Vending Machines Market Revenues & Volume, By Snacks Machines, 2022 - 2032F |
6.1.5 Croatia Fully Automatic Vending Machines Market Revenues & Volume, By Sanitary Napkin Machines, 2022 - 2032F |
6.1.6 Croatia Fully Automatic Vending Machines Market Revenues & Volume, By Ticket Machines, 2022 - 2032F |
6.1.7 Croatia Fully Automatic Vending Machines Market Revenues & Volume, By Water Machines, 2022 - 2032F |
6.1.8 Croatia Fully Automatic Vending Machines Market Revenues & Volume, By Others (Cigarette Machines, etc.), 2022 - 2032F |
6.2 Croatia Fully Automatic Vending Machines Market, By Operational Mode |
6.2.1 Overview and Analysis |
6.2.2 Croatia Fully Automatic Vending Machines Market Revenues & Volume, By Single Product Vending Machine, 2022 - 2032F |
6.2.3 Croatia Fully Automatic Vending Machines Market Revenues & Volume, By Multiple Product Vending Machine, 2022 - 2032F |
6.3 Croatia Fully Automatic Vending Machines Market, By End-user |
6.3.1 Overview and Analysis |
6.3.2 Croatia Fully Automatic Vending Machines Market Revenues & Volume, By Industrial, 2022 - 2032F |
6.3.3 Croatia Fully Automatic Vending Machines Market Revenues & Volume, By Commercial, 2022 - 2032F |
6.3.4 Croatia Fully Automatic Vending Machines Market Revenues & Volume, By Shopping Malls and Retail Stores, 2022 - 2032F |
6.3.5 Croatia Fully Automatic Vending Machines Market Revenues & Volume, By Corporate Offices/Banks, 2022 - 2032F |
6.3.6 Croatia Fully Automatic Vending Machines Market Revenues & Volume, By Hotels & Restaurants, 2022 - 2032F |
6.3.7 Croatia Fully Automatic Vending Machines Market Revenues & Volume, By Educational Institutions, 2022 - 2032F |
6.4 Croatia Fully Automatic Vending Machines Market, By Distribution Channel |
6.4.1 Overview and Analysis |
6.4.2 Croatia Fully Automatic Vending Machines Market Revenues & Volume, By Direct Sales, 2022 - 2032F |
6.4.3 Croatia Fully Automatic Vending Machines Market Revenues & Volume, By Indirect Sales, 2022 - 2032F |
7 Croatia Fully Automatic Vending Machines Market Import-Export Trade Statistics |
7.1 Croatia Fully Automatic Vending Machines Market Export to Major Countries |
7.2 Croatia Fully Automatic Vending Machines Market Imports from Major Countries |
8 Croatia Fully Automatic Vending Machines Market Key Performance Indicators |
9 Croatia Fully Automatic Vending Machines Market - Opportunity Assessment |
9.1 Croatia Fully Automatic Vending Machines Market Opportunity Assessment, By Type, 2022 & 2032F |
9.2 Croatia Fully Automatic Vending Machines Market Opportunity Assessment, By Operational Mode, 2022 & 2032F |
9.3 Croatia Fully Automatic Vending Machines Market Opportunity Assessment, By End-user, 2022 & 2032F |
9.4 Croatia Fully Automatic Vending Machines Market Opportunity Assessment, By Distribution Channel, 2022 & 2032F |
10 Croatia Fully Automatic Vending Machines Market - Competitive Landscape |
10.1 Croatia Fully Automatic Vending Machines Market Revenue Share, By Companies, 2025 |
10.2 Croatia Fully Automatic Vending Machines Market Competitive Benchmarking, By Operating and Technical Parameters |
11 Company Profiles |
12 Recommendations |
13 Disclaimer |
Export potential assessment - trade Analytics for 2030
Export potential enables firms to identify high-growth global markets with greater confidence by combining advanced trade intelligence with a structured quantitative methodology. The framework analyzes emerging demand trends and country-level import patterns while integrating macroeconomic and trade datasets such as GDP and population forecasts, bilateral import–export flows, tariff structures, elasticity differentials between developed and developing economies, geographic distance, and import demand projections. Using weighted trade values from 2020–2024 as the base period to project country-to-country export potential for 2030, these inputs are operationalized through calculated drivers such as gravity model parameters, tariff impact factors, and projected GDP per-capita growth. Through an analysis of hidden potentials, demand hotspots, and market conditions that are most favorable to success, this method enables firms to focus on target countries, maximize returns, and global expansion with data, backed by accuracy.
By factoring in the projected importer demand gap that is currently unmet and could be potential opportunity, it identifies the potential for the Exporter (Country) among 190 countries, against the general trade analysis, which identifies the biggest importer or exporter.
To discover high-growth global markets and optimize your business strategy:
Click Here
Pricing
- Single User License$ 1,995
- Department License$ 2,400
- Site License$ 3,120
- Global License$ 3,795

Search
Thought Leadership and Analyst Meet


Our Clients
Latest Reports
- France Thermally Conductive Filler Dispersants Market (2026-2032) | Challenges, Restraints, Value, Share, Size, segmentation, Analysis, Trends, Investment Opportunities, Outlook, Pricing, Demand, Forecast, Revenue, Companies, Growth, Drivers, Strategy, Insights, Competition
- Egypt Thermally Conductive Filler Dispersants Market (2026-2032) | Competition, Forecast, Strategy, Value, Insights, Outlook, Investment Opportunities, Pricing, Demand, Share, segmentation, Drivers, Size, Companies, Restraints, Growth, Trends, Revenue, Challenges, Analysis
- Czech Republic Thermally Conductive Filler Dispersants Market (2026-2032) | Forecast, Pricing, Analysis, Drivers, Insights, Size, Demand, Growth, Challenges, segmentation, Competition, Outlook, Trends, Investment Opportunities, Companies, Strategy, Revenue, Share, Value, Restraints
- Colombia Thermally Conductive Filler Dispersants Market (2026-2032) | segmentation, Trends, Share, Drivers, Strategy, Companies, Demand, Insights, Size, Challenges, Value, Competition, Analysis, Growth, Revenue, Restraints, Forecast, Pricing, Outlook, Investment Opportunities
- China Thermally Conductive Filler Dispersants Market (2026-2032) | Restraints, Investment Opportunities, Pricing, Companies, Share, Size, Challenges, Trends, Outlook, Value, Analysis, Competition, Revenue, Drivers, Forecast, Demand, Insights, Growth, Strategy, segmentation
- Chile Thermally Conductive Filler Dispersants Market (2026-2032) | Investment Opportunities, Trends, Value, Restraints, Share, Companies, Forecast, segmentation, Pricing, Challenges, Demand, Size, Analysis, Drivers, Outlook, Growth, Competition, Strategy, Revenue, Insights
- Cambodia Thermally Conductive Filler Dispersants Market (2026-2032) | Analysis, Share, Outlook, Strategy, Pricing, Demand, Size, Growth, segmentation, Insights, Revenue, Forecast, Challenges, Competition, Companies, Investment Opportunities, Trends, Restraints, Value, Drivers
- Brazil Thermally Conductive Filler Dispersants Market (2026-2032) | Restraints, Forecast, Competition, Size, Revenue, Value, Investment Opportunities, Trends, Insights, Outlook, Growth, Analysis, Drivers, segmentation, Pricing, Challenges, Strategy, Share, Companies, Demand
- Bangladesh Thermally Conductive Filler Dispersants Market (2026-2032) | Restraints, Trends, Analysis, Competition, Insights, Forecast, Value, Investment Opportunities, Pricing, Share, Demand, Outlook, Revenue, segmentation, Companies, Drivers, Growth, Size, Challenges, Strategy
- Bahrain Thermally Conductive Filler Dispersants Market (2026-2032) | Trends, Outlook, Pricing, Demand, Value, Competition, Forecast, Growth, segmentation, Revenue, Companies, Analysis, Insights, Size, Drivers, Challenges, Strategy, Investment Opportunities, Share, Restraints
Industry Events and Analyst Meet

HIMTEX 2026

India Refining Summit 2026

India EV Show 2026

EV tech India Expo 2026

Auto Tech Asia 2026
Whitepaper
- Middle East & Africa Commercial Security Market Click here to view more.
- Middle East & Africa Fire Safety Systems & Equipment Market Click here to view more.
- GCC Drone Market Click here to view more.
- Middle East Lighting Fixture Market Click here to view more.
- GCC Physical & Perimeter Security Market Click here to view more.
6WResearch In News
- Doha a strategic location for EV manufacturing hub: IPA Qatar
- Demand for luxury TVs surging in the GCC, says Samsung
- Empowering Growth: The Thriving Journey of Bangladesh’s Cable Industry
- Demand for luxury TVs surging in the GCC, says Samsung
- Video call with a traditional healer? Once unthinkable, it’s now common in South Africa
- Intelligent Buildings To Smooth GCC’s Path To Net Zero