Croatia Galvanized Iron Wire Market (2026-2032) | Share, Trends, Value, Analysis, Companies, Outlook, Segmentation, Size, Revenue, Growth, Industry & Forecast
Market Forecast By Product (Hot Galvanized Iron Wire, Cold Galvanized Iron Wire), By Application (Building, Handicrafts, Weaving Screen, Wipe Wall Net, Highway Guardrail, Packaging, Daily Civilian Use, Others) And Competitive Landscape
| Product Code: ETC5390512 | Publication Date: Nov 2023 | Updated Date: Apr 2026 | Product Type: Market Research Report | |
| Publisher: 6Wresearch | Author: Ravi Bhandari | No. of Pages: 60 | No. of Figures: 30 | No. of Tables: 5 |
Croatia Galvanized Iron Wire Market Size (2020-2030)
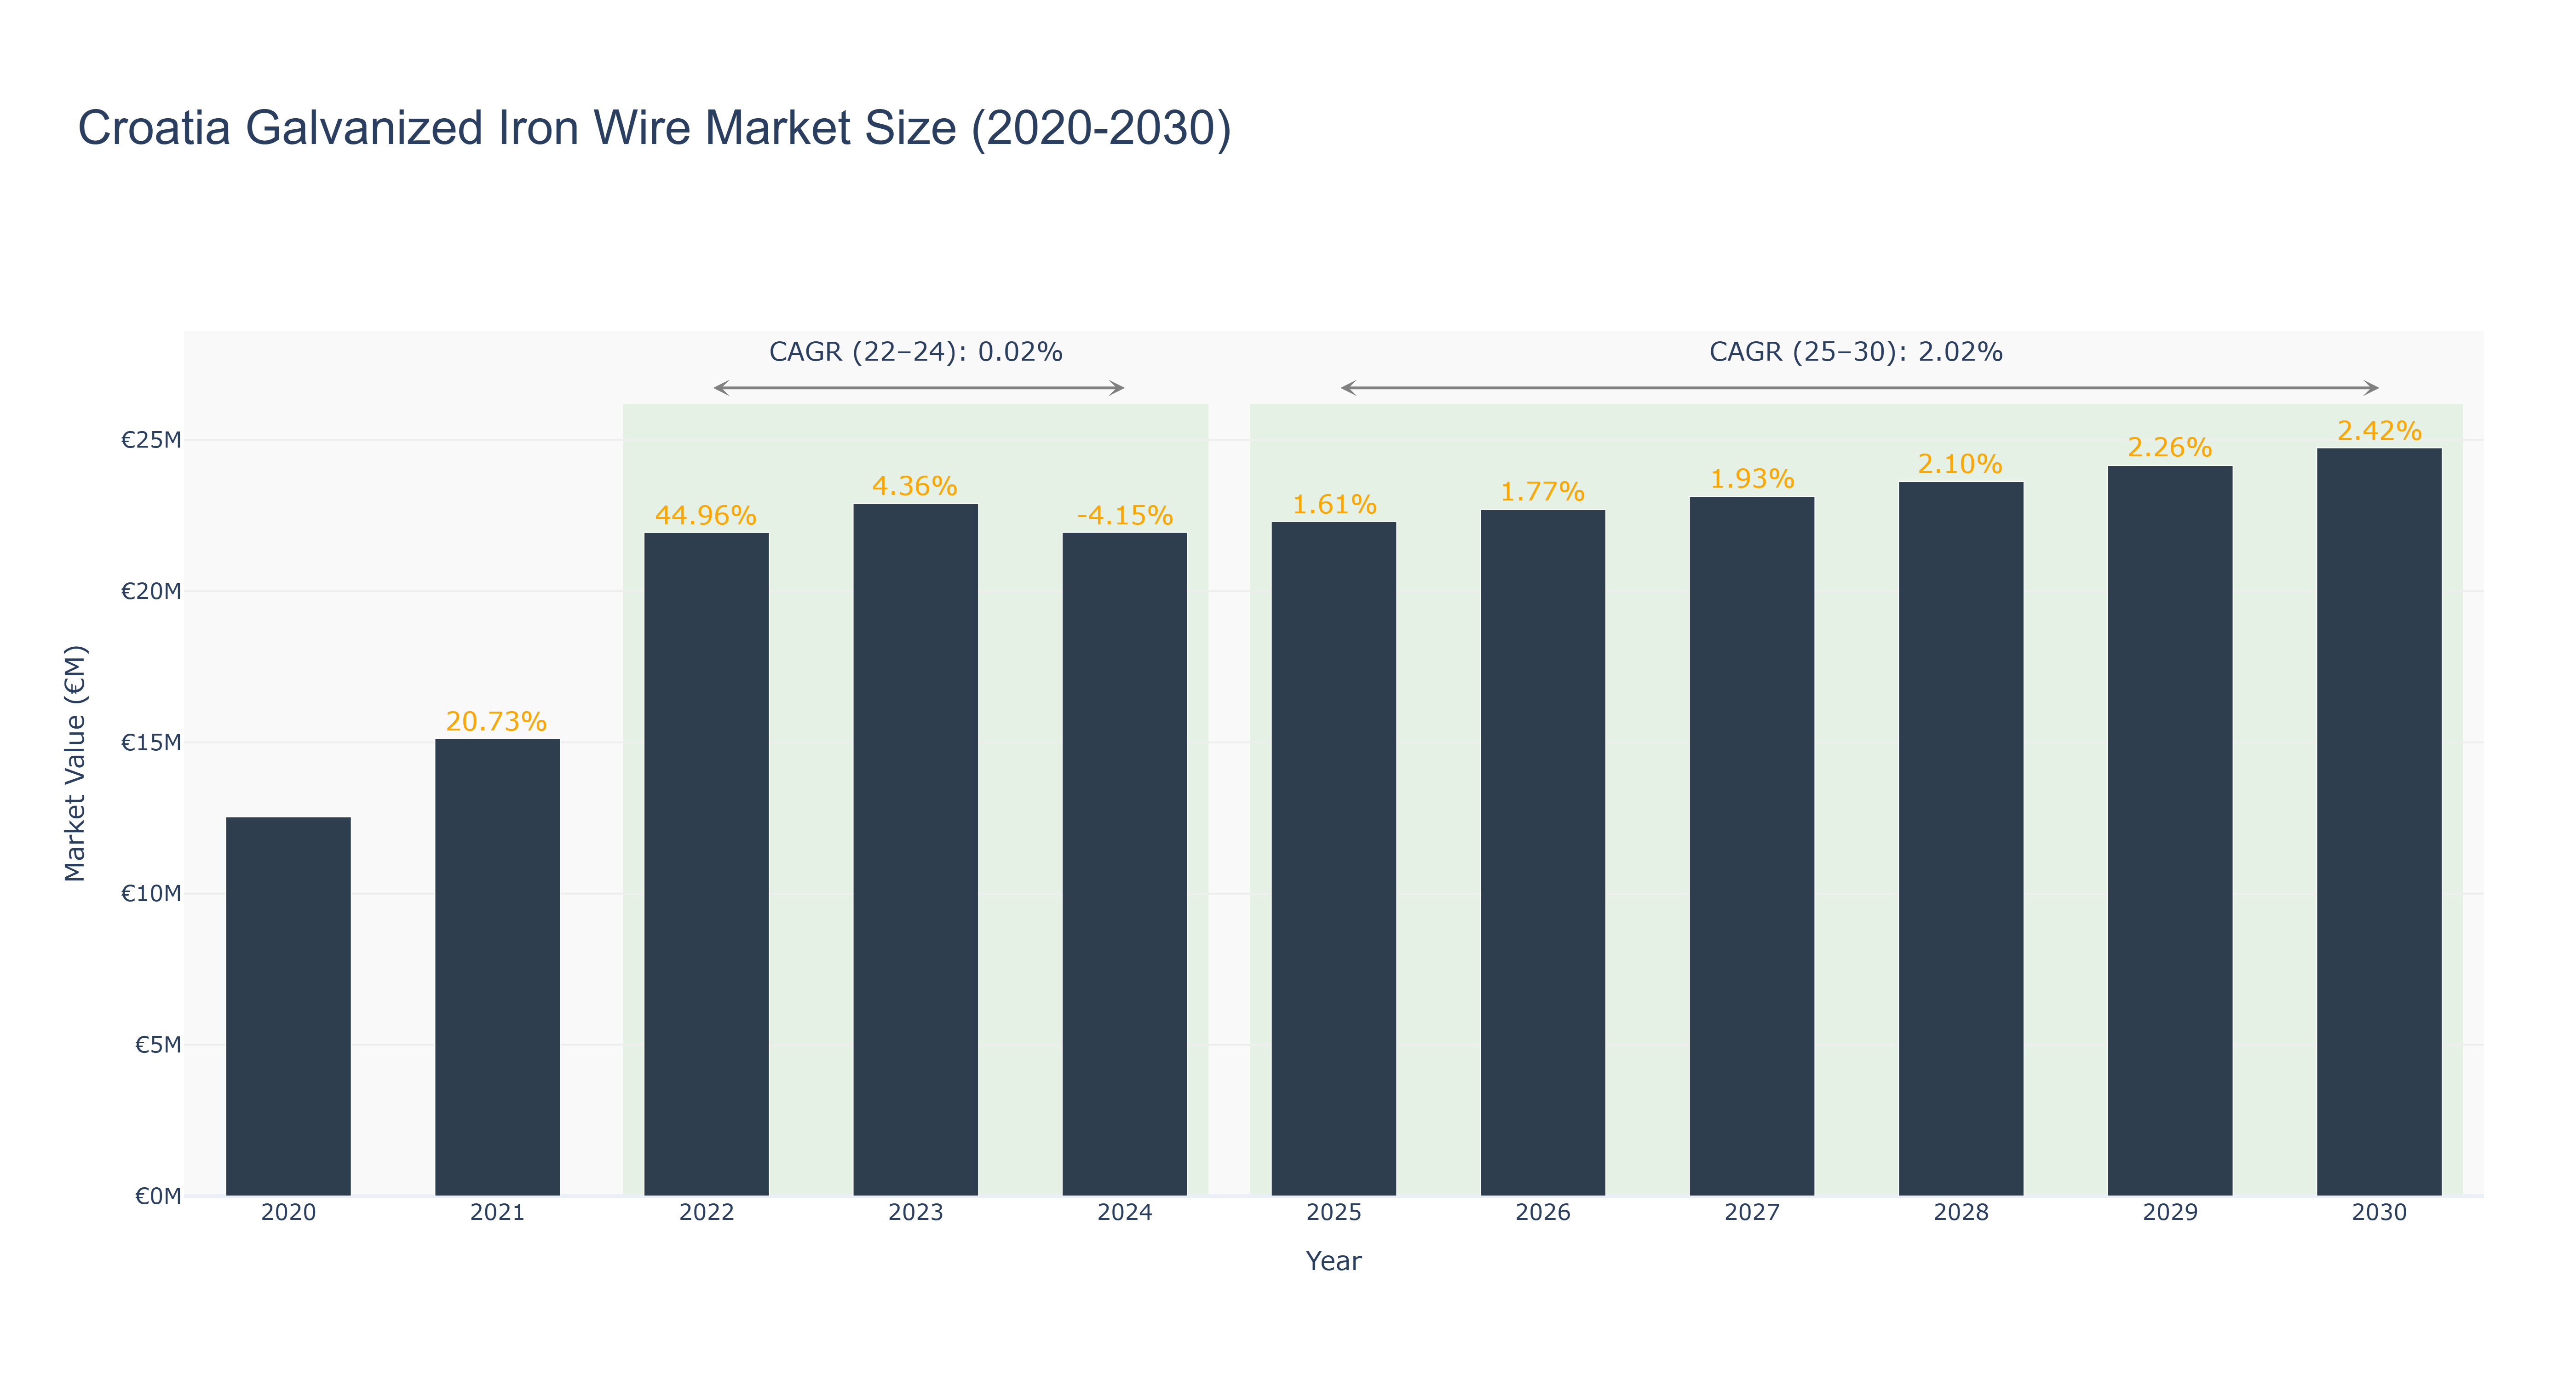
The Croatia Galvanized Iron Wire Market witnessed a peak market size of €24.74 million in 2030. From 2020 to 2024, the market size fluctuated, starting at €12.54 million in 2020, peaking at €22.90 million in 2023, and then slightly declining to €21.95 million in 2024. Forecasted growth from 2025 to 2030 shows steady expansion, with the market size expected to reach €24.74 million in 2030. The CAGR for the period 2022-24 was 0.0158%, while for 2025-30, it is projected at 2.02%. The market's fluctuations can be attributed to changing demand patterns in the construction and industrial sectors. Looking ahead, upcoming infrastructure projects in Croatia are set to drive further growth in the galvanized iron wire market, particularly in the context of sustainable construction initiatives.
Croatia Galvanized Iron Wire Market: Production & Trade Performance (2019-2025)
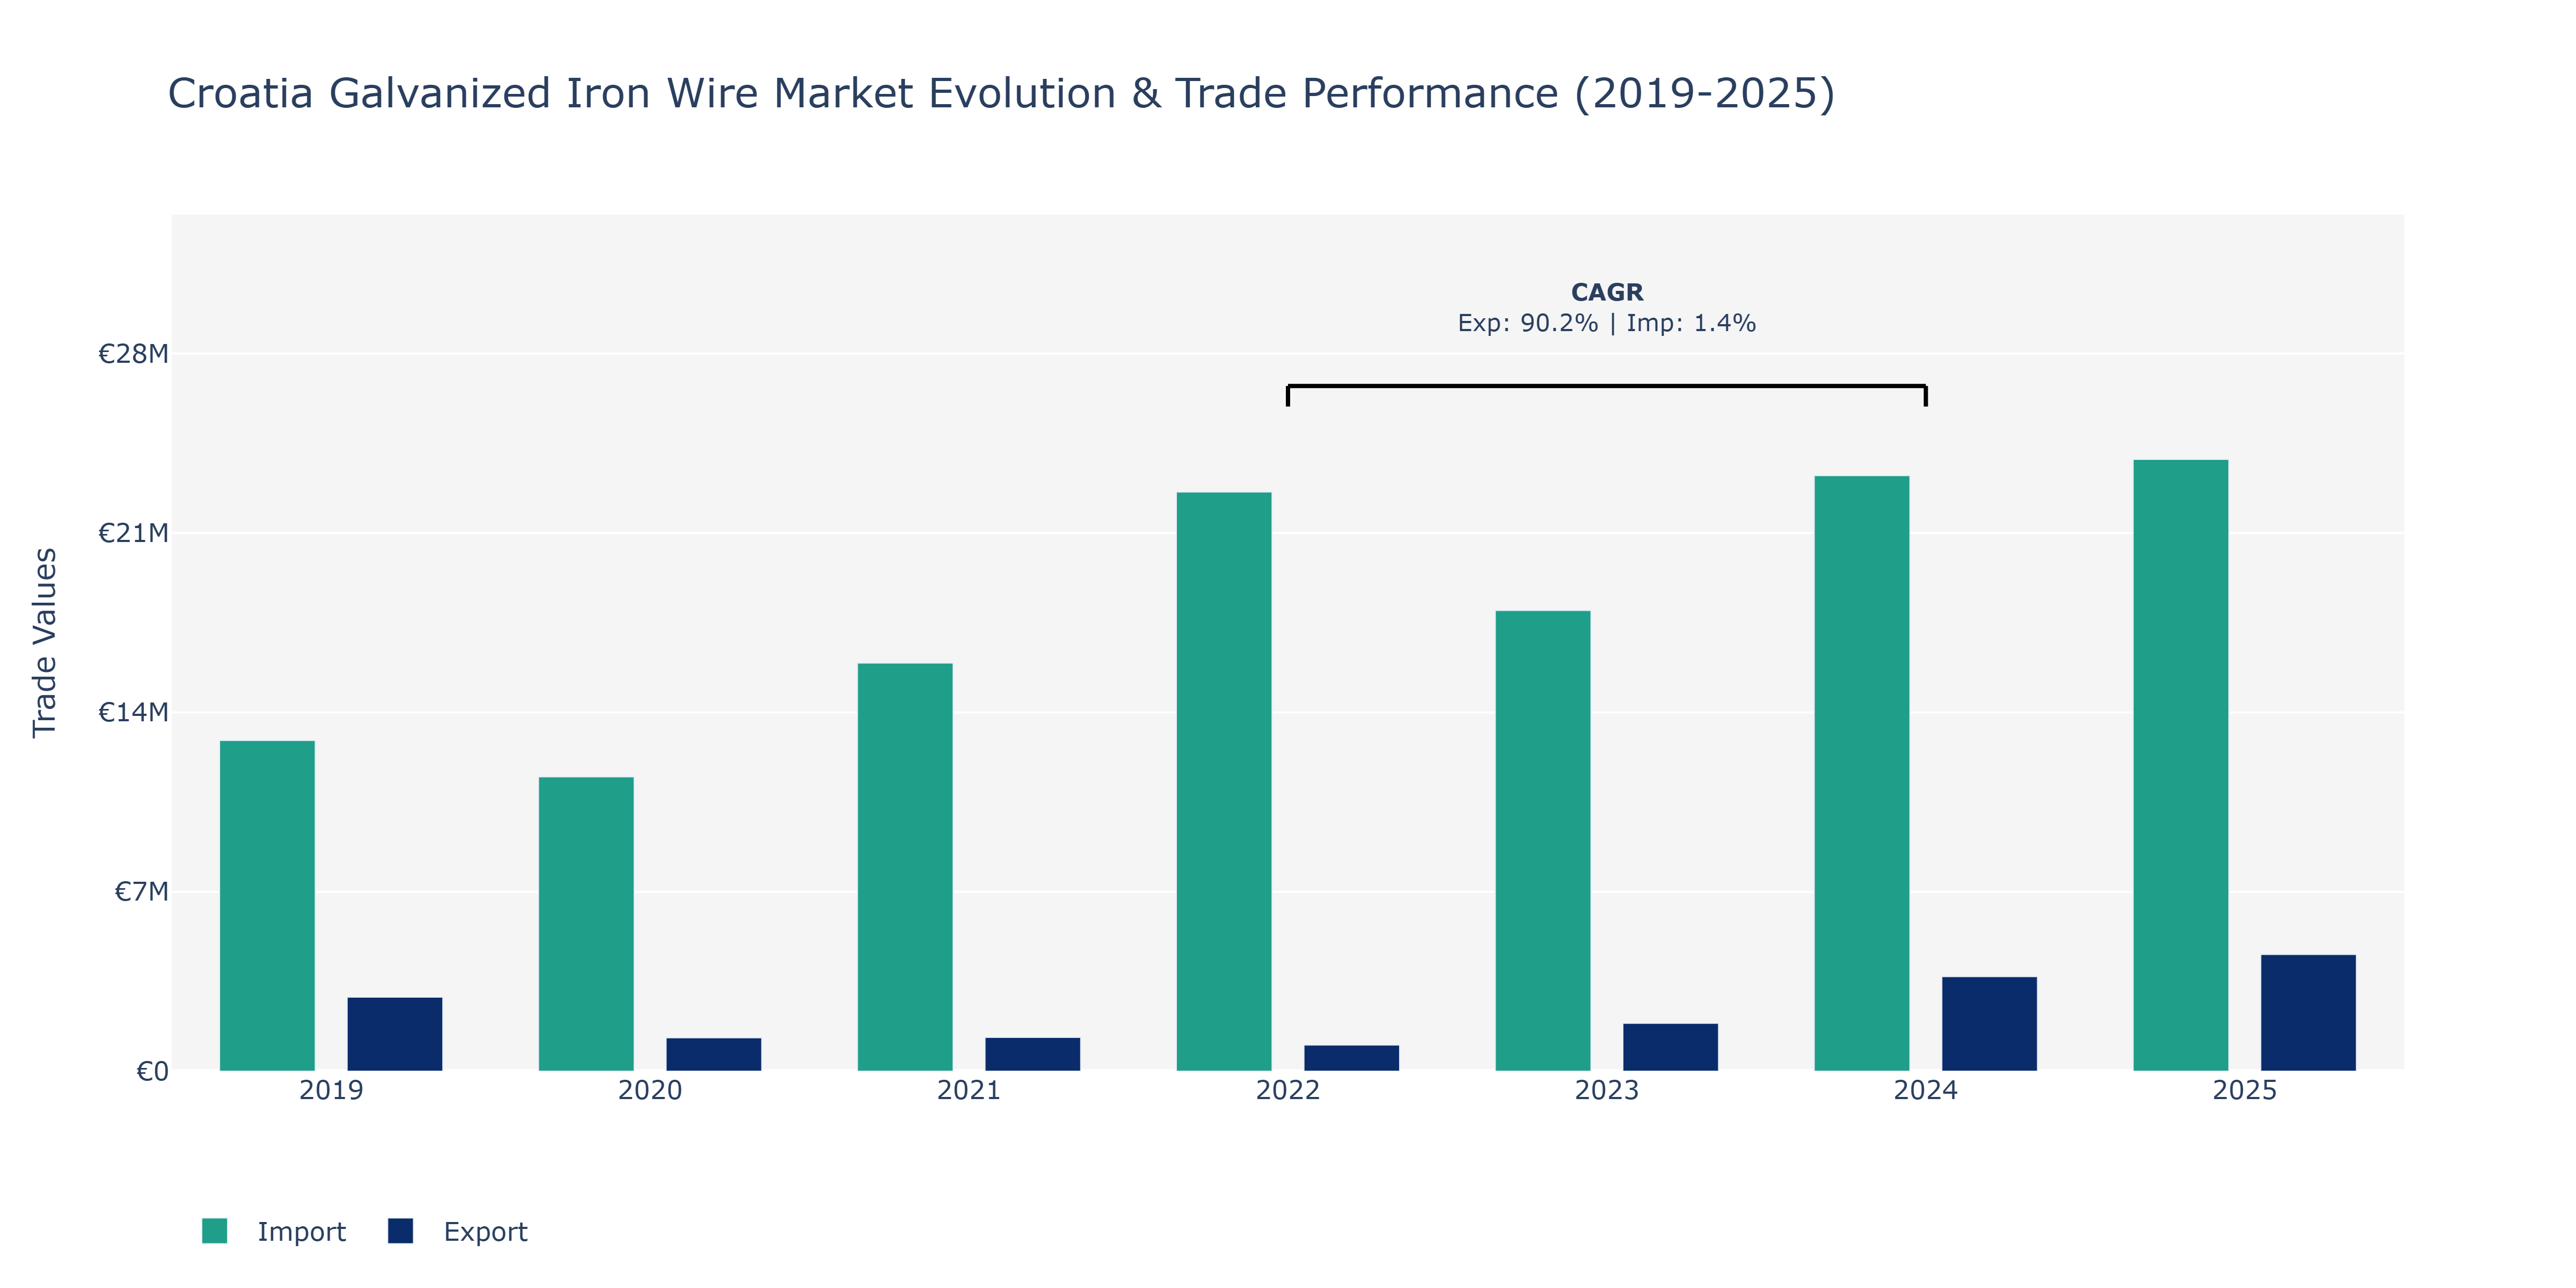
In the Croatia Galvanized Iron Wire Market, exports experienced fluctuations over the years, with a noticeable decrease from 2019 to 2022 before exhibiting a significant rebound in 2023 and a peak in 2024. Imports, on the other hand, followed a more stable trend, increasing steadily from 2019 to 2022, with a slight decline in 2023 followed by another increase in 2024. The peak points for exports and imports were observed in 2024, with exports reaching €3.69 million and imports hitting €23.24 million. The fluctuations in exports can be attributed to changing global demand for iron wire products, while the consistent growth in imports may reflect Croatia’s reliance on imported raw materials for its manufacturing sector. The spike in exports in 2024 could be linked to the country's strategic partnerships with key trading partners or improvements in production efficiency, driving higher export volumes. The steady growth in imports may also indicate increasing infrastructure development projects within Croatia, necessitating higher imports of iron wire products.
Key Highlights of the Report:
- Croatia Galvanized Iron Wire Market Outlook
- Market Size of Croatia Galvanized Iron Wire Market, 2025
- Forecast of Croatia Galvanized Iron Wire Market, 2032
- Historical Data and Forecast of Croatia Galvanized Iron Wire Revenues & Volume for the Period 2022 - 2032F
- Croatia Galvanized Iron Wire Market Trend Evolution
- Croatia Galvanized Iron Wire Market Drivers and Challenges
- Croatia Galvanized Iron Wire Price Trends
- Croatia Galvanized Iron Wire Porter`s Five Forces
- Croatia Galvanized Iron Wire Industry Life Cycle
- Historical Data and Forecast of Croatia Galvanized Iron Wire Market Revenues & Volume By Product for the Period 2022 - 2032F
- Historical Data and Forecast of Croatia Galvanized Iron Wire Market Revenues & Volume By Hot Galvanized Iron Wire for the Period 2022 - 2032F
- Historical Data and Forecast of Croatia Galvanized Iron Wire Market Revenues & Volume By Cold Galvanized Iron Wire for the Period 2022 - 2032F
- Historical Data and Forecast of Croatia Galvanized Iron Wire Market Revenues & Volume By Application for the Period 2022 - 2032F
- Historical Data and Forecast of Croatia Galvanized Iron Wire Market Revenues & Volume By Building for the Period 2022 - 2032F
- Historical Data and Forecast of Croatia Galvanized Iron Wire Market Revenues & Volume By Handicrafts for the Period 2022 - 2032F
- Historical Data and Forecast of Croatia Galvanized Iron Wire Market Revenues & Volume By Weaving Screen for the Period 2022 - 2032F
- Historical Data and Forecast of Croatia Galvanized Iron Wire Market Revenues & Volume By Wipe Wall Net for the Period 2022 - 2032F
- Historical Data and Forecast of Croatia Galvanized Iron Wire Market Revenues & Volume By Highway Guardrail for the Period 2022 - 2032F
- Historical Data and Forecast of Croatia Galvanized Iron Wire Market Revenues & Volume By Packaging for the Period 2022 - 2032F
- Historical Data and Forecast of Croatia Galvanized Iron Wire Market Revenues & Volume By Daily Civilian Use for the Period 2022 - 2032F
- Historical Data and Forecast of Croatia Galvanized Iron Wire Market Revenues & Volume By Others for the Period 2022 - 2032F
- Croatia Galvanized Iron Wire Import Export Trade Statistics
- Market Opportunity Assessment By Product
- Market Opportunity Assessment By Application
- Croatia Galvanized Iron Wire Top Companies Market Share
- Croatia Galvanized Iron Wire Competitive Benchmarking By Technical and Operational Parameters
- Croatia Galvanized Iron Wire Company Profiles
- Croatia Galvanized Iron Wire Key Strategic Recommendations
Frequently Asked Questions About the Market Study (FAQs):
6Wresearch actively monitors the Croatia Galvanized Iron Wire Market and publishes its comprehensive annual report, highlighting emerging trends, growth drivers, revenue analysis, and forecast outlook. Our insights help businesses to make data-backed strategic decisions with ongoing market dynamics. Our analysts track relevent industries related to the Croatia Galvanized Iron Wire Market, allowing our clients with actionable intelligence and reliable forecasts tailored to emerging regional needs.
Yes, we provide customisation as per your requirements. To learn more, feel free to contact us on sales@6wresearch.com
1 Executive Summary |
2 Introduction |
2.1 Key Highlights of the Report |
2.2 Report Description |
2.3 Market Scope & Segmentation |
2.4 Research Methodology |
2.5 Assumptions |
3 Croatia Galvanized Iron Wire Market Overview |
3.1 Croatia Country Macro Economic Indicators |
3.2 Croatia Galvanized Iron Wire Market Revenues & Volume, 2022 & 2032F |
3.3 Croatia Galvanized Iron Wire Market - Industry Life Cycle |
3.4 Croatia Galvanized Iron Wire Market - Porter's Five Forces |
3.5 Croatia Galvanized Iron Wire Market Revenues & Volume Share, By Product, 2022 & 2032F |
3.6 Croatia Galvanized Iron Wire Market Revenues & Volume Share, By Application, 2022 & 2032F |
4 Croatia Galvanized Iron Wire Market Dynamics |
4.1 Impact Analysis |
4.2 Market Drivers |
4.2.1 Growth in construction and infrastructure projects in Croatia |
4.2.2 Increase in demand for durable and corrosion-resistant materials |
4.2.3 Government initiatives promoting industrial development |
4.3 Market Restraints |
4.3.1 Fluctuating raw material prices |
4.3.2 Competition from alternative materials like PVC-coated wires |
4.3.3 Economic uncertainties impacting investment in construction projects |
5 Croatia Galvanized Iron Wire Market Trends |
6 Croatia Galvanized Iron Wire Market Segmentations |
6.1 Croatia Galvanized Iron Wire Market, By Product |
6.1.1 Overview and Analysis |
6.1.2 Croatia Galvanized Iron Wire Market Revenues & Volume, By Hot Galvanized Iron Wire, 2022 - 2032F |
6.1.3 Croatia Galvanized Iron Wire Market Revenues & Volume, By Cold Galvanized Iron Wire, 2022 - 2032F |
6.2 Croatia Galvanized Iron Wire Market, By Application |
6.2.1 Overview and Analysis |
6.2.2 Croatia Galvanized Iron Wire Market Revenues & Volume, By Building, 2022 - 2032F |
6.2.3 Croatia Galvanized Iron Wire Market Revenues & Volume, By Handicrafts, 2022 - 2032F |
6.2.4 Croatia Galvanized Iron Wire Market Revenues & Volume, By Weaving Screen, 2022 - 2032F |
6.2.5 Croatia Galvanized Iron Wire Market Revenues & Volume, By Wipe Wall Net, 2022 - 2032F |
6.2.6 Croatia Galvanized Iron Wire Market Revenues & Volume, By Highway Guardrail, 2022 - 2032F |
6.2.7 Croatia Galvanized Iron Wire Market Revenues & Volume, By Packaging, 2022 - 2032F |
6.2.8 Croatia Galvanized Iron Wire Market Revenues & Volume, By Others, 2022 - 2032F |
6.2.9 Croatia Galvanized Iron Wire Market Revenues & Volume, By Others, 2022 - 2032F |
7 Croatia Galvanized Iron Wire Market Import-Export Trade Statistics |
7.1 Croatia Galvanized Iron Wire Market Export to Major Countries |
7.2 Croatia Galvanized Iron Wire Market Imports from Major Countries |
8 Croatia Galvanized Iron Wire Market Key Performance Indicators |
8.1 Average selling price of galvanized iron wire |
8.2 Number of new construction permits issued in Croatia |
8.3 Import/export volume of galvanized iron wire in Croatia |
8.4 Utilization rate of galvanized iron wire production capacity |
8.5 Consumer sentiment index related to construction sector in Croatia |
9 Croatia Galvanized Iron Wire Market - Opportunity Assessment |
9.1 Croatia Galvanized Iron Wire Market Opportunity Assessment, By Product, 2022 & 2032F |
9.2 Croatia Galvanized Iron Wire Market Opportunity Assessment, By Application, 2022 & 2032F |
10 Croatia Galvanized Iron Wire Market - Competitive Landscape |
10.1 Croatia Galvanized Iron Wire Market Revenue Share, By Companies, 2025 |
10.2 Croatia Galvanized Iron Wire Market Competitive Benchmarking, By Operating and Technical Parameters |
11 Company Profiles |
12 Recommendations | 13 Disclaimer |
Export potential assessment - trade Analytics for 2030
Export potential enables firms to identify high-growth global markets with greater confidence by combining advanced trade intelligence with a structured quantitative methodology. The framework analyzes emerging demand trends and country-level import patterns while integrating macroeconomic and trade datasets such as GDP and population forecasts, bilateral import–export flows, tariff structures, elasticity differentials between developed and developing economies, geographic distance, and import demand projections. Using weighted trade values from 2020–2024 as the base period to project country-to-country export potential for 2030, these inputs are operationalized through calculated drivers such as gravity model parameters, tariff impact factors, and projected GDP per-capita growth. Through an analysis of hidden potentials, demand hotspots, and market conditions that are most favorable to success, this method enables firms to focus on target countries, maximize returns, and global expansion with data, backed by accuracy.
By factoring in the projected importer demand gap that is currently unmet and could be potential opportunity, it identifies the potential for the Exporter (Country) among 190 countries, against the general trade analysis, which identifies the biggest importer or exporter.
To discover high-growth global markets and optimize your business strategy:
Click Here
Pricing
- Single User License$ 1,995
- Department License$ 2,400
- Site License$ 3,120
- Global License$ 3,795

Search
Thought Leadership and Analyst Meet


Our Clients
Latest Reports
- Canada Cloud CFD Market (2026-2032) | Size & Revenue, Industry, Growth, Competitive Landscape, Forecast, Segmentation, Value, Outlook, Trends, Share, Analysis, Companies
- Taiwan Food Delivery Platform Market (2026-2032) | Companies, Outlook, Analysis, Trends, Value, Revenue, Segmentation, Share, Forecast, Competitive Landscape, Growth, Size & Forecast
- United Kingdom (UK) Long-term Care Insurance Market (2026-2032) | Growth, Share, Consumer Insights, Drivers, Opportunities, Competition, Pricing Analysis, Segments, Restraints, Companies, Competitive, Value, Outlook, Size, Demand, Analysis, Challenges, Strategic Insights, Investment Trends, Revenue, Trends, Supply, Forecast
- United Kingdom (UK) Long Term Care Market (2026-2032) | Companies, Outlook, Analysis, Trends, Value, Revenue, Segmentation, Share, Forecast, Competitive Landscape, Growth, Size & Forecast
- Iraq Insulation and Waterproofing Market (2026-2032) | Outlook, Drivers, Growth, Size, Share, Industry, Revenue, Trends, Demand, Competitive, Strategic Insights, Opportunities, Segments, Companies, Challenges, Strategy, Consumer Insights, Analysis, Investment Trends, Value, Segmentation, Forecast, Restraints
- India Switchgear Market Outlook (2026-2032) | Size, Share, Trends, Growth, Revenue, Forecast, Analysis, Value, Outlook
- Pakistan Contraceptive Implants Market (2025-2031) | Demand, Growth, Size, Share, Industry, Pricing Analysis, Competitive, Strategic Insights, Strategy, Consumer Insights, Analysis, Investment Trends, Opportunities, Revenue, Segments, Value, Segmentation, Supply, Forecast, Restraints, Outlook, Competition, Drivers, Trends, Companies, Challenges
- Sri Lanka Packaging Market (2026-2032) | Outlook, Competition, Drivers, Trends, Demand, Pricing Analysis, Competitive, Strategic Insights, Companies, Challenges, Strategy, Consumer Insights, Analysis, Investment Trends, Opportunities, Growth, Size, Share, Industry, Revenue, Segments, Value, Segmentation, Supply, Forecast, Restraints
- India Kids Watches Market (2026-2032) | Strategy, Consumer Insights, Analysis, Investment Trends, Opportunities, Growth, Size, Share, Industry, Revenue, Segments, Value, Segmentation, Supply, Forecast, Restraints, Outlook, Competition, Drivers, Trends, Demand, Pricing Analysis, Competitive, Strategic Insights, Companies, Challenges
- Saudi Arabia Core Assurance Service Market (2025-2031) | Strategy, Consumer Insights, Analysis, Investment Trends, Opportunities, Growth, Size, Share, Industry, Revenue, Segments, Value, Segmentation, Supply, Forecast, Restraints, Outlook, Competition, Drivers, Trends, Demand, Pricing Analysis, Competitive, Strategic Insights, Companies, Challenges
Industry Events and Analyst Meet

India EV Show 2026

EV tech India Expo 2026

Auto Tech Asia 2026

Battery Tech India 2026

Smart Production Solutions Guangzhou 2026
Whitepaper
- Middle East & Africa Commercial Security Market Click here to view more.
- Middle East & Africa Fire Safety Systems & Equipment Market Click here to view more.
- GCC Drone Market Click here to view more.
- Middle East Lighting Fixture Market Click here to view more.
- GCC Physical & Perimeter Security Market Click here to view more.
6WResearch In News
- Doha a strategic location for EV manufacturing hub: IPA Qatar
- Demand for luxury TVs surging in the GCC, says Samsung
- Empowering Growth: The Thriving Journey of Bangladesh’s Cable Industry
- Demand for luxury TVs surging in the GCC, says Samsung
- Video call with a traditional healer? Once unthinkable, it’s now common in South Africa
- Intelligent Buildings To Smooth GCC’s Path To Net Zero