Croatia Laboratory Electronic Balance Market (2026-2032) | Strategic Insights, Value, Outlook, Drivers, Demand, Restraints, Pricing Analysis, Companies, Supply, Strategy, Competition, Consumer Insights, Investment Trends, Industry, Share, Size, Segmentation, Trends, Analysis, Segments, Opportunities, Forecast, Competitive, Growth, Challenges, Revenue
Market Forecast By Product Type (Analytical Balance, Precision Balance, Microbalance, Top-Loading Balance, Portable Balance), By Capacity Range (Below 100g, 100g-500g, 500g-1000g, 1kg-5kg, Above 5kg), By Accuracy Level (0.0001g, 0.001g, 0.01g, 0.1g, 1g), By Application (Pharmaceutical Testing, Chemical Analysis, Clinical Diagnostics, Food & Beverage Testing, Industrial Weighing), By End User (Research Labs, Academic Institutes, Hospitals, Diagnostic Centers, Industrial Labs) And Competitive Landscape
| Product Code: ETC12616469 | Publication Date: Apr 2025 | Updated Date: Apr 2026 | Product Type: Market Research Report | |
| Publisher: 6Wresearch | No. of Pages: 65 | No. of Figures: 34 | No. of Tables: 19 | |
Croatia Laboratory Electronic Balance Market Size (2020-2030)
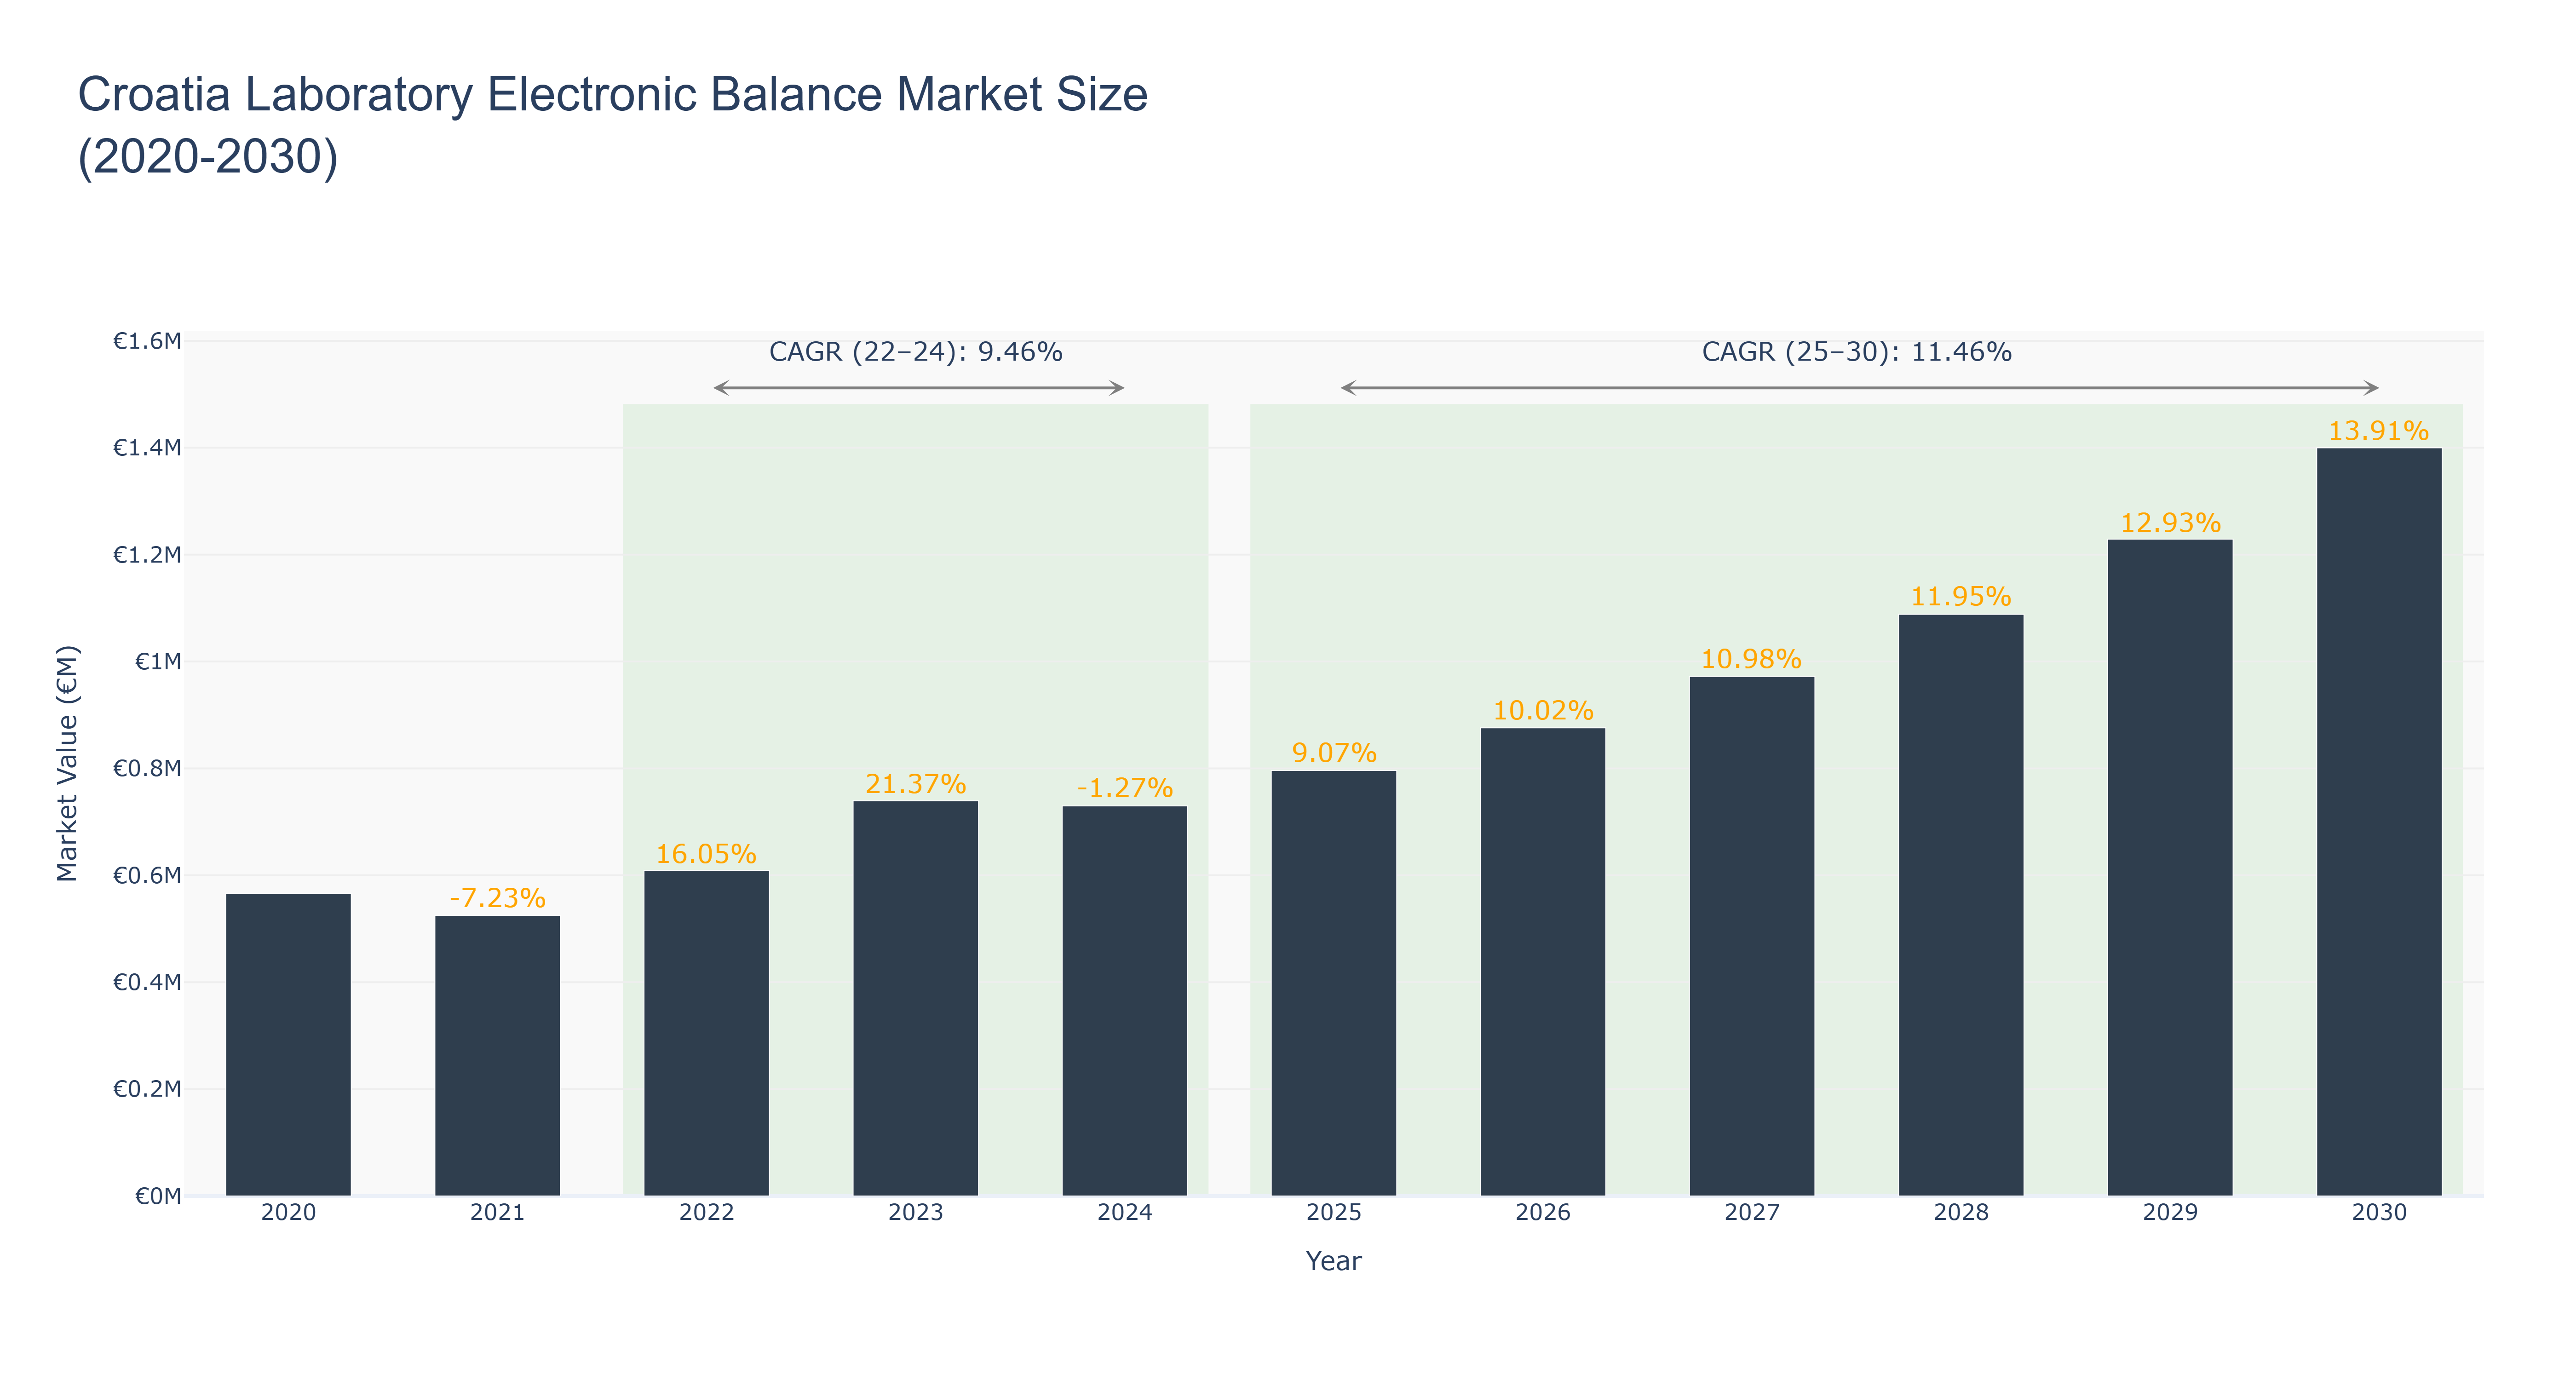
Croatia's Laboratory Electronic Balance Market has shown a fluctuating trend over the past decade. The peak market size was €1.40 million in 2030, with a steady growth rate. From 2020 to 2024, the market size ranged from €0.57 million to €0.73 million, experiencing both negative and positive growth rates. The forecasted market size from 2025 to 2030 is projected to increase significantly, with a CAGR of 11.46% post-2025, indicating a promising future for the market. The downfall observed in the earlier years could be attributed to economic uncertainties and technological disruptions, while the recent growth is likely driven by increasing adoption of precision instruments in research and development activities. Looking ahead, Croatia is planning to introduce new regulations to enhance quality standards in laboratory equipment, which is expected to further boost the market's growth trajectory.
Croatia Laboratory Electronic Balance Market: Production & Trade Performance (2019-2025)
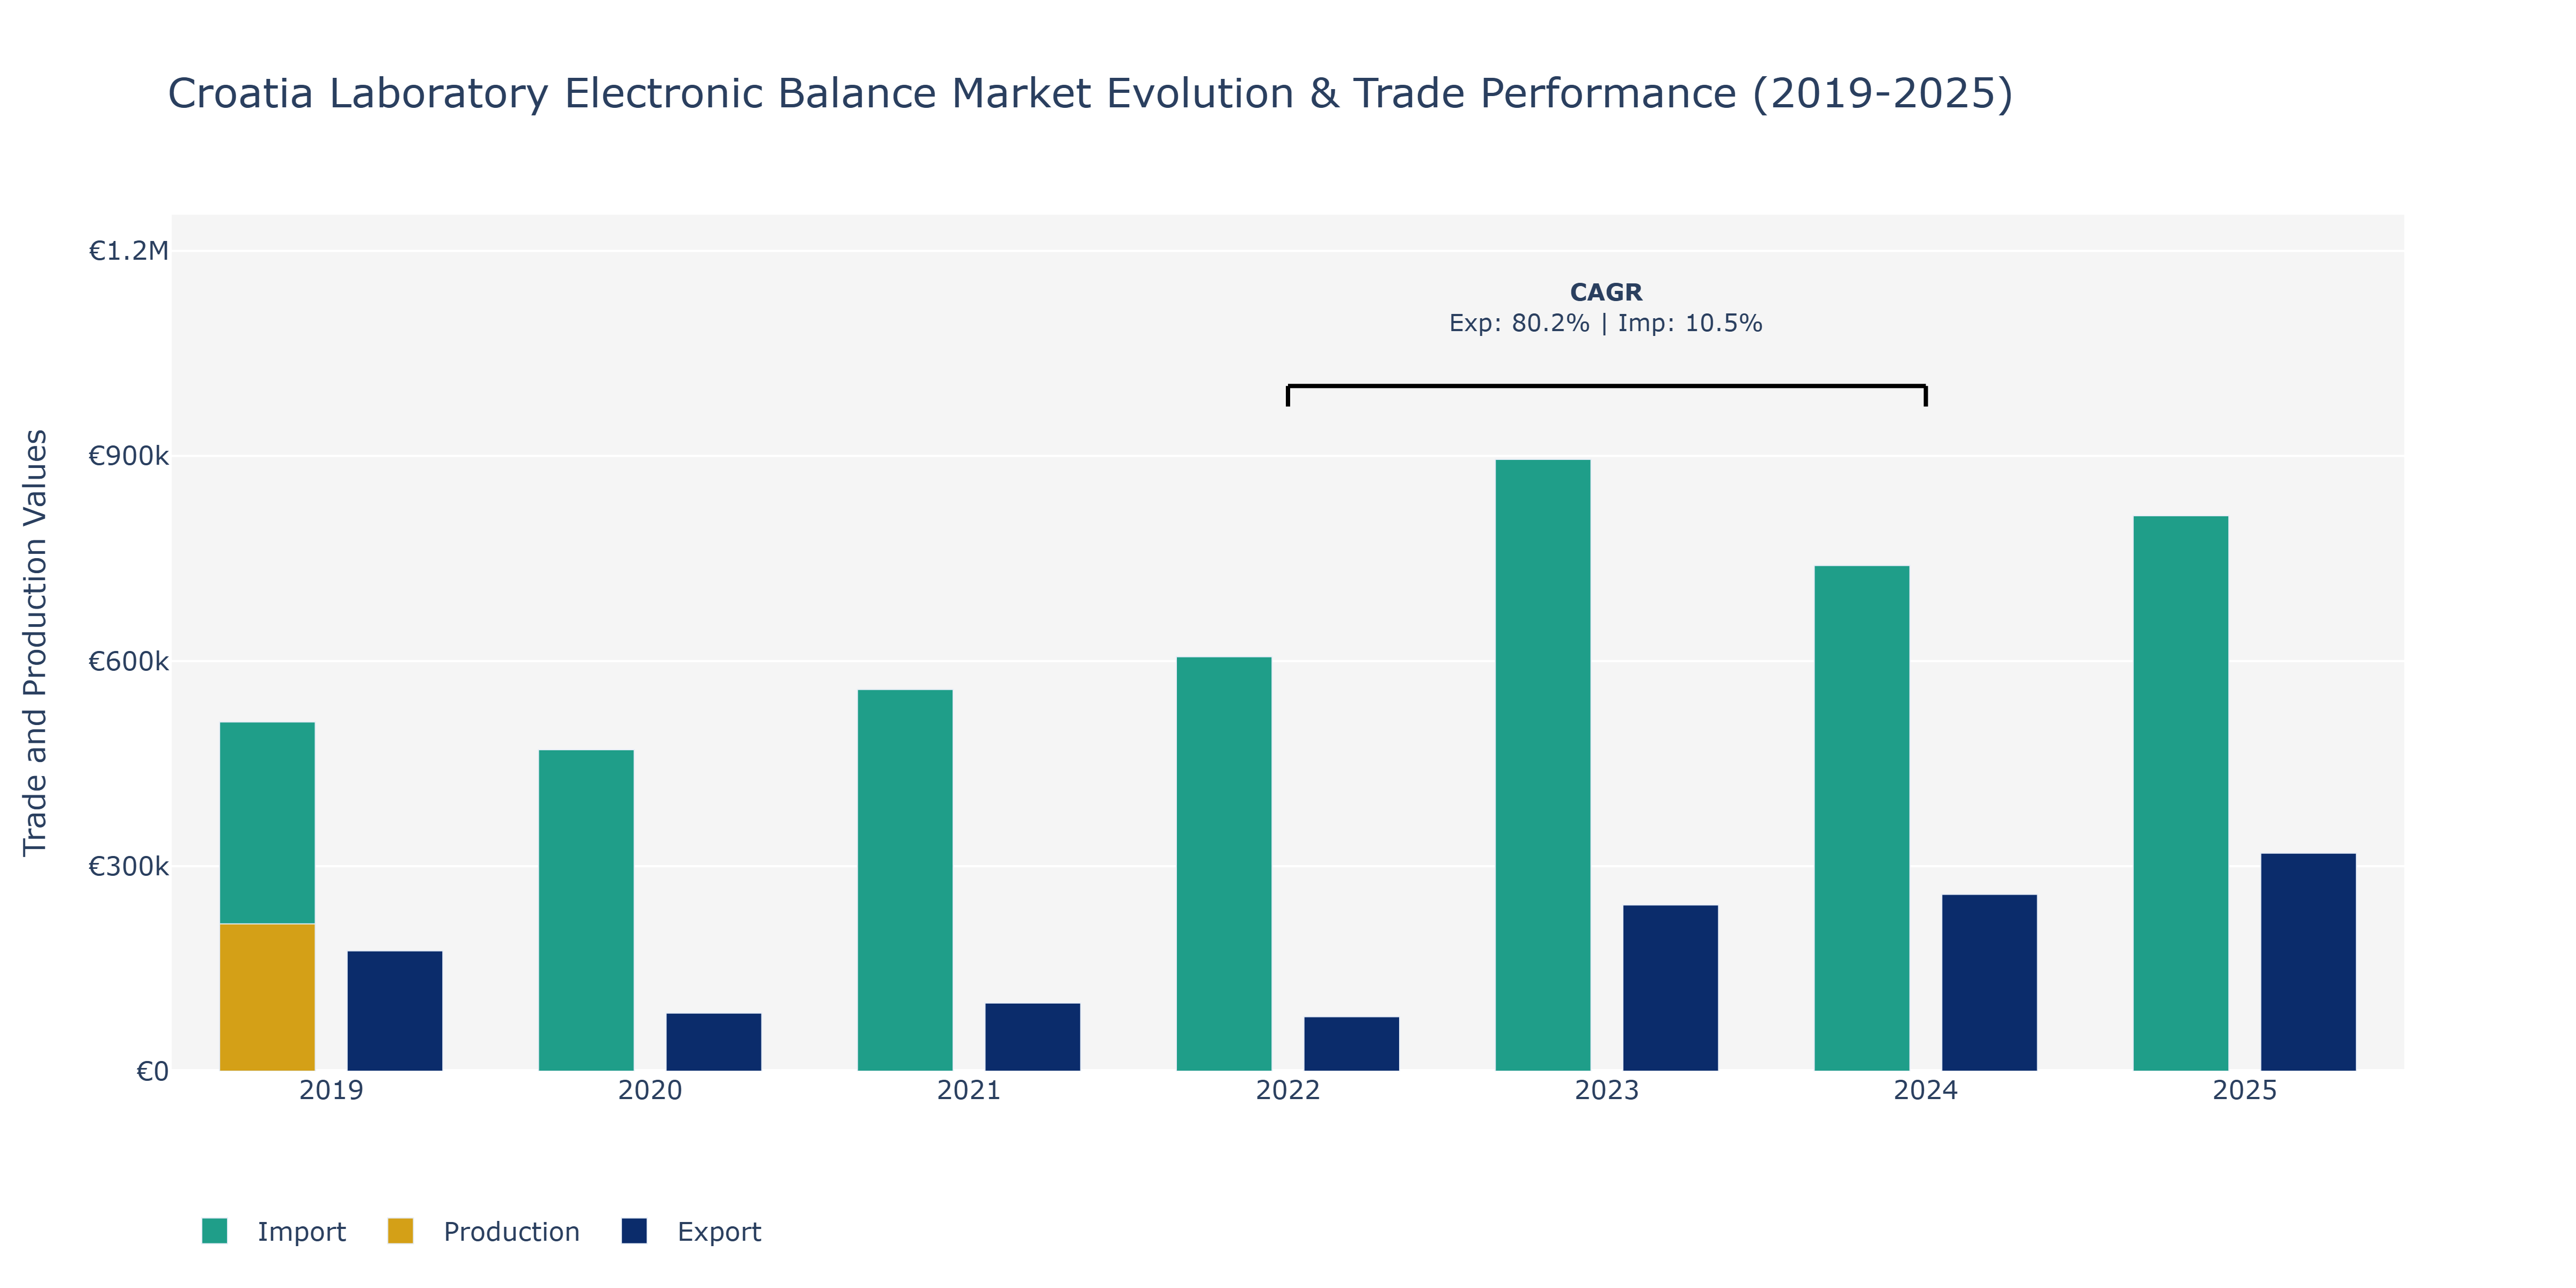
In the Croatia Laboratory Electronic Balance Market, exports experienced a notable fluctuation over the years, starting at €176.04 thousand in 2019, dropping to €84.98 thousand in 2020, and then slowly recovering to €318.98 thousand in 2025. This growth may be attributed to increased demand for precision measuring instruments in the scientific and healthcare sectors. Imports, on the other hand, followed a more consistent upward trend, rising from €510.81 thousand in 2019 to €812.53 thousand in 2025, possibly driven by the need for advanced technology and equipment in research facilities. Production value were available only for 2019, amounting to €215.41 million, suggesting a reliance on imported electronic balance equipment to meet domestic market demand. The contrasting trends between exports and imports signify Croatia's position as both a consumer and supplier in the global laboratory equipment market, emphasizing the country's role in the industry's supply chain dynamics.
Key Highlights of the Report:
- Croatia Laboratory Electronic Balance Market Outlook
- Market Size of Croatia Laboratory Electronic Balance Market, 2025
- Forecast of Croatia Laboratory Electronic Balance Market, 2032
- Historical Data and Forecast of Croatia Laboratory Electronic Balance Revenues & Volume for the Period 2022 - 2032F
- Croatia Laboratory Electronic Balance Market Trend Evolution
- Croatia Laboratory Electronic Balance Market Drivers and Challenges
- Croatia Laboratory Electronic Balance Price Trends
- Croatia Laboratory Electronic Balance Porter's Five Forces
- Croatia Laboratory Electronic Balance Industry Life Cycle
- Historical Data and Forecast of Croatia Laboratory Electronic Balance Market Revenues & Volume By Product Type for the Period 2022 - 2032F
- Historical Data and Forecast of Croatia Laboratory Electronic Balance Market Revenues & Volume By Analytical Balance for the Period 2022 - 2032F
- Historical Data and Forecast of Croatia Laboratory Electronic Balance Market Revenues & Volume By Precision Balance for the Period 2022 - 2032F
- Historical Data and Forecast of Croatia Laboratory Electronic Balance Market Revenues & Volume By Microbalance for the Period 2022 - 2032F
- Historical Data and Forecast of Croatia Laboratory Electronic Balance Market Revenues & Volume By Top-Loading Balance for the Period 2022 - 2032F
- Historical Data and Forecast of Croatia Laboratory Electronic Balance Market Revenues & Volume By Portable Balance for the Period 2022 - 2032F
- Historical Data and Forecast of Croatia Laboratory Electronic Balance Market Revenues & Volume By Capacity Range for the Period 2022 - 2032F
- Historical Data and Forecast of Croatia Laboratory Electronic Balance Market Revenues & Volume By Below 100g for the Period 2022 - 2032F
- Historical Data and Forecast of Croatia Laboratory Electronic Balance Market Revenues & Volume By 100g-500g for the Period 2022 - 2032F
- Historical Data and Forecast of Croatia Laboratory Electronic Balance Market Revenues & Volume By 500g-1000g for the Period 2022 - 2032F
- Historical Data and Forecast of Croatia Laboratory Electronic Balance Market Revenues & Volume By 1kg-5kg for the Period 2022 - 2032F
- Historical Data and Forecast of Croatia Laboratory Electronic Balance Market Revenues & Volume By Above 5kg for the Period 2022 - 2032F
- Historical Data and Forecast of Croatia Laboratory Electronic Balance Market Revenues & Volume By Accuracy Level for the Period 2022 - 2032F
- Historical Data and Forecast of Croatia Laboratory Electronic Balance Market Revenues & Volume By 0.0001g for the Period 2022 - 2032F
- Historical Data and Forecast of Croatia Laboratory Electronic Balance Market Revenues & Volume By 0.001g for the Period 2022 - 2032F
- Historical Data and Forecast of Croatia Laboratory Electronic Balance Market Revenues & Volume By 0.01g for the Period 2022 - 2032F
- Historical Data and Forecast of Croatia Laboratory Electronic Balance Market Revenues & Volume By 0.1g for the Period 2022 - 2032F
- Historical Data and Forecast of Croatia Laboratory Electronic Balance Market Revenues & Volume By 1g for the Period 2022 - 2032F
- Historical Data and Forecast of Croatia Laboratory Electronic Balance Market Revenues & Volume By Application for the Period 2022 - 2032F
- Historical Data and Forecast of Croatia Laboratory Electronic Balance Market Revenues & Volume By Pharmaceutical Testing for the Period 2022 - 2032F
- Historical Data and Forecast of Croatia Laboratory Electronic Balance Market Revenues & Volume By Chemical Analysis for the Period 2022 - 2032F
- Historical Data and Forecast of Croatia Laboratory Electronic Balance Market Revenues & Volume By Clinical Diagnostics for the Period 2022 - 2032F
- Historical Data and Forecast of Croatia Laboratory Electronic Balance Market Revenues & Volume By Food & Beverage Testing for the Period 2022 - 2032F
- Historical Data and Forecast of Croatia Laboratory Electronic Balance Market Revenues & Volume By Industrial Weighing for the Period 2022 - 2032F
- Historical Data and Forecast of Croatia Laboratory Electronic Balance Market Revenues & Volume By End User for the Period 2022 - 2032F
- Historical Data and Forecast of Croatia Laboratory Electronic Balance Market Revenues & Volume By Research Labs for the Period 2022 - 2032F
- Historical Data and Forecast of Croatia Laboratory Electronic Balance Market Revenues & Volume By Academic Institutes for the Period 2022 - 2032F
- Historical Data and Forecast of Croatia Laboratory Electronic Balance Market Revenues & Volume By Hospitals for the Period 2022 - 2032F
- Historical Data and Forecast of Croatia Laboratory Electronic Balance Market Revenues & Volume By Diagnostic Centers for the Period 2022 - 2032F
- Historical Data and Forecast of Croatia Laboratory Electronic Balance Market Revenues & Volume By Industrial Labs for the Period 2022 - 2032F
- Croatia Laboratory Electronic Balance Import Export Trade Statistics
- Market Opportunity Assessment By Product Type
- Market Opportunity Assessment By Capacity Range
- Market Opportunity Assessment By Accuracy Level
- Market Opportunity Assessment By Application
- Market Opportunity Assessment By End User
- Croatia Laboratory Electronic Balance Top Companies Market Share
- Croatia Laboratory Electronic Balance Competitive Benchmarking By Technical and Operational Parameters
- Croatia Laboratory Electronic Balance Company Profiles
- Croatia Laboratory Electronic Balance Key Strategic Recommendations
Frequently Asked Questions About the Market Study (FAQs):
6Wresearch actively monitors the Croatia Laboratory Electronic Balance Market and publishes its comprehensive annual report, highlighting emerging trends, growth drivers, revenue analysis, and forecast outlook. Our insights help businesses to make data-backed strategic decisions with ongoing market dynamics. Our analysts track relevent industries related to the Croatia Laboratory Electronic Balance Market, allowing our clients with actionable intelligence and reliable forecasts tailored to emerging regional needs.
Yes, we provide customisation as per your requirements. To learn more, feel free to contact us on sales@6wresearch.com
1 Executive Summary |
2 Introduction |
2.1 Key Highlights of the Report |
2.2 Report Description |
2.3 Market Scope & Segmentation |
2.4 Research Methodology |
2.5 Assumptions |
3 Croatia Laboratory Electronic Balance Market Overview |
3.1 Croatia Country Macro Economic Indicators |
3.2 Croatia Laboratory Electronic Balance Market Revenues & Volume, 2022 & 2032F |
3.3 Croatia Laboratory Electronic Balance Market - Industry Life Cycle |
3.4 Croatia Laboratory Electronic Balance Market - Porter's Five Forces |
3.5 Croatia Laboratory Electronic Balance Market Revenues & Volume Share, By Product Type, 2022 & 2032F |
3.6 Croatia Laboratory Electronic Balance Market Revenues & Volume Share, By Capacity Range, 2022 & 2032F |
3.7 Croatia Laboratory Electronic Balance Market Revenues & Volume Share, By Accuracy Level, 2022 & 2032F |
3.8 Croatia Laboratory Electronic Balance Market Revenues & Volume Share, By Application, 2022 & 2032F |
3.9 Croatia Laboratory Electronic Balance Market Revenues & Volume Share, By End User, 2022 & 2032F |
4 Croatia Laboratory Electronic Balance Market Dynamics |
4.1 Impact Analysis |
4.2 Market Drivers |
4.2.1 Increasing demand for precision and accuracy in laboratory measurements |
4.2.2 Technological advancements leading to more efficient and reliable electronic balance systems |
4.2.3 Growth in research and development activities in various industries requiring laboratory electronic balances |
4.3 Market Restraints |
4.3.1 High initial investment costs associated with purchasing laboratory electronic balances |
4.3.2 Limited awareness and adoption of advanced electronic balance technologies in some segments of the market |
4.3.3 Regulatory challenges and compliance requirements impacting market entry and growth |
5 Croatia Laboratory Electronic Balance Market Trends |
6 Croatia Laboratory Electronic Balance Market, By Types |
6.1 Croatia Laboratory Electronic Balance Market, By Product Type |
6.1.1 Overview and Analysis |
6.1.2 Croatia Laboratory Electronic Balance Market Revenues & Volume, By Product Type, 2022 - 2032F |
6.1.3 Croatia Laboratory Electronic Balance Market Revenues & Volume, By Analytical Balance, 2022 - 2032F |
6.1.4 Croatia Laboratory Electronic Balance Market Revenues & Volume, By Precision Balance, 2022 - 2032F |
6.1.5 Croatia Laboratory Electronic Balance Market Revenues & Volume, By Microbalance, 2022 - 2032F |
6.1.6 Croatia Laboratory Electronic Balance Market Revenues & Volume, By Top-Loading Balance, 2022 - 2032F |
6.1.7 Croatia Laboratory Electronic Balance Market Revenues & Volume, By Portable Balance, 2022 - 2032F |
6.2 Croatia Laboratory Electronic Balance Market, By Capacity Range |
6.2.1 Overview and Analysis |
6.2.2 Croatia Laboratory Electronic Balance Market Revenues & Volume, By Below 100g, 2022 - 2032F |
6.2.3 Croatia Laboratory Electronic Balance Market Revenues & Volume, By 100g-500g, 2022 - 2032F |
6.2.4 Croatia Laboratory Electronic Balance Market Revenues & Volume, By 500g-1000g, 2022 - 2032F |
6.2.5 Croatia Laboratory Electronic Balance Market Revenues & Volume, By 1kg-5kg, 2022 - 2032F |
6.2.6 Croatia Laboratory Electronic Balance Market Revenues & Volume, By Above 5kg, 2022 - 2032F |
6.3 Croatia Laboratory Electronic Balance Market, By Accuracy Level |
6.3.1 Overview and Analysis |
6.3.2 Croatia Laboratory Electronic Balance Market Revenues & Volume, By 0.0001g, 2022 - 2032F |
6.3.3 Croatia Laboratory Electronic Balance Market Revenues & Volume, By 0.001g, 2022 - 2032F |
6.3.4 Croatia Laboratory Electronic Balance Market Revenues & Volume, By 0.01g, 2022 - 2032F |
6.3.5 Croatia Laboratory Electronic Balance Market Revenues & Volume, By 0.1g, 2022 - 2032F |
6.3.6 Croatia Laboratory Electronic Balance Market Revenues & Volume, By 1g, 2022 - 2032F |
6.4 Croatia Laboratory Electronic Balance Market, By Application |
6.4.1 Overview and Analysis |
6.4.2 Croatia Laboratory Electronic Balance Market Revenues & Volume, By Pharmaceutical Testing, 2022 - 2032F |
6.4.3 Croatia Laboratory Electronic Balance Market Revenues & Volume, By Chemical Analysis, 2022 - 2032F |
6.4.4 Croatia Laboratory Electronic Balance Market Revenues & Volume, By Clinical Diagnostics, 2022 - 2032F |
6.4.5 Croatia Laboratory Electronic Balance Market Revenues & Volume, By Food & Beverage Testing, 2022 - 2032F |
6.4.6 Croatia Laboratory Electronic Balance Market Revenues & Volume, By Industrial Weighing, 2022 - 2032F |
6.5 Croatia Laboratory Electronic Balance Market, By End User |
6.5.1 Overview and Analysis |
6.5.2 Croatia Laboratory Electronic Balance Market Revenues & Volume, By Research Labs, 2022 - 2032F |
6.5.3 Croatia Laboratory Electronic Balance Market Revenues & Volume, By Academic Institutes, 2022 - 2032F |
6.5.4 Croatia Laboratory Electronic Balance Market Revenues & Volume, By Hospitals, 2022 - 2032F |
6.5.5 Croatia Laboratory Electronic Balance Market Revenues & Volume, By Diagnostic Centers, 2022 - 2032F |
6.5.6 Croatia Laboratory Electronic Balance Market Revenues & Volume, By Industrial Labs, 2022 - 2032F |
7 Croatia Laboratory Electronic Balance Market Import-Export Trade Statistics |
7.1 Croatia Laboratory Electronic Balance Market Export to Major Countries |
7.2 Croatia Laboratory Electronic Balance Market Imports from Major Countries |
8 Croatia Laboratory Electronic Balance Market Key Performance Indicators |
8.1 Average time taken for calibration and accuracy verification of electronic balances |
8.2 Percentage of laboratories adopting automated calibration processes |
8.3 Rate of adoption of cloud-based data management solutions for electronic balances |
8.4 Number of research collaborations between industry players and academic institutions for developing innovative electronic balance technologies |
8.5 Percentage of market players investing in RD for enhancing the performance and features of electronic balances |
9 Croatia Laboratory Electronic Balance Market - Opportunity Assessment |
9.1 Croatia Laboratory Electronic Balance Market Opportunity Assessment, By Product Type, 2022 & 2032F |
9.2 Croatia Laboratory Electronic Balance Market Opportunity Assessment, By Capacity Range, 2022 & 2032F |
9.3 Croatia Laboratory Electronic Balance Market Opportunity Assessment, By Accuracy Level, 2022 & 2032F |
9.4 Croatia Laboratory Electronic Balance Market Opportunity Assessment, By Application, 2022 & 2032F |
9.5 Croatia Laboratory Electronic Balance Market Opportunity Assessment, By End User, 2022 & 2032F |
10 Croatia Laboratory Electronic Balance Market - Competitive Landscape |
10.1 Croatia Laboratory Electronic Balance Market Revenue Share, By Companies, 2025 |
10.2 Croatia Laboratory Electronic Balance Market Competitive Benchmarking, By Operating and Technical Parameters |
11 Company Profiles |
12 Recommendations |
13 Disclaimer |
Global Go To Market Strategy - 2030
Export potential enables firms to identify high-growth global markets with greater confidence by combining advanced trade intelligence with a structured quantitative methodology. The framework analyzes emerging demand trends and country-level import patterns while integrating macroeconomic and trade datasets such as GDP and population forecasts, bilateral import–export flows, tariff structures, elasticity differentials between developed and developing economies, geographic distance, and import demand projections. Using weighted trade values from 2020–2024 as the base period to project country-to-country export potential for 2030, these inputs are operationalized through calculated drivers such as gravity model parameters, tariff impact factors, and projected GDP per-capita growth. Through an analysis of hidden potentials, demand hotspots, and market conditions that are most favorable to success, this method enables firms to focus on target countries, maximize returns, and global expansion with data, backed by accuracy.
By factoring in the projected importer demand gap that is currently unmet and could be potential opportunity, it identifies the potential for the Exporter (Country) among 190 countries, against the general trade analysis, which identifies the biggest importer or exporter.
To discover high-growth global markets and optimize your business strategy:
Click Here
Pricing
- Single User License$ 1,995
- Department License$ 2,400
- Site License$ 3,120
- Global License$ 3,795

Leadership Perspectives from Industry Events
Search
Thought Leadership and Analyst Meet


Our Clients
6WResearch In News
- Doha a strategic location for EV manufacturing hub: IPA Qatar
- Demand for luxury TVs surging in the GCC, says Samsung
- Empowering Growth: The Thriving Journey of Bangladesh’s Cable Industry
- Demand for luxury TVs surging in the GCC, says Samsung
- Video call with a traditional healer? Once unthinkable, it’s now common in South Africa
- Intelligent Buildings To Smooth GCC’s Path To Net Zero
Latest Reports
- Taiwan Airport Wireless Infrastructure Market (2026-2032)
- Vietnam Airport Wireless Infrastructure Market (2026-2032)
- Thailand Airport Wireless Infrastructure Market (2026-2032)
- South Korea Airport Wireless Infrastructure Market (2026-2032)
- Romania Airport Wireless Infrastructure Market (2026-2032)
- Qatar Airport Wireless Infrastructure Market (2026-2032)
- Philippines Airport Wireless Infrastructure Market (2026-2032)
- Japan Airport Wireless Infrastructure Market (2026-2032)
- Taiwan Airport Winter Services Market (2026-2032)
- Vietnam Airport Winter Services Market (2026-2032)
Industry Events and Analyst Meet

HIMTEX 2026

India Refining Summit 2026

India EV Show 2026

EV tech India Expo 2026

Auto Tech Asia 2026
Whitepaper
- Middle East & Africa Commercial Security Market Click here to view more.
- Middle East & Africa Fire Safety Systems & Equipment Market Click here to view more.
- GCC Drone Market Click here to view more.
- Middle East Lighting Fixture Market Click here to view more.
- GCC Physical & Perimeter Security Market Click here to view more.