Croatia Lead Foil Market (2026-2032) | Share, Forecast, Industry, Revenue, Trends, Size, Growth, Analysis, Outlook, Segmentation, Value & Companies
Market Forecast By Types (Thickness: Below 0.1mm, Thickness: 0.1mm-0.5mm, Thickness: 0.5mm-1mm), By Applications (Industrial, Others) And Competitive Landscape
| Product Code: ETC5070780 | Publication Date: Nov 2023 | Updated Date: Apr 2026 | Product Type: Market Research Report | |
| Publisher: 6Wresearch | Author: Shubham Padhi | No. of Pages: 60 | No. of Figures: 30 | No. of Tables: 5 |
Croatia Lead Foil Market Size (2020-2030)
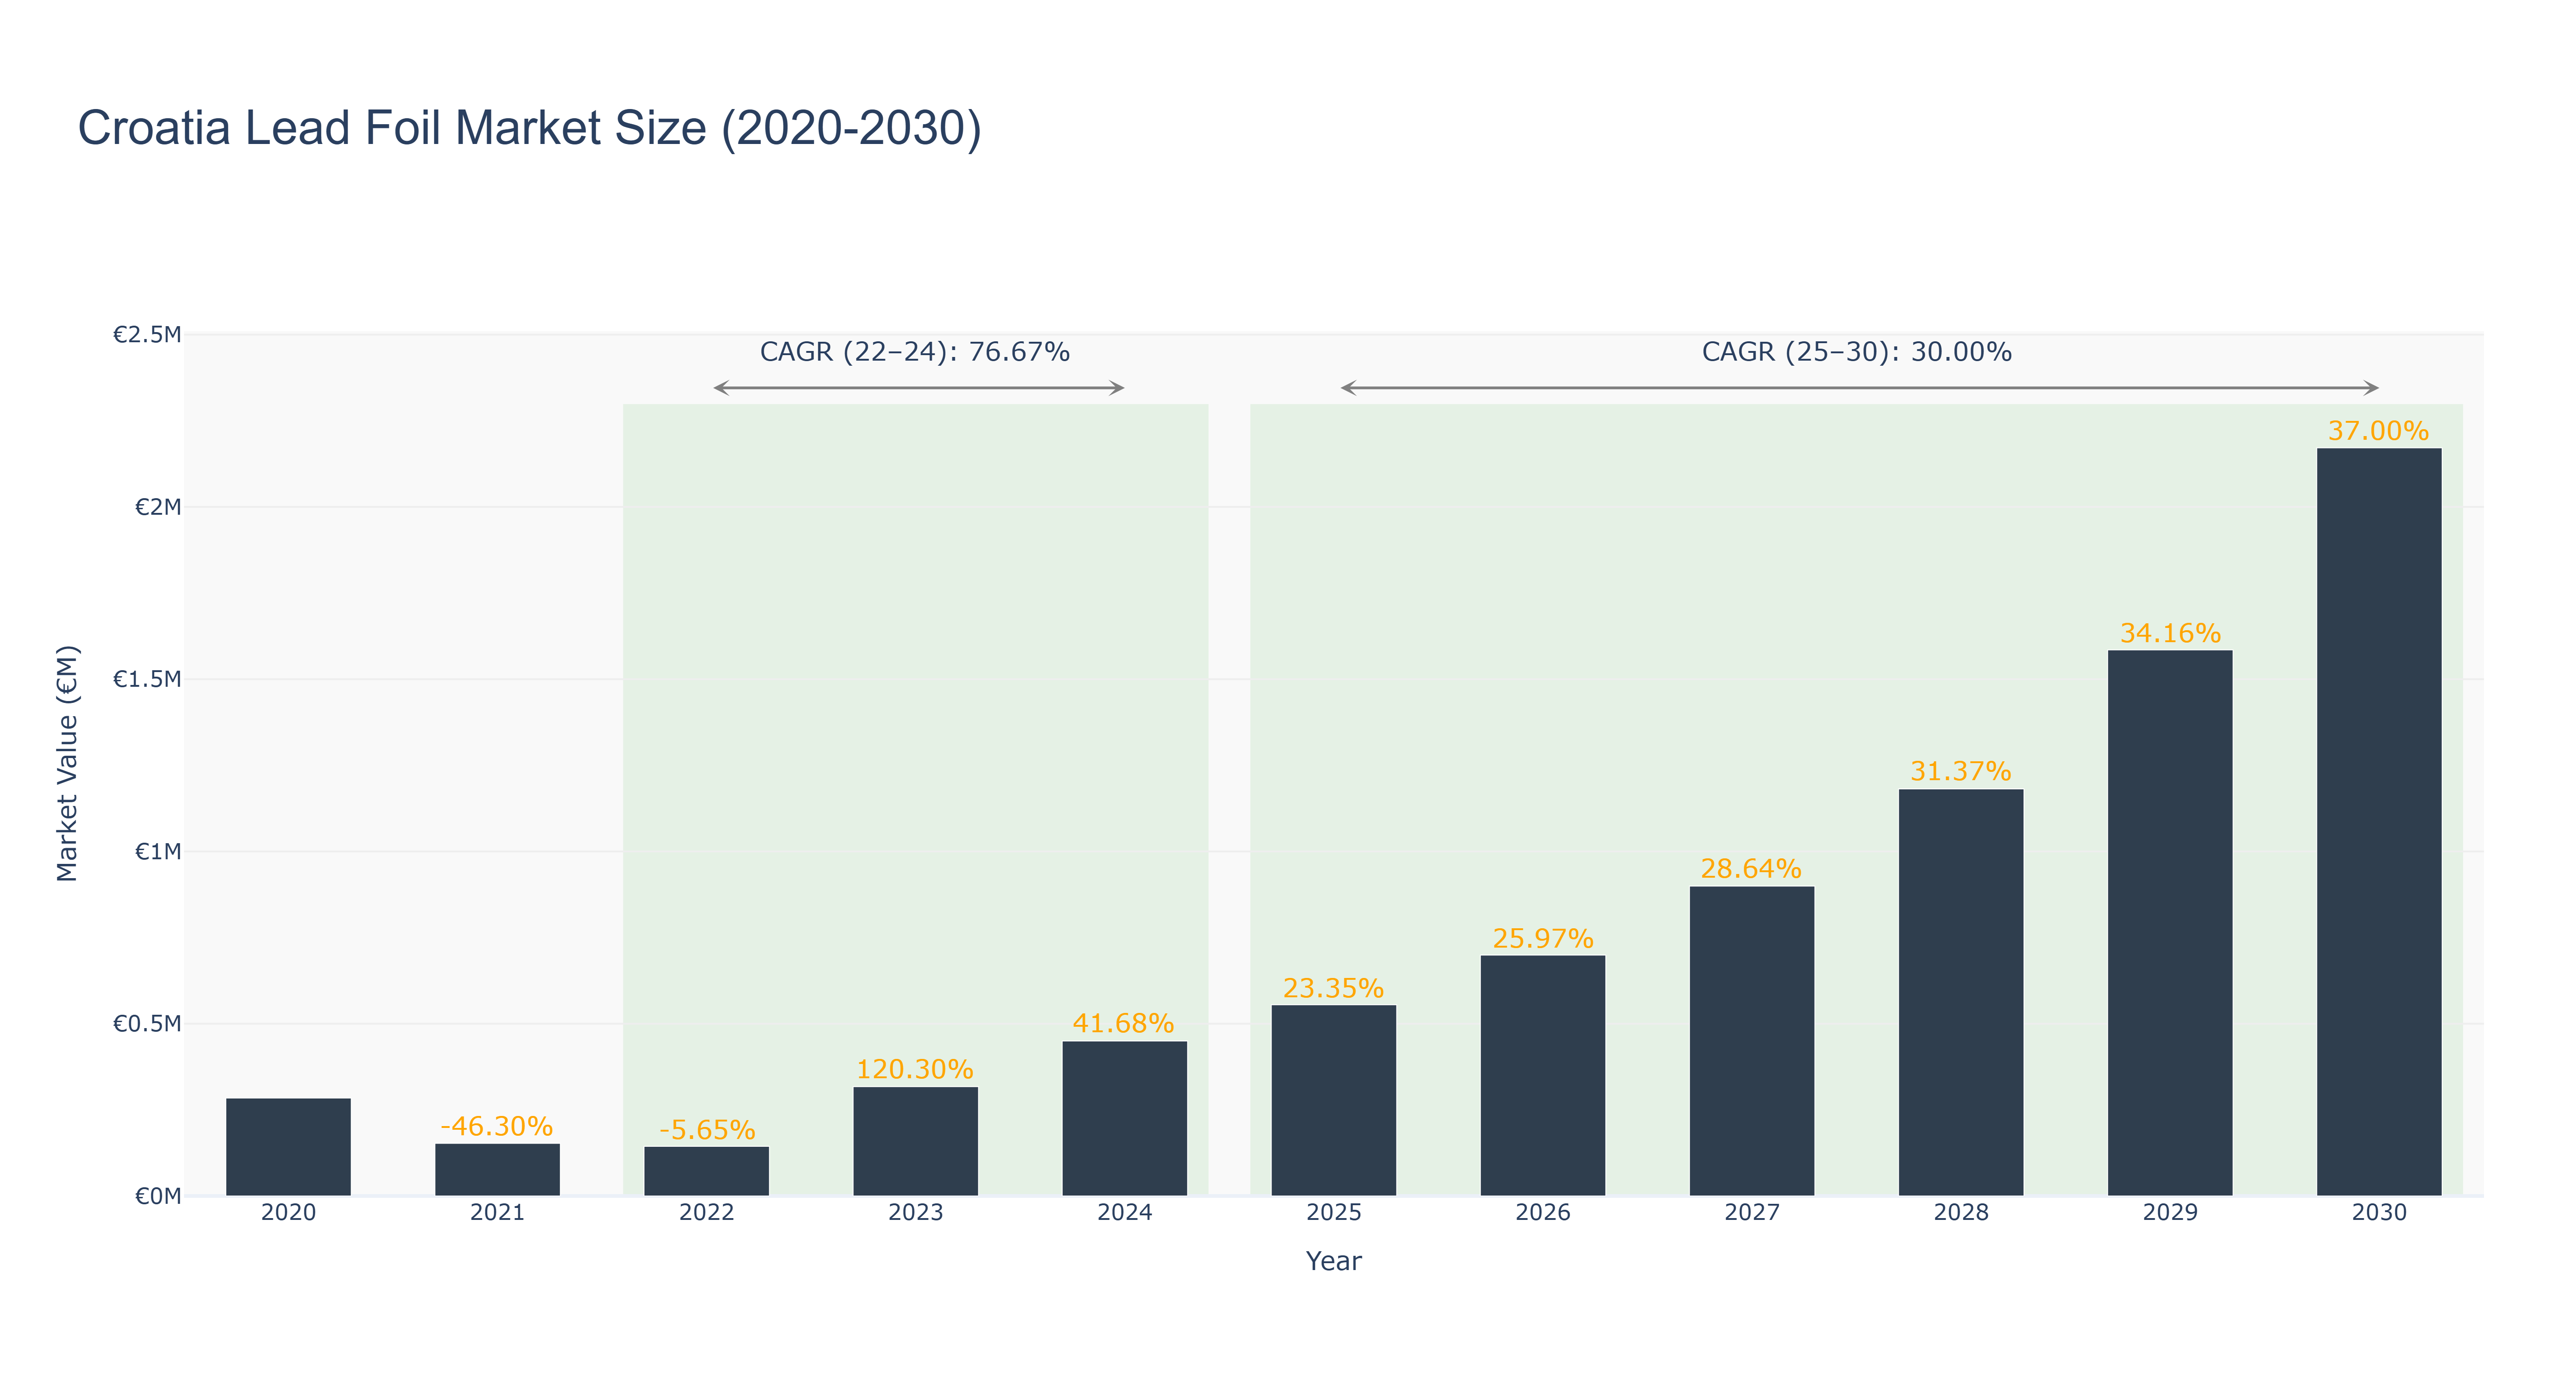
The Croatia Lead Foil Market experienced a significant growth trajectory from 2020 to 2030. The peak market size of €2.17 million was reached in 2030, with a steady increase from 2020 to 2024, where the market size grew from €0.28 million to €0.45 million, driven by technological advancements and increasing demand. The forecasted market size from 2025 to 2030 is expected to continue this upward trend, with a CAGR of 30.0%. The market's strong performance can be attributed to the growing applications of lead foil in various industries, such as healthcare and automotive. Looking ahead, upcoming projects in Croatia, such as investments in infrastructure and renewable energy, are set to further boost the demand for lead foil in the country, supporting the market's growth in the near future.
Croatia Lead Foil Market: Production & Trade Performance (2019-2025)
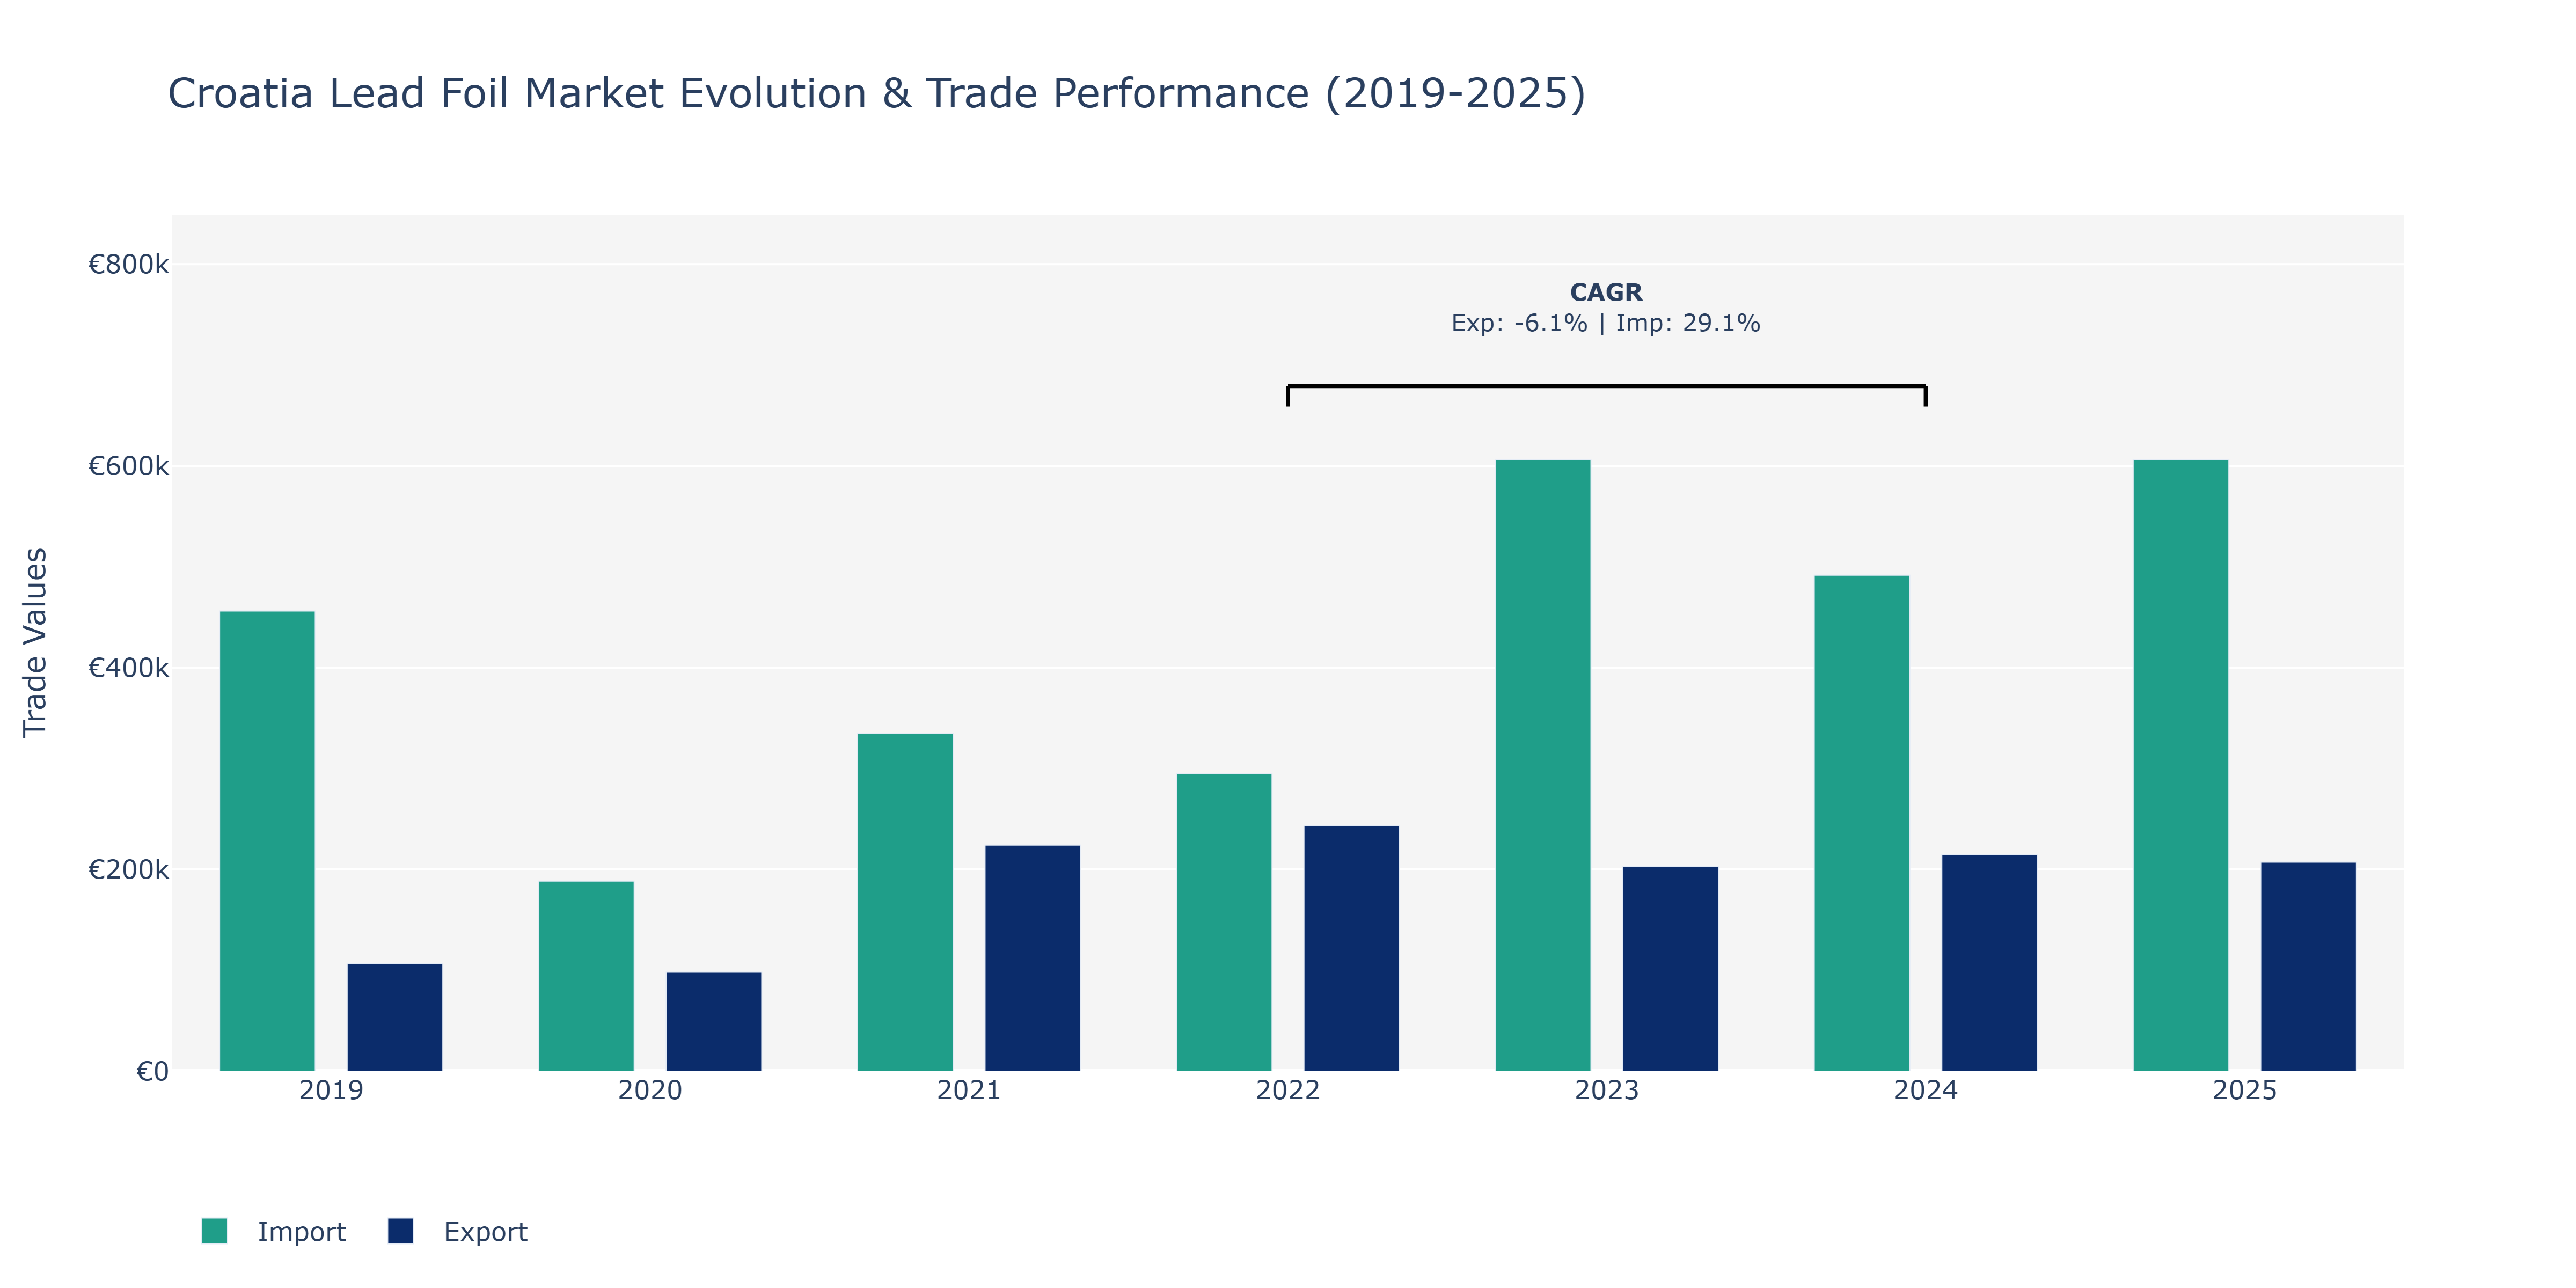
The Croatia Lead Foil Market witnessed fluctuations in both Exports and Imports over the years. In 2019, Imports significantly exceeded Exports, with Imports standing at €456.2 thousand while Exports were at €106.54 thousand. However, in 2020, there was a notable decrease in both Exports and Imports, with Exports at €98.14 thousand and Imports at €188.5 thousand. The market showed a positive trend in 2021, as Exports increased to €224.15 thousand and Imports to €334.68 thousand. Imports peaked in 2023, reaching €606.11 thousand, while Exports peaked in 2022 at €243.4 thousand. The fluctuations in Imports can be attributed to changing global demand for lead foil products, while the increase in Exports in 2022 could be due to strategic market expansion efforts by Croatian lead foil manufacturers. The decrease in Exports in 2023 might be a result of intensified competition from other lead foil-producing countries.
Key Highlights of the Report:
- Croatia Lead Foil Market Outlook
- Market Size of Croatia Lead Foil Market, 2025
- Forecast of Croatia Lead Foil Market, 2032
- Historical Data and Forecast of Croatia Lead Foil Revenues & Volume for the Period 2022 - 2032F
- Croatia Lead Foil Market Trend Evolution
- Croatia Lead Foil Market Drivers and Challenges
- Croatia Lead Foil Price Trends
- Croatia Lead Foil Porter`s Five Forces
- Croatia Lead Foil Industry Life Cycle
- Historical Data and Forecast of Croatia Lead Foil Market Revenues & Volume By Types for the Period 2022 - 2032F
- Historical Data and Forecast of Croatia Lead Foil Market Revenues & Volume By Thickness: Below 0.1mm for the Period 2022 - 2032F
- Historical Data and Forecast of Croatia Lead Foil Market Revenues & Volume By Thickness: 0.1mm-0.5mm for the Period 2022 - 2032F
- Historical Data and Forecast of Croatia Lead Foil Market Revenues & Volume By Thickness: 0.5mm-1mm for the Period 2022 - 2032F
- Historical Data and Forecast of Croatia Lead Foil Market Revenues & Volume By Applications for the Period 2022 - 2032F
- Historical Data and Forecast of Croatia Lead Foil Market Revenues & Volume By Industrial for the Period 2022 - 2032F
- Historical Data and Forecast of Croatia Lead Foil Market Revenues & Volume By Others for the Period 2022 - 2032F
- Croatia Lead Foil Import Export Trade Statistics
- Market Opportunity Assessment By Types
- Market Opportunity Assessment By Applications
- Croatia Lead Foil Top Companies Market Share
- Croatia Lead Foil Competitive Benchmarking By Technical and Operational Parameters
- Croatia Lead Foil Company Profiles
- Croatia Lead Foil Key Strategic Recommendations
Frequently Asked Questions About the Market Study (FAQs):
6Wresearch actively monitors the Croatia Lead Foil Market and publishes its comprehensive annual report, highlighting emerging trends, growth drivers, revenue analysis, and forecast outlook. Our insights help businesses to make data-backed strategic decisions with ongoing market dynamics. Our analysts track relevent industries related to the Croatia Lead Foil Market, allowing our clients with actionable intelligence and reliable forecasts tailored to emerging regional needs.
Yes, we provide customisation as per your requirements. To learn more, feel free to contact us on sales@6wresearch.com
1 Executive Summary |
2 Introduction |
2.1 Key Highlights of the Report |
2.2 Report Description |
2.3 Market Scope & Segmentation |
2.4 Research Methodology |
2.5 Assumptions |
3 Croatia Lead Foil Market Overview |
3.1 Croatia Country Macro Economic Indicators |
3.2 Croatia Lead Foil Market Revenues & Volume, 2022 & 2032F |
3.3 Croatia Lead Foil Market - Industry Life Cycle |
3.4 Croatia Lead Foil Market - Porter's Five Forces |
3.5 Croatia Lead Foil Market Revenues & Volume Share Segmentations, 2022 & 2032F |
3.6 Croatia Lead Foil Market Revenues & Volume Share, By Applications, 2022 & 2032F |
4 Croatia Lead Foil Market Dynamics |
4.1 Impact Analysis |
4.2 Market Drivers |
4.2.1 Increasing demand for lead foil in the healthcare industry for packaging and shielding purposes. |
4.2.2 Growth in the automotive sector leading to higher usage of lead foil in batteries and radiation shielding. |
4.2.3 Rising awareness about the benefits of lead foil in construction for soundproofing and radiation protection. |
4.3 Market Restraints |
4.3.1 Stringent environmental regulations limiting the use of lead in various industries. |
4.3.2 Volatility in raw material prices affecting the production cost of lead foil. |
4.3.3 Competition from alternative materials like aluminum and PVC impacting the market share of lead foil. |
5 Croatia Lead Foil Market Trends |
6 Croatia Lead Foil Market Segmentations |
6.1 Croatia Lead Foil Market Segmentations |
6.1.1 Overview and Analysis |
6.1.2 Croatia Lead Foil Market Revenues & Volume, By Thickness: Below 0.1mm, 2022 - 2032F |
6.1.3 Croatia Lead Foil Market Revenues & Volume, By Thickness: 0.1mm-0.5mm, 2022 - 2032F |
6.1.4 Croatia Lead Foil Market Revenues & Volume, By Thickness: 0.5mm-1mm, 2022 - 2032F |
6.2 Croatia Lead Foil Market, By Applications |
6.2.1 Overview and Analysis |
6.2.2 Croatia Lead Foil Market Revenues & Volume, By Industrial, 2022 - 2032F |
6.2.3 Croatia Lead Foil Market Revenues & Volume, By Others, 2022 - 2032F |
7 Croatia Lead Foil Market Import-Export Trade Statistics |
7.1 Croatia Lead Foil Market Export to Major Countries |
7.2 Croatia Lead Foil Market Imports from Major Countries |
8 Croatia Lead Foil Market Key Performance Indicators |
8.1 Average selling price of lead foil in Croatia. |
8.2 Number of new applications or industries adopting lead foil. |
8.3 Percentage increase in the recycling rate of lead foil in Croatia. |
9 Croatia Lead Foil Market - Opportunity Assessment |
9.1 Croatia Lead Foil Market Opportunity Assessment Segmentations, 2022 & 2032F |
9.2 Croatia Lead Foil Market Opportunity Assessment, By Applications, 2022 & 2032F |
10 Croatia Lead Foil Market - Competitive Landscape |
10.1 Croatia Lead Foil Market Revenue Share, By Companies, 2025 |
10.2 Croatia Lead Foil Market Competitive Benchmarking, By Operating and Technical Parameters |
11 Company Profiles |
12 Recommendations | 13 Disclaimer |
Global Go To Market Strategy - 2030
Export potential enables firms to identify high-growth global markets with greater confidence by combining advanced trade intelligence with a structured quantitative methodology. The framework analyzes emerging demand trends and country-level import patterns while integrating macroeconomic and trade datasets such as GDP and population forecasts, bilateral import–export flows, tariff structures, elasticity differentials between developed and developing economies, geographic distance, and import demand projections. Using weighted trade values from 2020–2024 as the base period to project country-to-country export potential for 2030, these inputs are operationalized through calculated drivers such as gravity model parameters, tariff impact factors, and projected GDP per-capita growth. Through an analysis of hidden potentials, demand hotspots, and market conditions that are most favorable to success, this method enables firms to focus on target countries, maximize returns, and global expansion with data, backed by accuracy.
By factoring in the projected importer demand gap that is currently unmet and could be potential opportunity, it identifies the potential for the Exporter (Country) among 190 countries, against the general trade analysis, which identifies the biggest importer or exporter.
To discover high-growth global markets and optimize your business strategy:
Click Here
Pricing
- Single User License$ 1,995
- Department License$ 2,400
- Site License$ 3,120
- Global License$ 3,795

Leadership Perspectives from Industry Events
Search
Thought Leadership and Analyst Meet


Our Clients
6WResearch In News
- Doha a strategic location for EV manufacturing hub: IPA Qatar
- Demand for luxury TVs surging in the GCC, says Samsung
- Empowering Growth: The Thriving Journey of Bangladesh’s Cable Industry
- Demand for luxury TVs surging in the GCC, says Samsung
- Video call with a traditional healer? Once unthinkable, it’s now common in South Africa
- Intelligent Buildings To Smooth GCC’s Path To Net Zero
Latest Reports
- Taiwan Airport Wireless Infrastructure Market (2026-2032)
- Vietnam Airport Wireless Infrastructure Market (2026-2032)
- Thailand Airport Wireless Infrastructure Market (2026-2032)
- South Korea Airport Wireless Infrastructure Market (2026-2032)
- Romania Airport Wireless Infrastructure Market (2026-2032)
- Qatar Airport Wireless Infrastructure Market (2026-2032)
- Philippines Airport Wireless Infrastructure Market (2026-2032)
- Japan Airport Wireless Infrastructure Market (2026-2032)
- Taiwan Airport Winter Services Market (2026-2032)
- Vietnam Airport Winter Services Market (2026-2032)
Industry Events and Analyst Meet

HIMTEX 2026

India Refining Summit 2026

India EV Show 2026

EV tech India Expo 2026

Auto Tech Asia 2026
Whitepaper
- Middle East & Africa Commercial Security Market Click here to view more.
- Middle East & Africa Fire Safety Systems & Equipment Market Click here to view more.
- GCC Drone Market Click here to view more.
- Middle East Lighting Fixture Market Click here to view more.
- GCC Physical & Perimeter Security Market Click here to view more.