Croatia Motorcycle Drive Chain Market (2026-2032) | Size & Revenue, Share, Forecast, Analysis, Trends, Industry, Outlook, Companies, Value, Segmentation, Competitive Landscape, Growth
Market Forecast By Types (Standard, Cruiser, Sports, Off-Road), By Chain type (Standard Rolling Chain, O Ring Chain, X Ring Chain), By Engine Capacity (Up to 150 CC, 151-300 CC, 301-500 CC, Above 500 CC), By Material Type (Mild Steel, Cast Steel, Cast Iron), By Distribution Channel (Online, Offline) And Competitive Landscape
| Product Code: ETC6856146 | Publication Date: Sep 2024 | Updated Date: Apr 2026 | Product Type: Market Research Report | |
| Publisher: 6Wresearch | Author: Dhaval Chaurasia | No. of Pages: 75 | No. of Figures: 35 | No. of Tables: 20 |
Croatia Motorcycle Drive Chain Market Size (2020-2030)
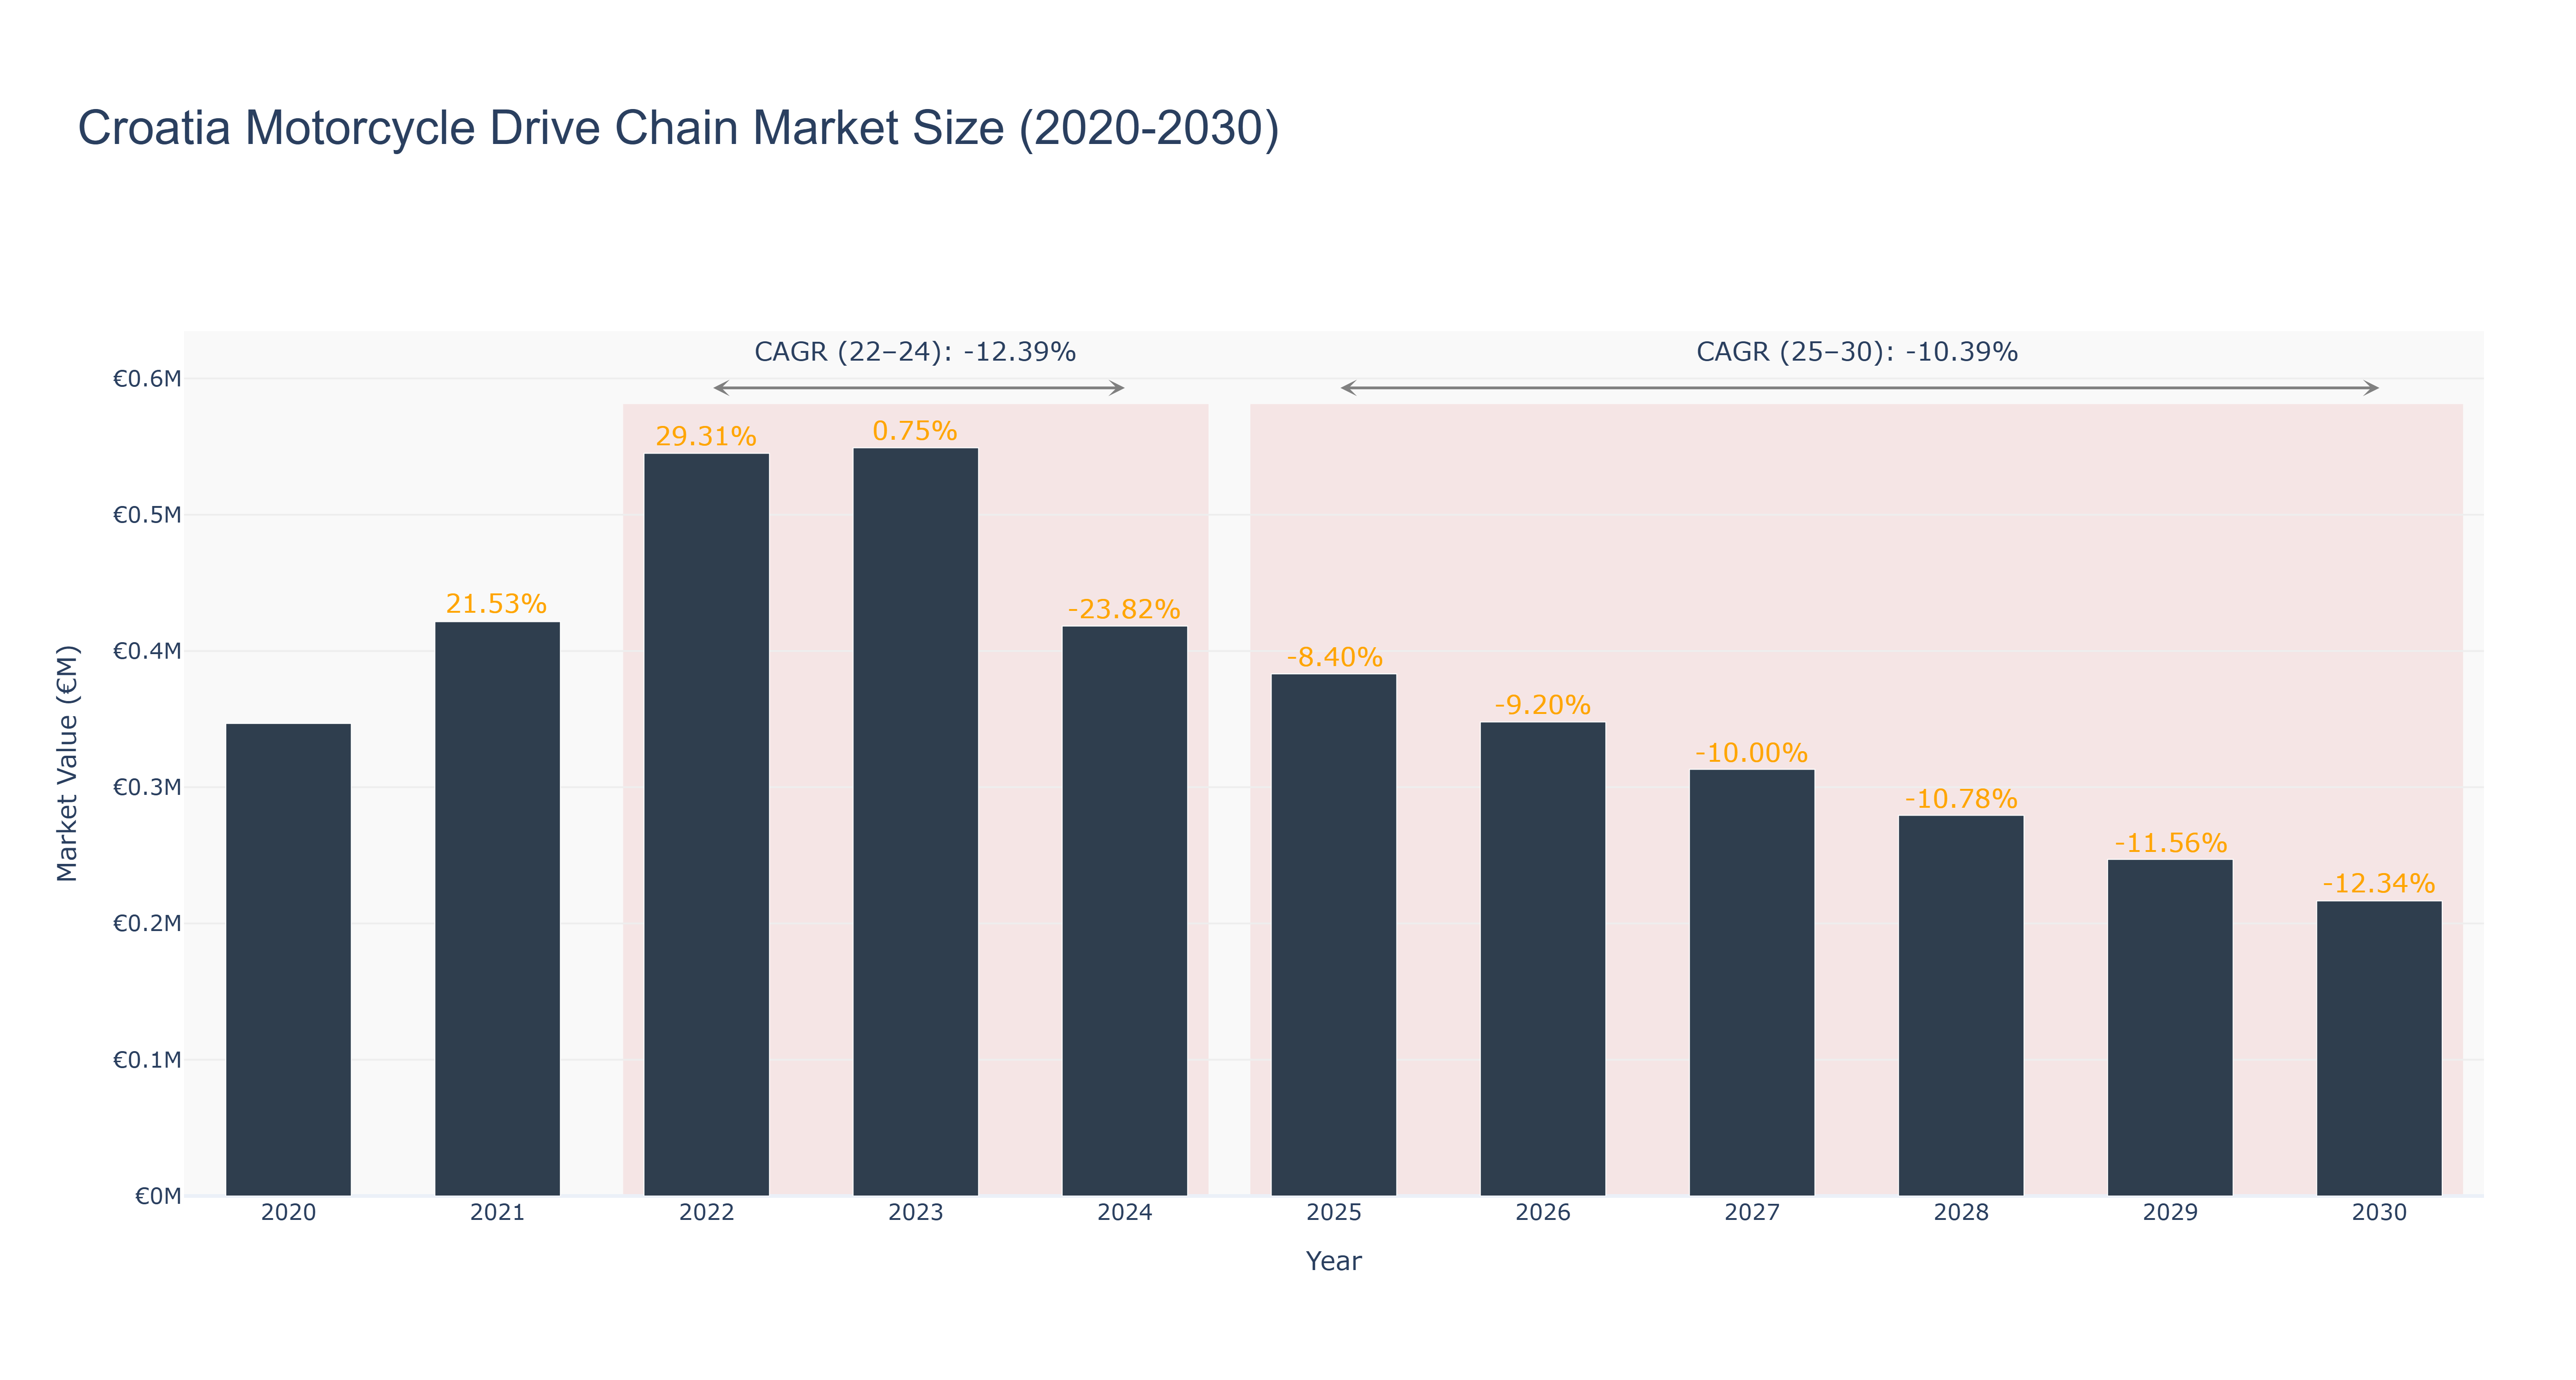
Croatia Motorcycle Drive Chain Market has seen fluctuations in recent years. The peak market size of €0.55 million was reached in 2022, followed by a decline to €0.38 million in 2025. Forecasted market size is expected to continue decreasing, reaching €0.22 million by 2030. The CAGR for the period 2022-24 was -12.39%, while for 2025-30 it is projected to be -10.39%. The market's downturn can be attributed to factors like economic challenges, changing consumer preferences, and technological advancements impacting the demand for traditional drive chains. Looking ahead, Croatia is set to invest in infrastructure projects to boost the automotive industry, potentially leading to opportunities for the motorcycle drive chain market in the future. Staying abreast of industry drivers such as sustainability initiatives and innovation will be crucial for market players to navigate the evolving landscape effectively.
Croatia Motorcycle Drive Chain Market: Production & Trade Performance (2019-2025)
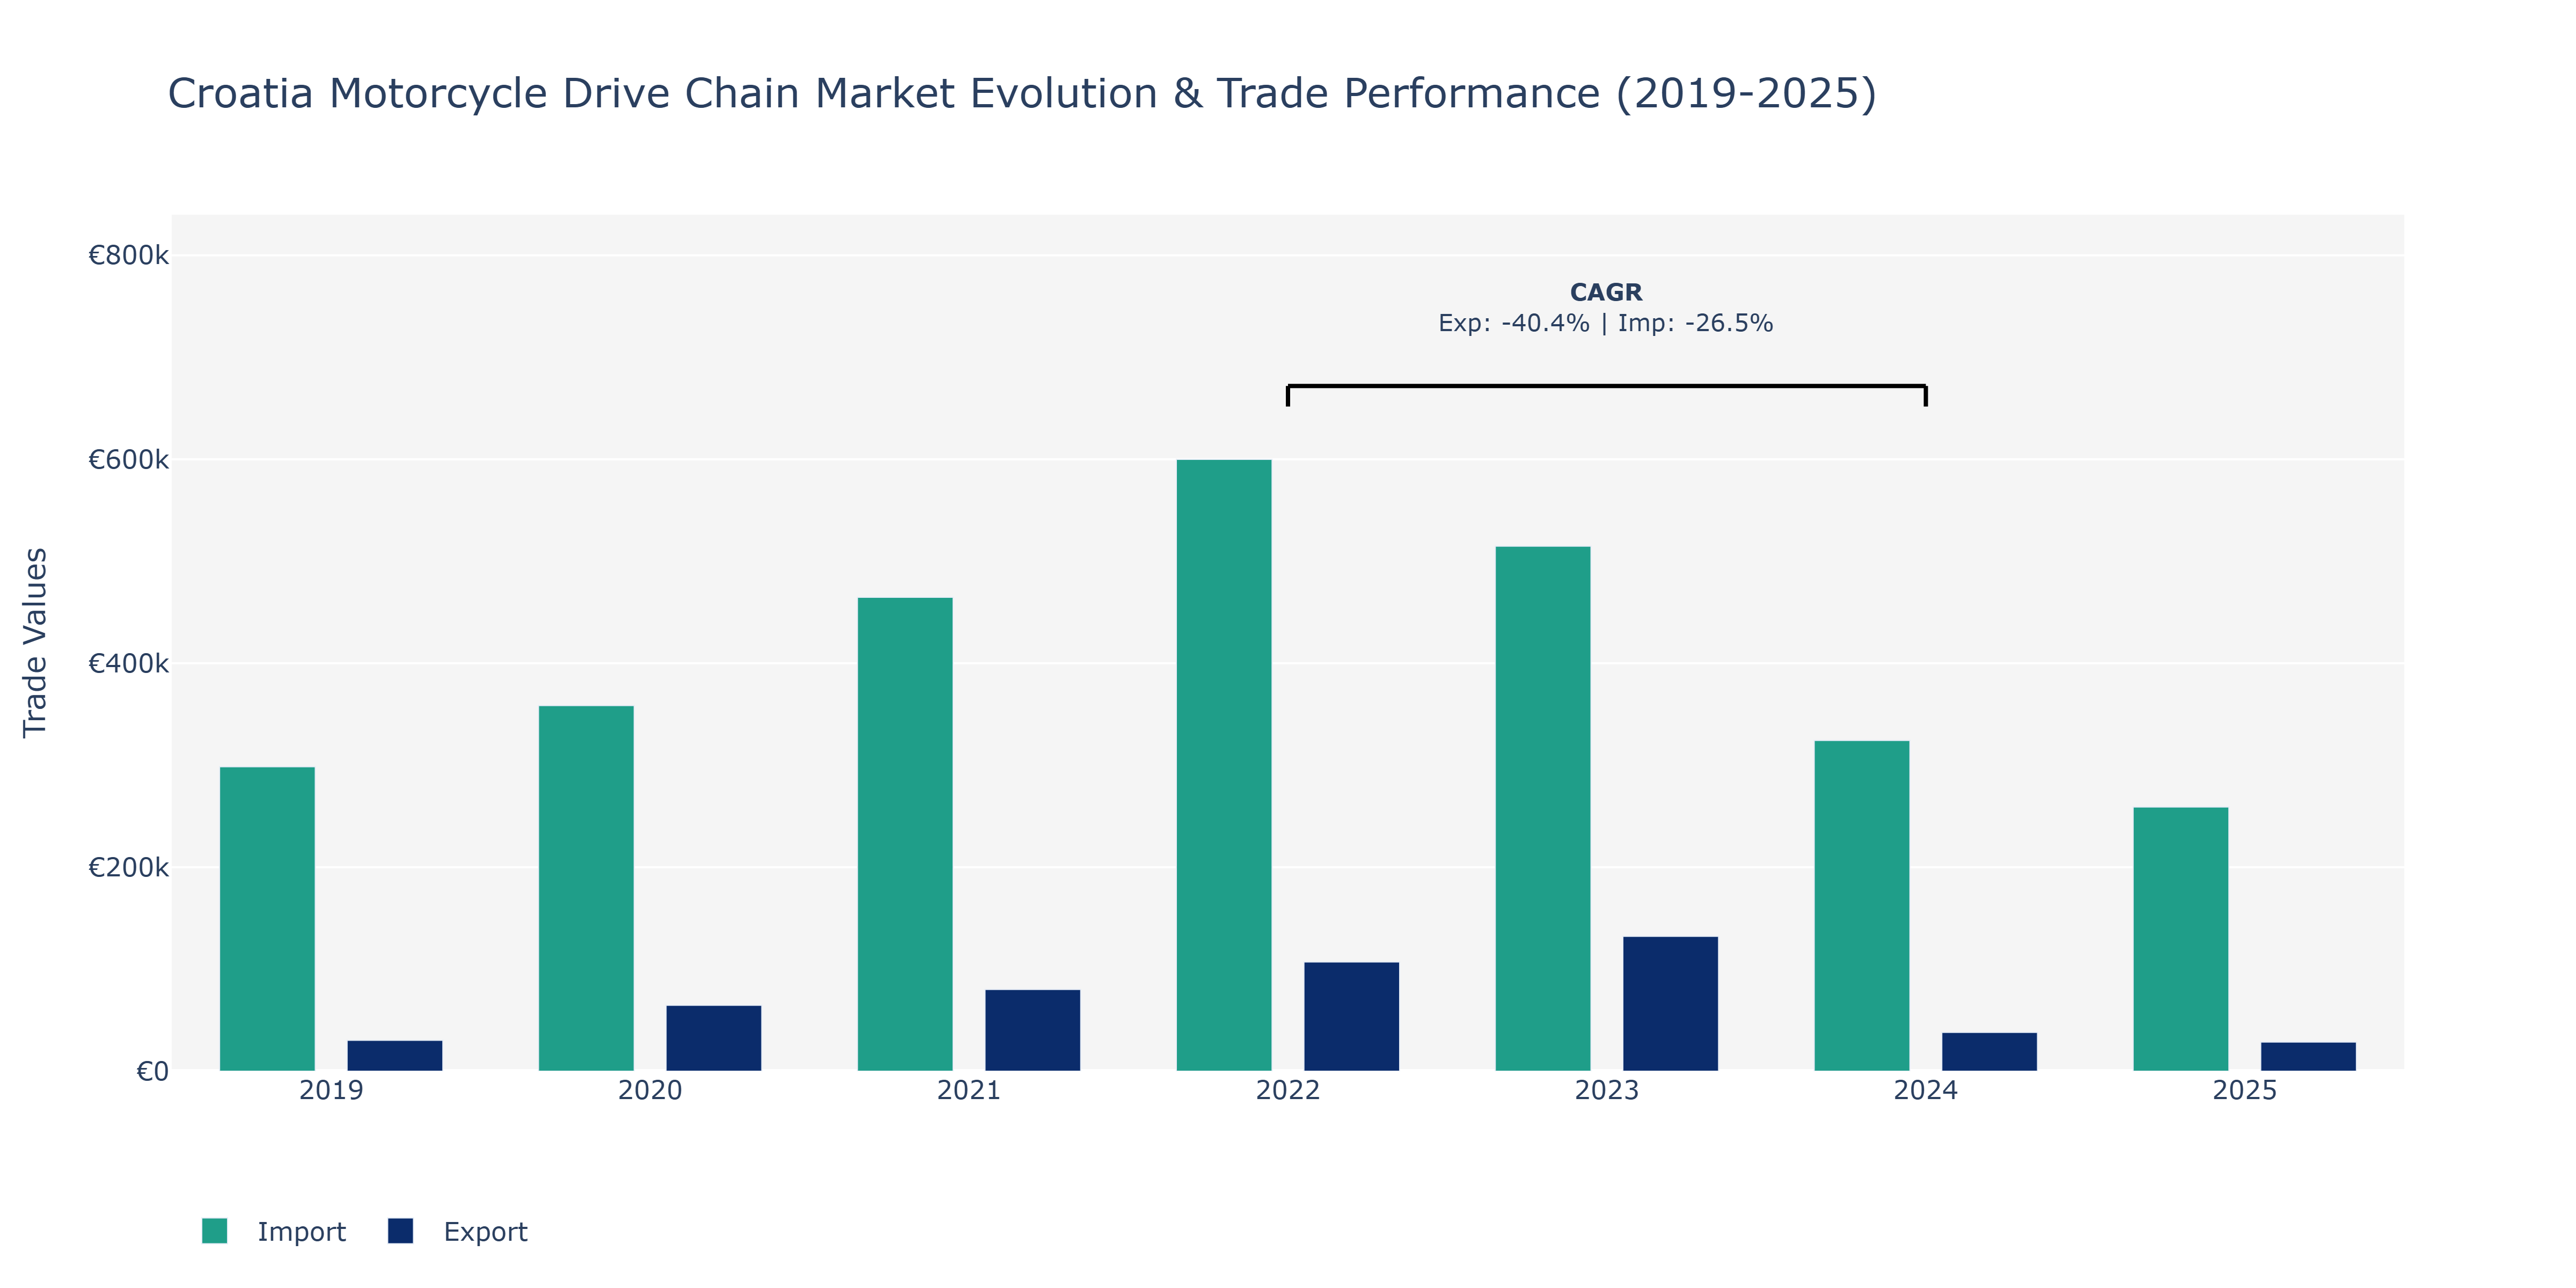
The Croatia Motorcycle Drive Chain Market experienced notable fluctuations in both Exports and Imports from 2019 to 2025. Exports showed a remarkable upward trajectory, increasing from €30.26 thousand in 2019 to a peak of €132.25 thousand in 2023 before decreasing sharply to €28.56 thousand in 2025. Conversely, Imports exhibited a more erratic pattern, rising consistently from €298.52 thousand in 2019 to a peak of €599.87 thousand in 2022, followed by a substantial decline to €259.06 thousand in 2025. These fluctuations can be attributed to various factors such as changing consumer demand, global economic conditions, and supply chain disruptions. For instance, the decrease in Exports in 2025 could be influenced by shifts in market dynamics or regulatory changes affecting international trade. The decline in Imports post-2022 might indicate adjustments in domestic production capabilities or alterations in sourcing strategies. To further stabilize the market, stakeholders could consider enhancing export promotion initiatives, diversifying import markets, and investing in supply chain resilience measures.
Key Highlights of the Report:
- Croatia Motorcycle Drive Chain Market Outlook
- Market Size of Croatia Motorcycle Drive Chain Market, 2025
- Forecast of Croatia Motorcycle Drive Chain Market, 2032
- Historical Data and Forecast of Croatia Motorcycle Drive Chain Revenues & Volume for the Period 2022 - 2032
- Croatia Motorcycle Drive Chain Market Trend Evolution
- Croatia Motorcycle Drive Chain Market Drivers and Challenges
- Croatia Motorcycle Drive Chain Price Trends
- Croatia Motorcycle Drive Chain Porter's Five Forces
- Croatia Motorcycle Drive Chain Industry Life Cycle
- Historical Data and Forecast of Croatia Motorcycle Drive Chain Market Revenues & Volume By Types for the Period 2022 - 2032
- Historical Data and Forecast of Croatia Motorcycle Drive Chain Market Revenues & Volume By Standard for the Period 2022 - 2032
- Historical Data and Forecast of Croatia Motorcycle Drive Chain Market Revenues & Volume By Cruiser for the Period 2022 - 2032
- Historical Data and Forecast of Croatia Motorcycle Drive Chain Market Revenues & Volume By Sports for the Period 2022 - 2032
- Historical Data and Forecast of Croatia Motorcycle Drive Chain Market Revenues & Volume By Off-Road for the Period 2022 - 2032
- Historical Data and Forecast of Croatia Motorcycle Drive Chain Market Revenues & Volume By Chain type for the Period 2022 - 2032
- Historical Data and Forecast of Croatia Motorcycle Drive Chain Market Revenues & Volume By Standard Rolling Chain for the Period 2022 - 2032
- Historical Data and Forecast of Croatia Motorcycle Drive Chain Market Revenues & Volume By O Ring Chain for the Period 2022 - 2032
- Historical Data and Forecast of Croatia Motorcycle Drive Chain Market Revenues & Volume By X Ring Chain for the Period 2022 - 2032
- Historical Data and Forecast of Croatia Motorcycle Drive Chain Market Revenues & Volume By Engine Capacity for the Period 2022 - 2032
- Historical Data and Forecast of Croatia Motorcycle Drive Chain Market Revenues & Volume By Up to 150 CC for the Period 2022 - 2032
- Historical Data and Forecast of Croatia Motorcycle Drive Chain Market Revenues & Volume By 151-300 CC for the Period 2022 - 2032
- Historical Data and Forecast of Croatia Motorcycle Drive Chain Market Revenues & Volume By 301-500 CC for the Period 2022 - 2032
- Historical Data and Forecast of Croatia Motorcycle Drive Chain Market Revenues & Volume By Above 500 CC for the Period 2022 - 2032
- Historical Data and Forecast of Croatia Motorcycle Drive Chain Market Revenues & Volume By Material Type for the Period 2022 - 2032
- Historical Data and Forecast of Croatia Motorcycle Drive Chain Market Revenues & Volume By Mild Steel for the Period 2022 - 2032
- Historical Data and Forecast of Croatia Motorcycle Drive Chain Market Revenues & Volume By Cast Steel for the Period 2022 - 2032
- Historical Data and Forecast of Croatia Motorcycle Drive Chain Market Revenues & Volume By Cast Iron for the Period 2022 - 2032
- Historical Data and Forecast of Croatia Motorcycle Drive Chain Market Revenues & Volume By Distribution Channel for the Period 2022 - 2032
- Historical Data and Forecast of Croatia Motorcycle Drive Chain Market Revenues & Volume By Online for the Period 2022 - 2032
- Historical Data and Forecast of Croatia Motorcycle Drive Chain Market Revenues & Volume By Offline for the Period 2022 - 2032
- Croatia Motorcycle Drive Chain Import Export Trade Statistics
- Market Opportunity Assessment By Types
- Market Opportunity Assessment By Chain type
- Market Opportunity Assessment By Engine Capacity
- Market Opportunity Assessment By Material Type
- Market Opportunity Assessment By Distribution Channel
- Croatia Motorcycle Drive Chain Top Companies Market Share
- Croatia Motorcycle Drive Chain Competitive Benchmarking By Technical and Operational Parameters
- Croatia Motorcycle Drive Chain Company Profiles
- Croatia Motorcycle Drive Chain Key Strategic Recommendations
Frequently Asked Questions About the Market Study (FAQs):
6Wresearch actively monitors the Croatia Motorcycle Drive Chain Market and publishes its comprehensive annual report, highlighting emerging trends, growth drivers, revenue analysis, and forecast outlook. Our insights help businesses to make data-backed strategic decisions with ongoing market dynamics. Our analysts track relevent industries related to the Croatia Motorcycle Drive Chain Market, allowing our clients with actionable intelligence and reliable forecasts tailored to emerging regional needs.
Yes, we provide customisation as per your requirements. To learn more, feel free to contact us on sales@6wresearch.com
1 Executive Summary |
2 Introduction |
2.1 Key Highlights of the Report |
2.2 Report Description |
2.3 Market Scope & Segmentation |
2.4 Research Methodology |
2.5 Assumptions |
3 Croatia Motorcycle Drive Chain Market Overview |
3.1 Croatia Country Macro Economic Indicators |
3.2 Croatia Motorcycle Drive Chain Market Revenues & Volume, 2022 & 2032F |
3.3 Croatia Motorcycle Drive Chain Market - Industry Life Cycle |
3.4 Croatia Motorcycle Drive Chain Market - Porter's Five Forces |
3.5 Croatia Motorcycle Drive Chain Market Revenues & Volume Share, By Types, 2022 & 2032F |
3.6 Croatia Motorcycle Drive Chain Market Revenues & Volume Share, By Chain type, 2022 & 2032F |
3.7 Croatia Motorcycle Drive Chain Market Revenues & Volume Share, By Engine Capacity, 2022 & 2032F |
3.8 Croatia Motorcycle Drive Chain Market Revenues & Volume Share, By Material Type, 2022 & 2032F |
3.9 Croatia Motorcycle Drive Chain Market Revenues & Volume Share, By Distribution Channel, 2022 & 2032F |
4 Croatia Motorcycle Drive Chain Market Dynamics |
4.1 Impact Analysis |
4.2 Market Drivers |
4.2.1 Increasing popularity of motorcycle tourism in Croatia |
4.2.2 Growth in the motorcycle industry in Croatia |
4.2.3 Rising demand for motorcycles for leisure and transportation purposes |
4.3 Market Restraints |
4.3.1 High maintenance costs associated with motorcycle drive chains |
4.3.2 Competition from alternative modes of transportation |
4.3.3 Impact of economic fluctuations on consumer spending |
5 Croatia Motorcycle Drive Chain Market Trends |
6 Croatia Motorcycle Drive Chain Market, By Types |
6.1 Croatia Motorcycle Drive Chain Market, By Types |
6.1.1 Overview and Analysis |
6.1.2 Croatia Motorcycle Drive Chain Market Revenues & Volume, By Types, 2022 - 2032F |
6.1.3 Croatia Motorcycle Drive Chain Market Revenues & Volume, By Standard, 2022 - 2032F |
6.1.4 Croatia Motorcycle Drive Chain Market Revenues & Volume, By Cruiser, 2022 - 2032F |
6.1.5 Croatia Motorcycle Drive Chain Market Revenues & Volume, By Sports, 2022 - 2032F |
6.1.6 Croatia Motorcycle Drive Chain Market Revenues & Volume, By Off-Road, 2022 - 2032F |
6.2 Croatia Motorcycle Drive Chain Market, By Chain type |
6.2.1 Overview and Analysis |
6.2.2 Croatia Motorcycle Drive Chain Market Revenues & Volume, By Standard Rolling Chain, 2022 - 2032F |
6.2.3 Croatia Motorcycle Drive Chain Market Revenues & Volume, By O Ring Chain, 2022 - 2032F |
6.2.4 Croatia Motorcycle Drive Chain Market Revenues & Volume, By X Ring Chain, 2022 - 2032F |
6.3 Croatia Motorcycle Drive Chain Market, By Engine Capacity |
6.3.1 Overview and Analysis |
6.3.2 Croatia Motorcycle Drive Chain Market Revenues & Volume, By Up to 150 CC, 2022 - 2032F |
6.3.3 Croatia Motorcycle Drive Chain Market Revenues & Volume, By 151-300 CC, 2022 - 2032F |
6.3.4 Croatia Motorcycle Drive Chain Market Revenues & Volume, By 301-500 CC, 2022 - 2032F |
6.3.5 Croatia Motorcycle Drive Chain Market Revenues & Volume, By Above 500 CC, 2022 - 2032F |
6.4 Croatia Motorcycle Drive Chain Market, By Material Type |
6.4.1 Overview and Analysis |
6.4.2 Croatia Motorcycle Drive Chain Market Revenues & Volume, By Mild Steel, 2022 - 2032F |
6.4.3 Croatia Motorcycle Drive Chain Market Revenues & Volume, By Cast Steel, 2022 - 2032F |
6.4.4 Croatia Motorcycle Drive Chain Market Revenues & Volume, By Cast Iron, 2022 - 2032F |
6.5 Croatia Motorcycle Drive Chain Market, By Distribution Channel |
6.5.1 Overview and Analysis |
6.5.2 Croatia Motorcycle Drive Chain Market Revenues & Volume, By Online, 2022 - 2032F |
6.5.3 Croatia Motorcycle Drive Chain Market Revenues & Volume, By Offline, 2022 - 2032F |
7 Croatia Motorcycle Drive Chain Market Import-Export Trade Statistics |
7.1 Croatia Motorcycle Drive Chain Market Export to Major Countries |
7.2 Croatia Motorcycle Drive Chain Market Imports from Major Countries |
8 Croatia Motorcycle Drive Chain Market Key Performance Indicators |
8.1 Average maintenance frequency of motorcycle drive chains |
8.2 Number of new motorcycle models with advanced drive chain technology introduced in the market |
8.3 Percentage of motorcycles using drive chains compared to other types of transmission systems |
9 Croatia Motorcycle Drive Chain Market - Opportunity Assessment |
9.1 Croatia Motorcycle Drive Chain Market Opportunity Assessment, By Types, 2022 & 2032F |
9.2 Croatia Motorcycle Drive Chain Market Opportunity Assessment, By Chain type, 2022 & 2032F |
9.3 Croatia Motorcycle Drive Chain Market Opportunity Assessment, By Engine Capacity, 2022 & 2032F |
9.4 Croatia Motorcycle Drive Chain Market Opportunity Assessment, By Material Type, 2022 & 2032F |
9.5 Croatia Motorcycle Drive Chain Market Opportunity Assessment, By Distribution Channel, 2022 & 2032F |
10 Croatia Motorcycle Drive Chain Market - Competitive Landscape |
10.1 Croatia Motorcycle Drive Chain Market Revenue Share, By Companies, 2025 |
10.2 Croatia Motorcycle Drive Chain Market Competitive Benchmarking, By Operating and Technical Parameters |
11 Company Profiles |
12 Recommendations |
13 Disclaimer |
Export potential assessment - trade Analytics for 2030
Export potential enables firms to identify high-growth global markets with greater confidence by combining advanced trade intelligence with a structured quantitative methodology. The framework analyzes emerging demand trends and country-level import patterns while integrating macroeconomic and trade datasets such as GDP and population forecasts, bilateral import–export flows, tariff structures, elasticity differentials between developed and developing economies, geographic distance, and import demand projections. Using weighted trade values from 2020–2024 as the base period to project country-to-country export potential for 2030, these inputs are operationalized through calculated drivers such as gravity model parameters, tariff impact factors, and projected GDP per-capita growth. Through an analysis of hidden potentials, demand hotspots, and market conditions that are most favorable to success, this method enables firms to focus on target countries, maximize returns, and global expansion with data, backed by accuracy.
By factoring in the projected importer demand gap that is currently unmet and could be potential opportunity, it identifies the potential for the Exporter (Country) among 190 countries, against the general trade analysis, which identifies the biggest importer or exporter.
To discover high-growth global markets and optimize your business strategy:
Click Here
Pricing
- Single User License$ 1,995
- Department License$ 2,400
- Site License$ 3,120
- Global License$ 3,795

Search
Thought Leadership and Analyst Meet


Our Clients
Latest Reports
- Philippines Polyhydroxybutyrate-co-Hydroxyvalerate Market (2026-2032) | Trends, Insights, Challenges, Restraints, Competition, Size, Value, Forecast, Pricing, Share, Outlook, Revenue, Investment Opportunities, Strategy, Drivers, Demand, Growth, segmentation, Analysis, Companies
- Peru Polyhydroxybutyrate-co-Hydroxyvalerate Market (2026-2032) | Growth, Demand, Challenges, Share, Trends, Analysis, Pricing, Investment Opportunities, Drivers, Value, Forecast, Competition, Size, Companies, Insights, Outlook, Restraints, segmentation, Revenue, Strategy
- Pakistan Polyhydroxybutyrate-co-Hydroxyvalerate Market (2026-2032) | Restraints, segmentation, Pricing, Forecast, Share, Strategy, Competition, Trends, Insights, Drivers, Challenges, Growth, Revenue, Outlook, Value, Investment Opportunities, Companies, Size, Analysis, Demand
- Oman Polyhydroxybutyrate-co-Hydroxyvalerate Market (2026-2032) | Drivers, segmentation, Insights, Competition, Pricing, Outlook, Size, Revenue, Challenges, Forecast, Analysis, Growth, Value, Share, Trends, Investment Opportunities, Strategy, Restraints, Companies, Demand
- Nigeria Polyhydroxybutyrate-co-Hydroxyvalerate Market (2026-2032) | Value, Investment Opportunities, Analysis, Revenue, Restraints, Pricing, Outlook, Competition, Demand, Growth, Forecast, Companies, Trends, Challenges, segmentation, Drivers, Insights, Share, Size, Strategy
- Nepal Polyhydroxybutyrate-co-Hydroxyvalerate Market (2026-2032) | Insights, Analysis, Drivers, Share, Revenue, Demand, segmentation, Investment Opportunities, Competition, Forecast, Growth, Pricing, Companies, Strategy, Trends, Restraints, Challenges, Outlook, Size, Value
- Myanmar Polyhydroxybutyrate-co-Hydroxyvalerate Market (2026-2032) | Outlook, Revenue, Strategy, Restraints, Drivers, segmentation, Share, Forecast, Competition, Insights, Growth, Pricing, Size, Demand, Value, Companies, Trends, Challenges, Investment Opportunities, Analysis
- Morocco Polyhydroxybutyrate-co-Hydroxyvalerate Market (2026-2032) | Outlook, Investment Opportunities, Restraints, Strategy, Forecast, Challenges, Drivers, Growth, Companies, segmentation, Trends, Size, Competition, Revenue, Demand, Insights, Share, Analysis, Value, Pricing
- Mexico Polyhydroxybutyrate-co-Hydroxyvalerate Market (2026-2032) | Size, Drivers, Outlook, Share, Strategy, Growth, Pricing, Challenges, Companies, Demand, Value, Investment Opportunities, Restraints, Trends, Forecast, segmentation, Analysis, Insights, Competition, Revenue
- Malaysia Polyhydroxybutyrate-co-Hydroxyvalerate Market (2026-2032) | Share, segmentation, Size, Companies, Analysis, Insights, Forecast, Value, Revenue, Drivers, Restraints, Challenges, Investment Opportunities, Trends, Competition, Strategy, Demand, Growth, Outlook, Pricing
Industry Events and Analyst Meet

HIMTEX 2026

India Refining Summit 2026

India EV Show 2026

EV tech India Expo 2026

Auto Tech Asia 2026
Whitepaper
- Middle East & Africa Commercial Security Market Click here to view more.
- Middle East & Africa Fire Safety Systems & Equipment Market Click here to view more.
- GCC Drone Market Click here to view more.
- Middle East Lighting Fixture Market Click here to view more.
- GCC Physical & Perimeter Security Market Click here to view more.
6WResearch In News
- Doha a strategic location for EV manufacturing hub: IPA Qatar
- Demand for luxury TVs surging in the GCC, says Samsung
- Empowering Growth: The Thriving Journey of Bangladesh’s Cable Industry
- Demand for luxury TVs surging in the GCC, says Samsung
- Video call with a traditional healer? Once unthinkable, it’s now common in South Africa
- Intelligent Buildings To Smooth GCC’s Path To Net Zero