Croatia NDT Equipment Market (2026-2032) | Restraints, Analysis, Pricing Analysis, Revenue, Growth, Drivers, Strategic Insights, Trends, Forecast, Size, Value, Challenges, Segmentation, Opportunities, Investment Trends, Segments, Industry, Strategy, Consumer Insights, Competition, Share, Companies, Competitive, Supply, Demand, Outlook
Market Forecast By Equipment Type (Ultrasonic Testing Equipment, Radiographic Testing Equipment, Magnetic Particle Testing Equipment, Eddy Current Testing Equipment, Liquid Penetrant Testing Equipment), By Technology (Ultrasonic Waves, X-Rays, Magnetic Fields, Electromagnetic Fields, Dye Penetrants), By Application (Flaw Detection, Weld Inspection, Surface Cracks, Conductivity Testing, Leak Detection), By Material Type (Metals, Plastics, Composites, Ceramics, Glass), By Industry (Construction, Aerospace, Automotive, Oil & Gas, Manufacturing) And Competitive Landscape
| Product Code: ETC12991445 | Publication Date: Apr 2025 | Updated Date: Apr 2026 | Product Type: Market Research Report | |
| Publisher: 6Wresearch | No. of Pages: 65 | No. of Figures: 34 | No. of Tables: 19 | |
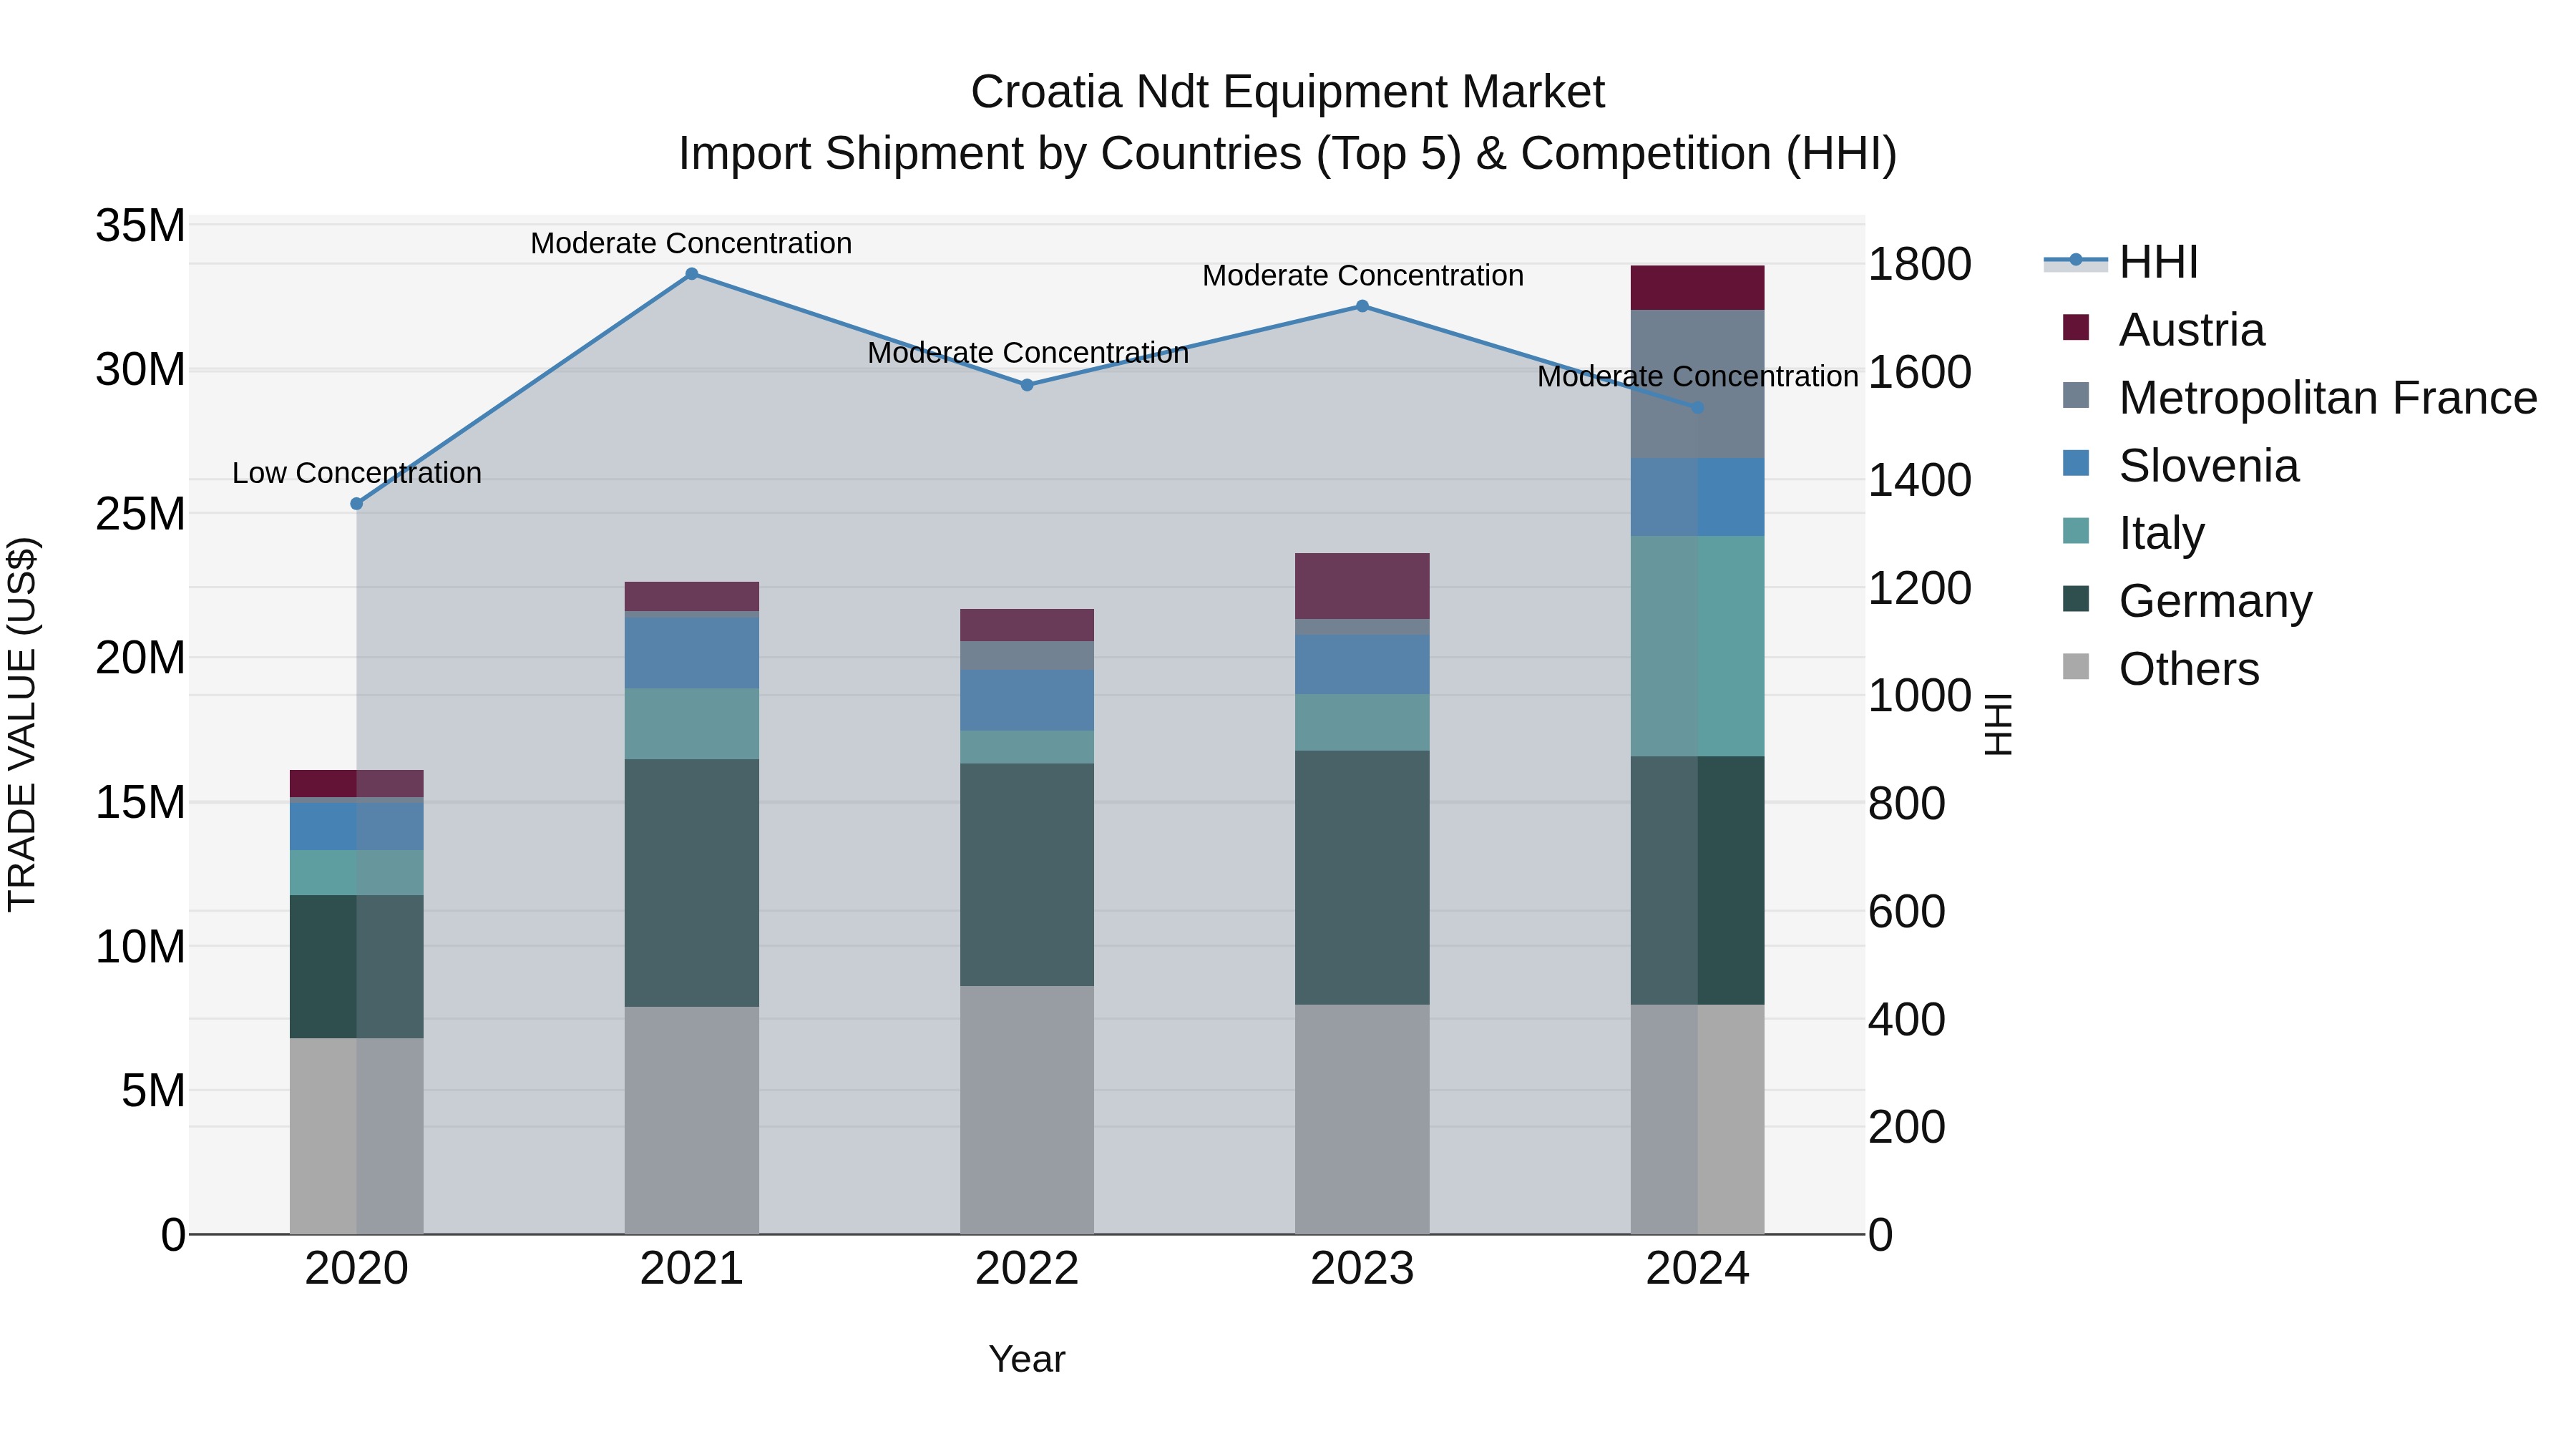
Croatia Ndt Equipment Market Top 5 Importing Countries and Market Competition (HHI) Analysis
Croatia NDT equipment import shipments in 2024 continued to be dominated by top exporting countries such as Germany, Italy, Metropolitan France, Slovenia, and Austria. The market displayed moderate concentration with a stable HHI in 2024. The impressive compound annual growth rate (CAGR) of 20.17% from 2020 to 2024 indicates a robust upward trend in the market. Furthermore, the notable growth rate of 42.27% from 2023 to 2024 highlights the accelerating pace of import shipments in the NDT equipment sector in Croatia.
Key Highlights of the Report:
- Croatia NDT Equipment Market Outlook
- Market Size of Croatia NDT Equipment Market, 2025
- Forecast of Croatia NDT Equipment Market, 2032
- Historical Data and Forecast of Croatia NDT Equipment Revenues & Volume for the Period 2022 - 2032F
- Croatia NDT Equipment Market Trend Evolution
- Croatia NDT Equipment Market Drivers and Challenges
- Croatia NDT Equipment Price Trends
- Croatia NDT Equipment Porter's Five Forces
- Croatia NDT Equipment Industry Life Cycle
- Historical Data and Forecast of Croatia NDT Equipment Market Revenues & Volume By Equipment Type for the Period 2022 - 2032F
- Historical Data and Forecast of Croatia NDT Equipment Market Revenues & Volume By Ultrasonic Testing Equipment for the Period 2022 - 2032F
- Historical Data and Forecast of Croatia NDT Equipment Market Revenues & Volume By Radiographic Testing Equipment for the Period 2022 - 2032F
- Historical Data and Forecast of Croatia NDT Equipment Market Revenues & Volume By Magnetic Particle Testing Equipment for the Period 2022 - 2032F
- Historical Data and Forecast of Croatia NDT Equipment Market Revenues & Volume By Eddy Current Testing Equipment for the Period 2022 - 2032F
- Historical Data and Forecast of Croatia NDT Equipment Market Revenues & Volume By Liquid Penetrant Testing Equipment for the Period 2022 - 2032F
- Historical Data and Forecast of Croatia NDT Equipment Market Revenues & Volume By Technology for the Period 2022 - 2032F
- Historical Data and Forecast of Croatia NDT Equipment Market Revenues & Volume By Ultrasonic Waves for the Period 2022 - 2032F
- Historical Data and Forecast of Croatia NDT Equipment Market Revenues & Volume By X-Rays for the Period 2022 - 2032F
- Historical Data and Forecast of Croatia NDT Equipment Market Revenues & Volume By Magnetic Fields for the Period 2022 - 2032F
- Historical Data and Forecast of Croatia NDT Equipment Market Revenues & Volume By Electromagnetic Fields for the Period 2022 - 2032F
- Historical Data and Forecast of Croatia NDT Equipment Market Revenues & Volume By Dye Penetrants for the Period 2022 - 2032F
- Historical Data and Forecast of Croatia NDT Equipment Market Revenues & Volume By Application for the Period 2022 - 2032F
- Historical Data and Forecast of Croatia NDT Equipment Market Revenues & Volume By Flaw Detection for the Period 2022 - 2032F
- Historical Data and Forecast of Croatia NDT Equipment Market Revenues & Volume By Weld Inspection for the Period 2022 - 2032F
- Historical Data and Forecast of Croatia NDT Equipment Market Revenues & Volume By Surface Cracks for the Period 2022 - 2032F
- Historical Data and Forecast of Croatia NDT Equipment Market Revenues & Volume By Conductivity Testing for the Period 2022 - 2032F
- Historical Data and Forecast of Croatia NDT Equipment Market Revenues & Volume By Leak Detection for the Period 2022 - 2032F
- Historical Data and Forecast of Croatia NDT Equipment Market Revenues & Volume By Material Type for the Period 2022 - 2032F
- Historical Data and Forecast of Croatia NDT Equipment Market Revenues & Volume By Metals for the Period 2022 - 2032F
- Historical Data and Forecast of Croatia NDT Equipment Market Revenues & Volume By Plastics for the Period 2022 - 2032F
- Historical Data and Forecast of Croatia NDT Equipment Market Revenues & Volume By Composites for the Period 2022 - 2032F
- Historical Data and Forecast of Croatia NDT Equipment Market Revenues & Volume By Ceramics for the Period 2022 - 2032F
- Historical Data and Forecast of Croatia NDT Equipment Market Revenues & Volume By Glass for the Period 2022 - 2032F
- Historical Data and Forecast of Croatia NDT Equipment Market Revenues & Volume By Industry for the Period 2022 - 2032F
- Historical Data and Forecast of Croatia NDT Equipment Market Revenues & Volume By Construction for the Period 2022 - 2032F
- Historical Data and Forecast of Croatia NDT Equipment Market Revenues & Volume By Aerospace for the Period 2022 - 2032F
- Historical Data and Forecast of Croatia NDT Equipment Market Revenues & Volume By Automotive for the Period 2022 - 2032F
- Historical Data and Forecast of Croatia NDT Equipment Market Revenues & Volume By Oil & Gas for the Period 2022 - 2032F
- Historical Data and Forecast of Croatia NDT Equipment Market Revenues & Volume By Manufacturing for the Period 2022 - 2032F
- Croatia NDT Equipment Import Export Trade Statistics
- Market Opportunity Assessment By Equipment Type
- Market Opportunity Assessment By Technology
- Market Opportunity Assessment By Application
- Market Opportunity Assessment By Material Type
- Market Opportunity Assessment By Industry
- Croatia NDT Equipment Top Companies Market Share
- Croatia NDT Equipment Competitive Benchmarking By Technical and Operational Parameters
- Croatia NDT Equipment Company Profiles
- Croatia NDT Equipment Key Strategic Recommendations
Frequently Asked Questions About the Market Study (FAQs):
6Wresearch actively monitors the Croatia NDT Equipment Market and publishes its comprehensive annual report, highlighting emerging trends, growth drivers, revenue analysis, and forecast outlook. Our insights help businesses to make data-backed strategic decisions with ongoing market dynamics. Our analysts track relevent industries related to the Croatia NDT Equipment Market, allowing our clients with actionable intelligence and reliable forecasts tailored to emerging regional needs.
Yes, we provide customisation as per your requirements. To learn more, feel free to contact us on sales@6wresearch.com
1 Executive Summary |
2 Introduction |
2.1 Key Highlights of the Report |
2.2 Report Description |
2.3 Market Scope & Segmentation |
2.4 Research Methodology |
2.5 Assumptions |
3 Croatia NDT Equipment Market Overview |
3.1 Croatia Country Macro Economic Indicators |
3.2 Croatia NDT Equipment Market Revenues & Volume, 2022 & 2032F |
3.3 Croatia NDT Equipment Market - Industry Life Cycle |
3.4 Croatia NDT Equipment Market - Porter's Five Forces |
3.5 Croatia NDT Equipment Market Revenues & Volume Share, By Equipment Type, 2022 & 2032F |
3.6 Croatia NDT Equipment Market Revenues & Volume Share, By Technology, 2022 & 2032F |
3.7 Croatia NDT Equipment Market Revenues & Volume Share, By Application, 2022 & 2032F |
3.8 Croatia NDT Equipment Market Revenues & Volume Share, By Material Type, 2022 & 2032F |
3.9 Croatia NDT Equipment Market Revenues & Volume Share, By Industry, 2022 & 2032F |
4 Croatia NDT Equipment Market Dynamics |
4.1 Impact Analysis |
4.2 Market Drivers |
4.2.1 Increasing demand for quality assurance and control in various industries such as manufacturing, construction, and oil gas. |
4.2.2 Rising awareness about the importance of non-destructive testing (NDT) equipment in ensuring safety and reliability of infrastructure and assets. |
4.2.3 Government regulations mandating the use of NDT equipment in critical sectors to ensure compliance and quality standards. |
4.3 Market Restraints |
4.3.1 High initial investment costs associated with purchasing NDT equipment and training personnel to operate them. |
4.3.2 Lack of skilled professionals proficient in handling advanced NDT equipment and interpreting test results accurately. |
4.3.3 Economic fluctuations impacting capital expenditure budgets of industries, leading to delays or cancellations in NDT equipment purchases. |
5 Croatia NDT Equipment Market Trends |
6 Croatia NDT Equipment Market, By Types |
6.1 Croatia NDT Equipment Market, By Equipment Type |
6.1.1 Overview and Analysis |
6.1.2 Croatia NDT Equipment Market Revenues & Volume, By Equipment Type, 2022 - 2032F |
6.1.3 Croatia NDT Equipment Market Revenues & Volume, By Ultrasonic Testing Equipment, 2022 - 2032F |
6.1.4 Croatia NDT Equipment Market Revenues & Volume, By Radiographic Testing Equipment, 2022 - 2032F |
6.1.5 Croatia NDT Equipment Market Revenues & Volume, By Magnetic Particle Testing Equipment, 2022 - 2032F |
6.1.6 Croatia NDT Equipment Market Revenues & Volume, By Eddy Current Testing Equipment, 2022 - 2032F |
6.1.7 Croatia NDT Equipment Market Revenues & Volume, By Liquid Penetrant Testing Equipment, 2022 - 2032F |
6.2 Croatia NDT Equipment Market, By Technology |
6.2.1 Overview and Analysis |
6.2.2 Croatia NDT Equipment Market Revenues & Volume, By Ultrasonic Waves, 2022 - 2032F |
6.2.3 Croatia NDT Equipment Market Revenues & Volume, By X-Rays, 2022 - 2032F |
6.2.4 Croatia NDT Equipment Market Revenues & Volume, By Magnetic Fields, 2022 - 2032F |
6.2.5 Croatia NDT Equipment Market Revenues & Volume, By Electromagnetic Fields, 2022 - 2032F |
6.2.6 Croatia NDT Equipment Market Revenues & Volume, By Dye Penetrants, 2022 - 2032F |
6.3 Croatia NDT Equipment Market, By Application |
6.3.1 Overview and Analysis |
6.3.2 Croatia NDT Equipment Market Revenues & Volume, By Flaw Detection, 2022 - 2032F |
6.3.3 Croatia NDT Equipment Market Revenues & Volume, By Weld Inspection, 2022 - 2032F |
6.3.4 Croatia NDT Equipment Market Revenues & Volume, By Surface Cracks, 2022 - 2032F |
6.3.5 Croatia NDT Equipment Market Revenues & Volume, By Conductivity Testing, 2022 - 2032F |
6.3.6 Croatia NDT Equipment Market Revenues & Volume, By Leak Detection, 2022 - 2032F |
6.4 Croatia NDT Equipment Market, By Material Type |
6.4.1 Overview and Analysis |
6.4.2 Croatia NDT Equipment Market Revenues & Volume, By Metals, 2022 - 2032F |
6.4.3 Croatia NDT Equipment Market Revenues & Volume, By Plastics, 2022 - 2032F |
6.4.4 Croatia NDT Equipment Market Revenues & Volume, By Composites, 2022 - 2032F |
6.4.5 Croatia NDT Equipment Market Revenues & Volume, By Ceramics, 2022 - 2032F |
6.4.6 Croatia NDT Equipment Market Revenues & Volume, By Glass, 2022 - 2032F |
6.5 Croatia NDT Equipment Market, By Industry |
6.5.1 Overview and Analysis |
6.5.2 Croatia NDT Equipment Market Revenues & Volume, By Construction, 2022 - 2032F |
6.5.3 Croatia NDT Equipment Market Revenues & Volume, By Aerospace, 2022 - 2032F |
6.5.4 Croatia NDT Equipment Market Revenues & Volume, By Automotive, 2022 - 2032F |
6.5.5 Croatia NDT Equipment Market Revenues & Volume, By Oil & Gas, 2022 - 2032F |
6.5.6 Croatia NDT Equipment Market Revenues & Volume, By Manufacturing, 2022 - 2032F |
7 Croatia NDT Equipment Market Import-Export Trade Statistics |
7.1 Croatia NDT Equipment Market Export to Major Countries |
7.2 Croatia NDT Equipment Market Imports from Major Countries |
8 Croatia NDT Equipment Market Key Performance Indicators |
8.1 Percentage increase in the adoption of advanced NDT technologies by key industries in Croatia. |
8.2 Number of NDT training programs conducted and professionals certified annually. |
8.3 Rate of regulatory compliance by industries utilizing NDT equipment for quality control and safety purposes. |
9 Croatia NDT Equipment Market - Opportunity Assessment |
9.1 Croatia NDT Equipment Market Opportunity Assessment, By Equipment Type, 2022 & 2032F |
9.2 Croatia NDT Equipment Market Opportunity Assessment, By Technology, 2022 & 2032F |
9.3 Croatia NDT Equipment Market Opportunity Assessment, By Application, 2022 & 2032F |
9.4 Croatia NDT Equipment Market Opportunity Assessment, By Material Type, 2022 & 2032F |
9.5 Croatia NDT Equipment Market Opportunity Assessment, By Industry, 2022 & 2032F |
10 Croatia NDT Equipment Market - Competitive Landscape |
10.1 Croatia NDT Equipment Market Revenue Share, By Companies, 2025 |
10.2 Croatia NDT Equipment Market Competitive Benchmarking, By Operating and Technical Parameters |
11 Company Profiles |
12 Recommendations |
13 Disclaimer |
Global Go To Market Strategy - 2030
Export potential enables firms to identify high-growth global markets with greater confidence by combining advanced trade intelligence with a structured quantitative methodology. The framework analyzes emerging demand trends and country-level import patterns while integrating macroeconomic and trade datasets such as GDP and population forecasts, bilateral import–export flows, tariff structures, elasticity differentials between developed and developing economies, geographic distance, and import demand projections. Using weighted trade values from 2020–2024 as the base period to project country-to-country export potential for 2030, these inputs are operationalized through calculated drivers such as gravity model parameters, tariff impact factors, and projected GDP per-capita growth. Through an analysis of hidden potentials, demand hotspots, and market conditions that are most favorable to success, this method enables firms to focus on target countries, maximize returns, and global expansion with data, backed by accuracy.
By factoring in the projected importer demand gap that is currently unmet and could be potential opportunity, it identifies the potential for the Exporter (Country) among 190 countries, against the general trade analysis, which identifies the biggest importer or exporter.
To discover high-growth global markets and optimize your business strategy:
Click Here
Pricing
- Single User License$ 1,995
- Department License$ 2,400
- Site License$ 3,120
- Global License$ 3,795

Leadership Perspectives from Industry Events
Search
Thought Leadership and Analyst Meet


Our Clients
6WResearch In News
- Doha a strategic location for EV manufacturing hub: IPA Qatar
- Demand for luxury TVs surging in the GCC, says Samsung
- Empowering Growth: The Thriving Journey of Bangladesh’s Cable Industry
- Demand for luxury TVs surging in the GCC, says Samsung
- Video call with a traditional healer? Once unthinkable, it’s now common in South Africa
- Intelligent Buildings To Smooth GCC’s Path To Net Zero
Latest Reports
- Taiwan Airport Wireless Infrastructure Market (2026-2032)
- Vietnam Airport Wireless Infrastructure Market (2026-2032)
- Thailand Airport Wireless Infrastructure Market (2026-2032)
- South Korea Airport Wireless Infrastructure Market (2026-2032)
- Romania Airport Wireless Infrastructure Market (2026-2032)
- Qatar Airport Wireless Infrastructure Market (2026-2032)
- Philippines Airport Wireless Infrastructure Market (2026-2032)
- Japan Airport Wireless Infrastructure Market (2026-2032)
- Taiwan Airport Winter Services Market (2026-2032)
- Vietnam Airport Winter Services Market (2026-2032)
Industry Events and Analyst Meet

HIMTEX 2026

India Refining Summit 2026

India EV Show 2026

EV tech India Expo 2026

Auto Tech Asia 2026
Whitepaper
- Middle East & Africa Commercial Security Market Click here to view more.
- Middle East & Africa Fire Safety Systems & Equipment Market Click here to view more.
- GCC Drone Market Click here to view more.
- Middle East Lighting Fixture Market Click here to view more.
- GCC Physical & Perimeter Security Market Click here to view more.