Croatia Neutral Ramming Mass Market (2025-2031) | Size & Revenue, Forecast, Outlook, Companies, Trends, Analysis, Share, Segmentation, Growth, Industry, Competitive Landscape, Value
Market Forecast By Type (High Alumina Ramming Mass, Monolithic Ramming Mass, Spinel Ramming Mass, Others), By Silica Content (Up to 80%, >80% to 85%, >85%), By Application (Induction Furnaces, Electric Arc Furnaces (EAF), Crucibles, Cupola Furnaces, Others), By End-use (Metallurgy, Glass, Chemical, Others) And Competitive Landscape
| Product Code: ETC6856708 | Publication Date: Sep 2024 | Updated Date: Apr 2026 | Product Type: Market Research Report | |
| Publisher: 6Wresearch | Author: Dhaval Chaurasia | No. of Pages: 75 | No. of Figures: 35 | No. of Tables: 20 |
Croatia Neutral Ramming Mass Market Size (2020-2030)
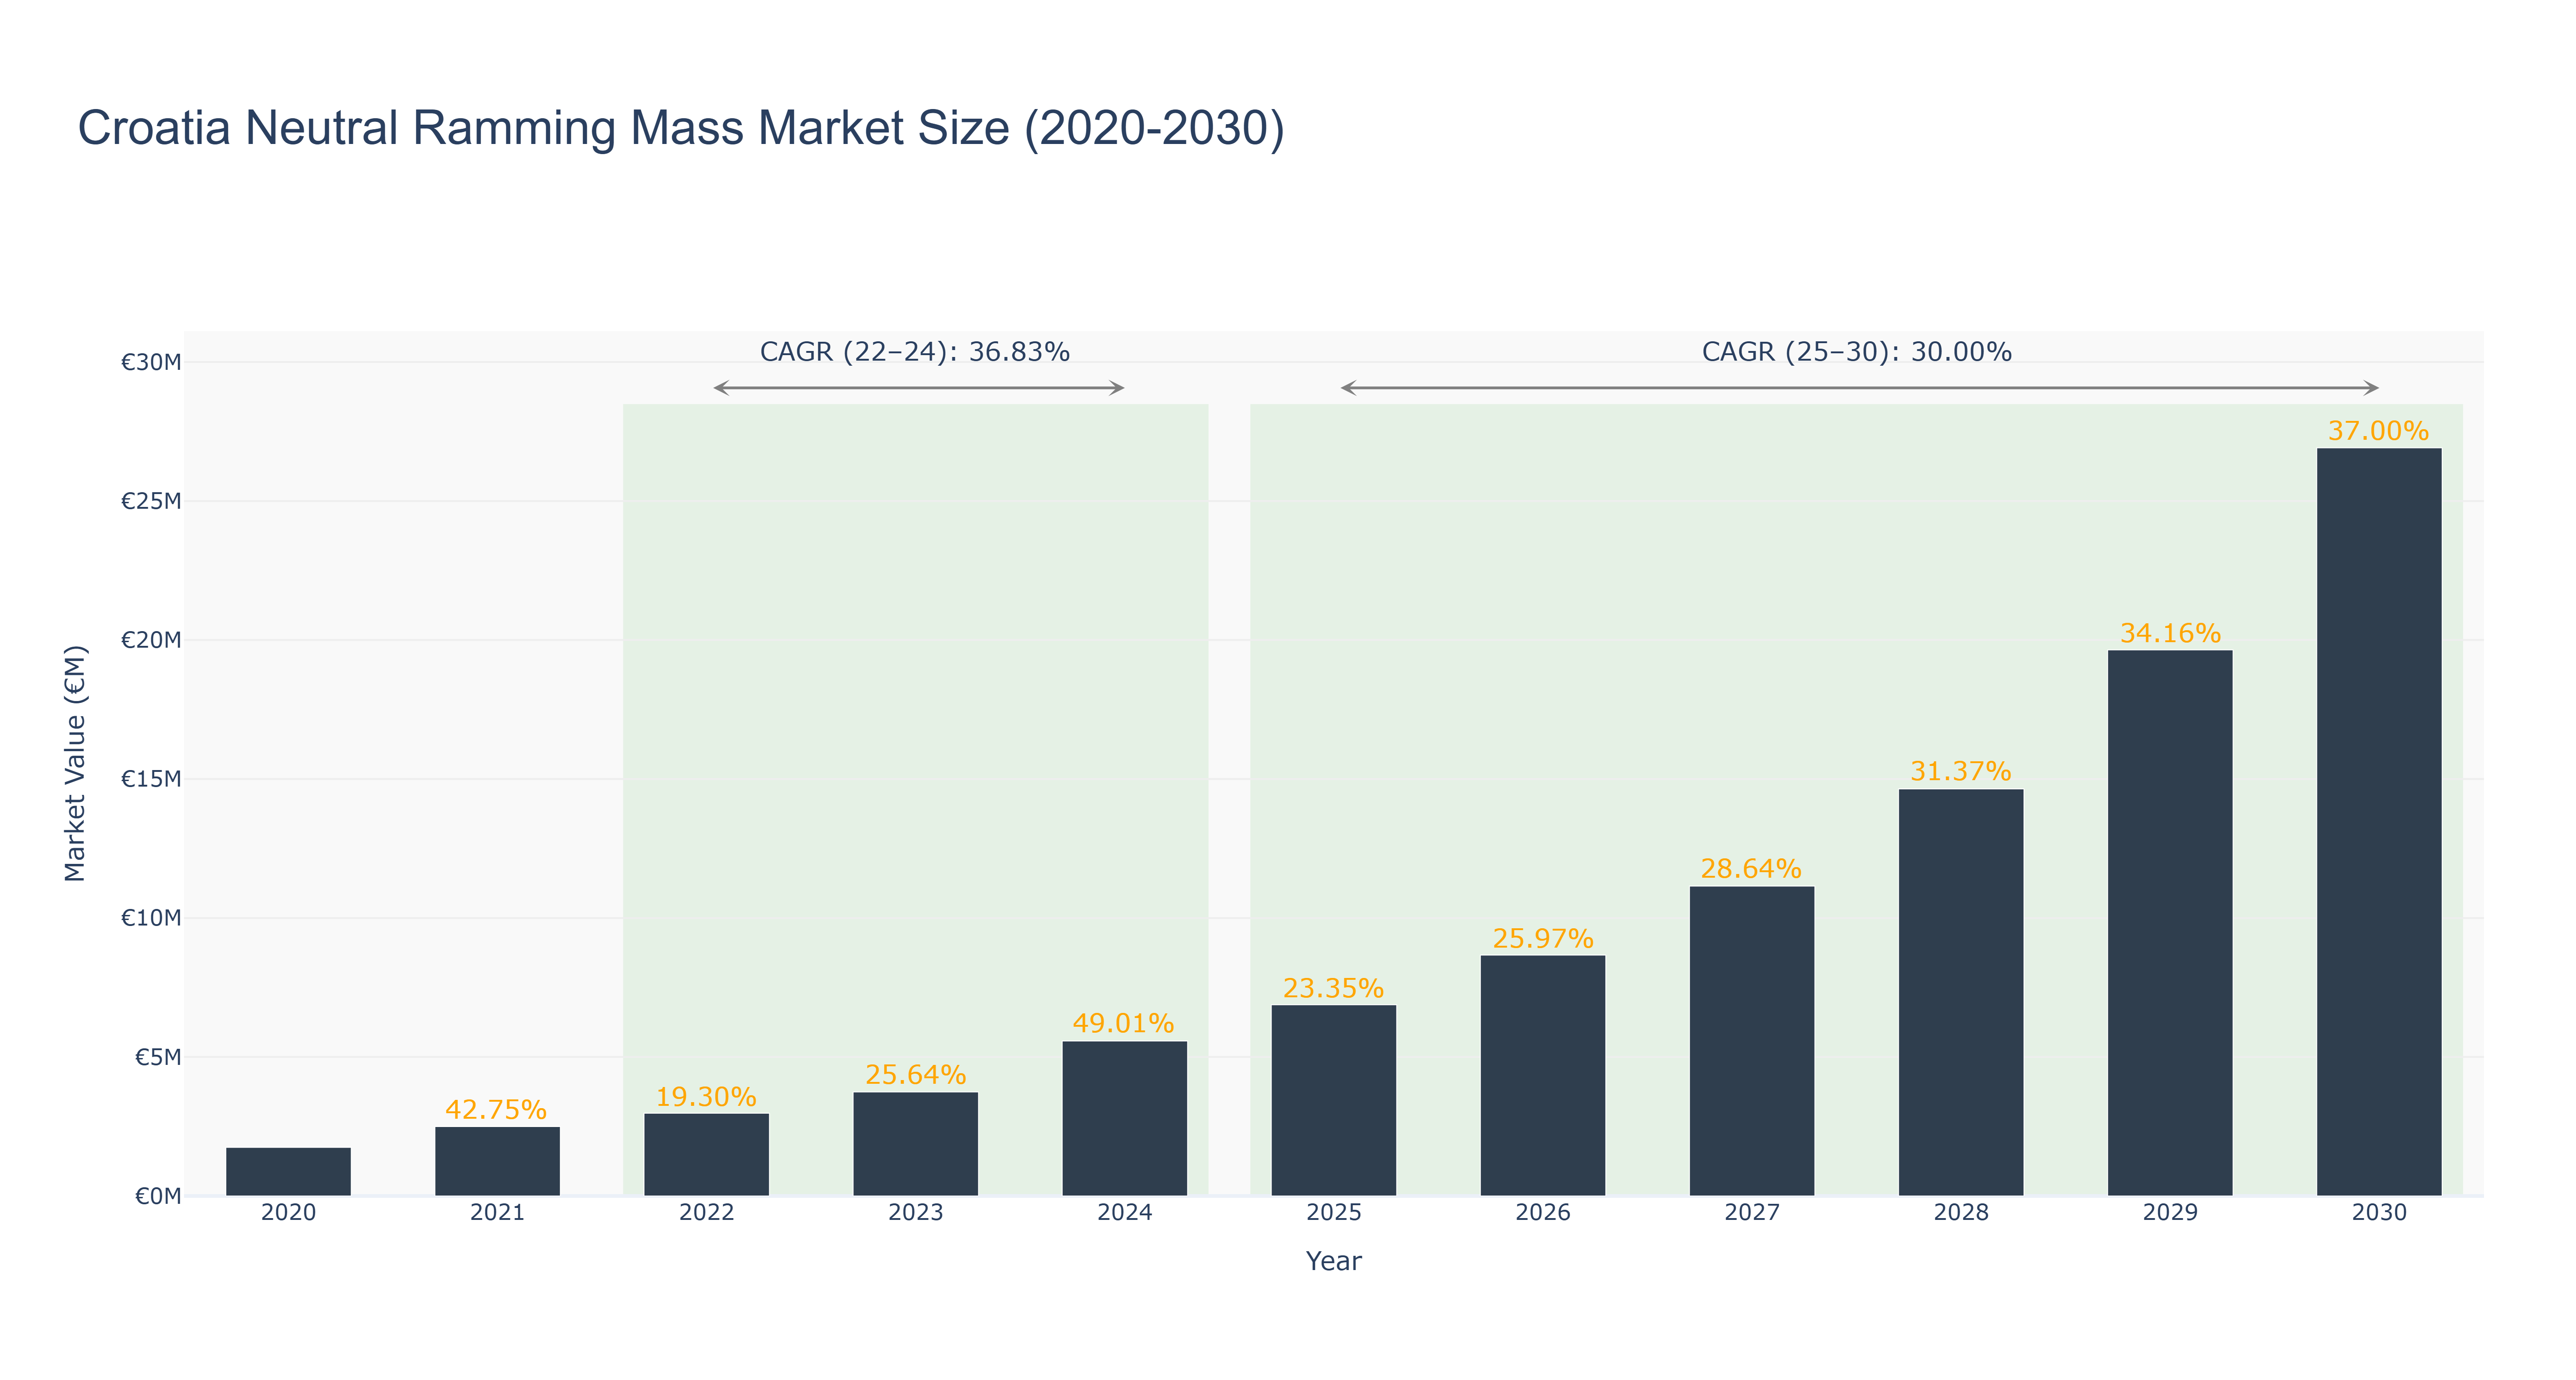
The Croatia Neutral Ramming Mass Market exhibited significant growth from €2.98 million in 2022 to €5.58 million in 2024, reflecting an impressive compound annual growth rate (CAGR) of 36.83% during this actual period. The market peaks in 2024, driven primarily by increasing demand in the metal casting and foundry sectors, alongside advancements in refractory technologies. Transitioning to the forecasted period from 2025 to 2030, the market is expected to continue this upward trajectory, reaching €26.91 million by 2030, with a projected CAGR of 30.00%. This growth will likely be bolstered by ongoing investments in infrastructure and enhanced manufacturing capabilities in the region, as well as rising environmental regulations that favor high-performance materials. Overall, the Croatia Neutral Ramming Mass Market is poised for robust expansion, supported by both domestic and international market dynamics.
Croatia Neutral Ramming Mass Market: Production & Trade Performance (2019-2025)
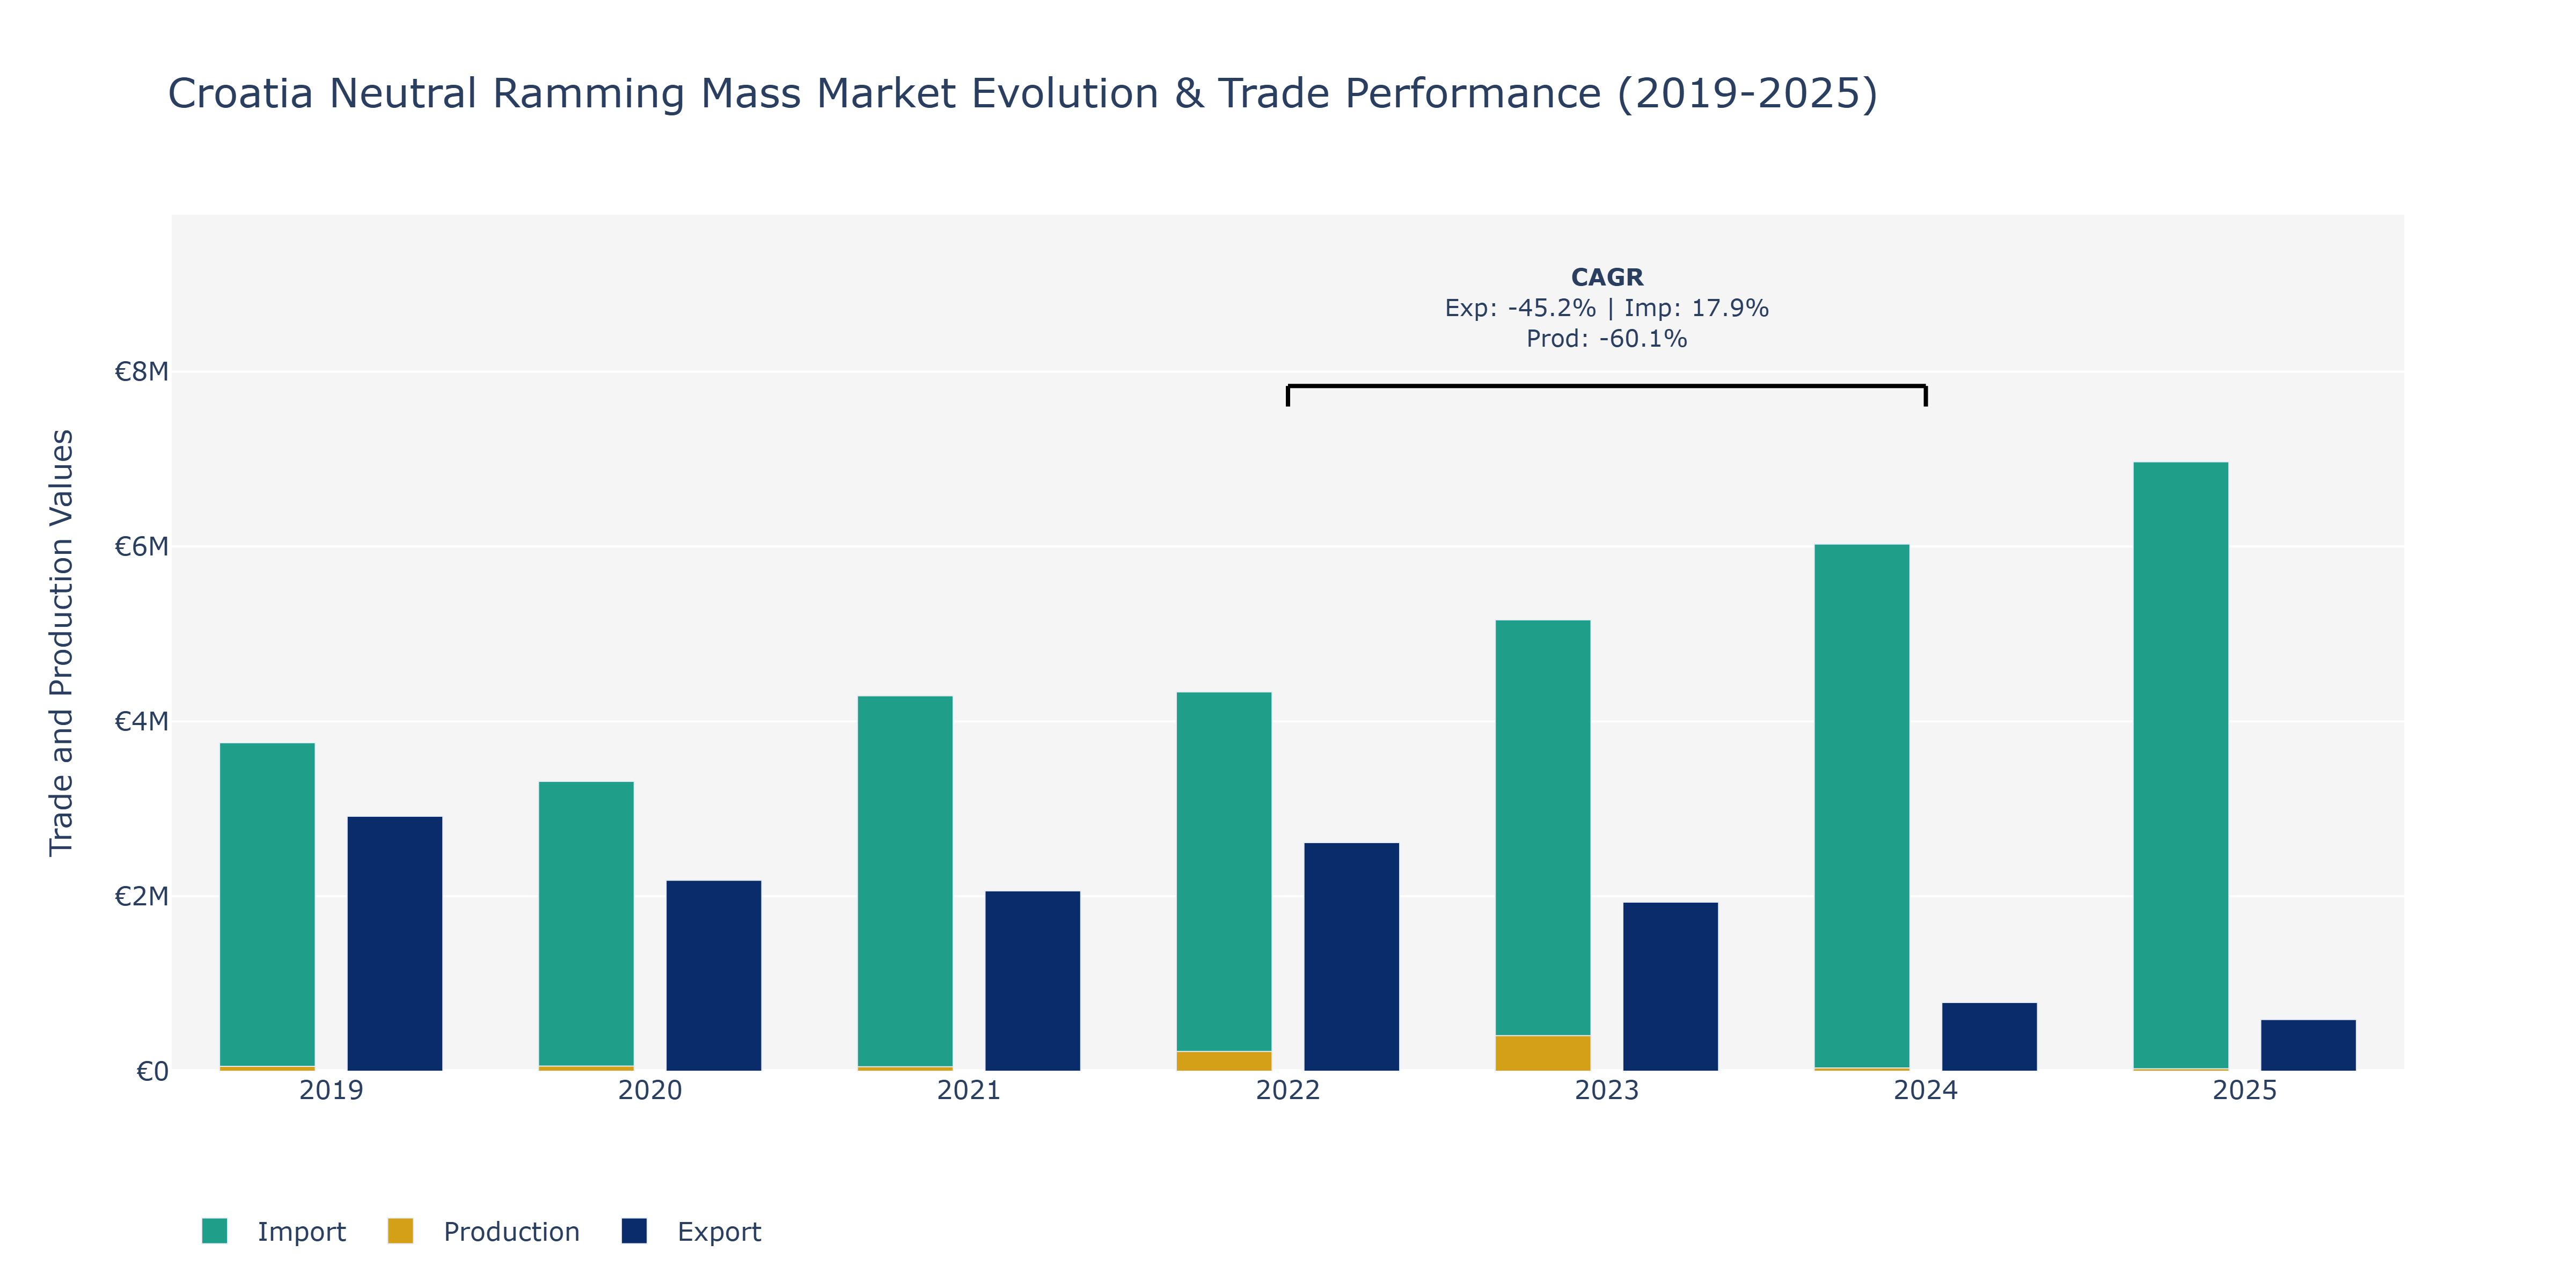
In the Croatia Neutral Ramming Mass Market, exports exhibited a fluctuating trend from 2019 to 2025, reaching a peak in 2019 at €2.92 million and decreasing significantly in 2024 to €785.15 thousand. This downward trend could be attributed to changing global demand patterns, competition from other suppliers, and economic uncertainties impacting trade flows. Imports, on the other hand, showed a steady increase from €3.76 million in 2019 to €6.97 million in 2025, indicating a growing reliance on foreign sources possibly due to domestic production constraints or quality considerations. Production levels experienced substantial variation, hitting a peak in 2022 at €226 million and dropping to €27 million in 2025. This sharp decline could be influenced by technological changes, efficiency improvements, or shifts in raw material costs affecting local manufacturing capabilities. To sustain competitiveness, Croatia may need to focus on enhancing domestic production efficiencies, diversifying export markets, and ensuring import quality standards align with industry requirements.
Key Highlights of the Report:
- Croatia Neutral Ramming Mass Market Outlook
- Market Size of Croatia Neutral Ramming Mass Market, 2024
- Forecast of Croatia Neutral Ramming Mass Market, 2031
- Historical Data and Forecast of Croatia Neutral Ramming Mass Revenues & Volume for the Period 2021- 2031
- Croatia Neutral Ramming Mass Market Trend Evolution
- Croatia Neutral Ramming Mass Market Drivers and Challenges
- Croatia Neutral Ramming Mass Price Trends
- Croatia Neutral Ramming Mass Porter's Five Forces
- Croatia Neutral Ramming Mass Industry Life Cycle
- Historical Data and Forecast of Croatia Neutral Ramming Mass Market Revenues & Volume By Type for the Period 2021- 2031
- Historical Data and Forecast of Croatia Neutral Ramming Mass Market Revenues & Volume By High Alumina Ramming Mass for the Period 2021- 2031
- Historical Data and Forecast of Croatia Neutral Ramming Mass Market Revenues & Volume By Monolithic Ramming Mass for the Period 2021- 2031
- Historical Data and Forecast of Croatia Neutral Ramming Mass Market Revenues & Volume By Spinel Ramming Mass for the Period 2021- 2031
- Historical Data and Forecast of Croatia Neutral Ramming Mass Market Revenues & Volume By Others for the Period 2021- 2031
- Historical Data and Forecast of Croatia Neutral Ramming Mass Market Revenues & Volume By Silica Content for the Period 2021- 2031
- Historical Data and Forecast of Croatia Neutral Ramming Mass Market Revenues & Volume By Up to 80% for the Period 2021- 2031
- Historical Data and Forecast of Croatia Neutral Ramming Mass Market Revenues & Volume By >80% to 85% for the Period 2021- 2031
- Historical Data and Forecast of Croatia Neutral Ramming Mass Market Revenues & Volume By >85% for the Period 2021- 2031
- Historical Data and Forecast of Croatia Neutral Ramming Mass Market Revenues & Volume By Application for the Period 2021- 2031
- Historical Data and Forecast of Croatia Neutral Ramming Mass Market Revenues & Volume By Induction Furnaces for the Period 2021- 2031
- Historical Data and Forecast of Croatia Neutral Ramming Mass Market Revenues & Volume By Electric Arc Furnaces (EAF) for the Period 2021- 2031
- Historical Data and Forecast of Croatia Neutral Ramming Mass Market Revenues & Volume By Crucibles for the Period 2021- 2031
- Historical Data and Forecast of Croatia Neutral Ramming Mass Market Revenues & Volume By Cupola Furnaces for the Period 2021- 2031
- Historical Data and Forecast of Croatia Neutral Ramming Mass Market Revenues & Volume By Others for the Period 2021- 2031
- Historical Data and Forecast of Croatia Neutral Ramming Mass Market Revenues & Volume By End-use for the Period 2021- 2031
- Historical Data and Forecast of Croatia Neutral Ramming Mass Market Revenues & Volume By Metallurgy for the Period 2021- 2031
- Historical Data and Forecast of Croatia Neutral Ramming Mass Market Revenues & Volume By Glass for the Period 2021- 2031
- Historical Data and Forecast of Croatia Neutral Ramming Mass Market Revenues & Volume By Chemical for the Period 2021- 2031
- Historical Data and Forecast of Croatia Neutral Ramming Mass Market Revenues & Volume By Others for the Period 2021- 2031
- Croatia Neutral Ramming Mass Import Export Trade Statistics
- Market Opportunity Assessment By Type
- Market Opportunity Assessment By Silica Content
- Market Opportunity Assessment By Application
- Market Opportunity Assessment By End-use
- Croatia Neutral Ramming Mass Top Companies Market Share
- Croatia Neutral Ramming Mass Competitive Benchmarking By Technical and Operational Parameters
- Croatia Neutral Ramming Mass Company Profiles
- Croatia Neutral Ramming Mass Key Strategic Recommendations
Frequently Asked Questions About the Market Study (FAQs):
6Wresearch actively monitors the Croatia Neutral Ramming Mass Market and publishes its comprehensive annual report, highlighting emerging trends, growth drivers, revenue analysis, and forecast outlook. Our insights help businesses to make data-backed strategic decisions with ongoing market dynamics. Our analysts track relevent industries related to the Croatia Neutral Ramming Mass Market, allowing our clients with actionable intelligence and reliable forecasts tailored to emerging regional needs.
Yes, we provide customisation as per your requirements. To learn more, feel free to contact us on sales@6wresearch.com
1 Executive Summary |
2 Introduction |
2.1 Key Highlights of the Report |
2.2 Report Description |
2.3 Market Scope & Segmentation |
2.4 Research Methodology |
2.5 Assumptions |
3 Croatia Neutral Ramming Mass Market Overview |
3.1 Croatia Country Macro Economic Indicators |
3.2 Croatia Neutral Ramming Mass Market Revenues & Volume, 2021 & 2031F |
3.3 Croatia Neutral Ramming Mass Market - Industry Life Cycle |
3.4 Croatia Neutral Ramming Mass Market - Porter's Five Forces |
3.5 Croatia Neutral Ramming Mass Market Revenues & Volume Share, By Type, 2021 & 2031F |
3.6 Croatia Neutral Ramming Mass Market Revenues & Volume Share, By Silica Content, 2021 & 2031F |
3.7 Croatia Neutral Ramming Mass Market Revenues & Volume Share, By Application, 2021 & 2031F |
3.8 Croatia Neutral Ramming Mass Market Revenues & Volume Share, By End-use, 2021 & 2031F |
4 Croatia Neutral Ramming Mass Market Dynamics |
4.1 Impact Analysis |
4.2 Market Drivers |
4.2.1 Increasing demand for refractories in industries such as steel, cement, and glass, which drives the demand for neutral ramming mass. |
4.2.2 Growing infrastructure development activities in Croatia, leading to higher demand for refractory products like ramming mass. |
4.2.3 Technological advancements in the manufacturing processes of neutral ramming mass, leading to improved product quality and performance. |
4.3 Market Restraints |
4.3.1 Fluctuating raw material prices, impacting the production cost and pricing of neutral ramming mass. |
4.3.2 Environmental regulations and concerns regarding the use of traditional refractory materials, leading to a shift towards more sustainable alternatives. |
5 Croatia Neutral Ramming Mass Market Trends |
6 Croatia Neutral Ramming Mass Market, By Types |
6.1 Croatia Neutral Ramming Mass Market, By Type |
6.1.1 Overview and Analysis |
6.1.2 Croatia Neutral Ramming Mass Market Revenues & Volume, By Type, 2021- 2031F |
6.1.3 Croatia Neutral Ramming Mass Market Revenues & Volume, By High Alumina Ramming Mass, 2021- 2031F |
6.1.4 Croatia Neutral Ramming Mass Market Revenues & Volume, By Monolithic Ramming Mass, 2021- 2031F |
6.1.5 Croatia Neutral Ramming Mass Market Revenues & Volume, By Spinel Ramming Mass, 2021- 2031F |
6.1.6 Croatia Neutral Ramming Mass Market Revenues & Volume, By Others, 2021- 2031F |
6.2 Croatia Neutral Ramming Mass Market, By Silica Content |
6.2.1 Overview and Analysis |
6.2.2 Croatia Neutral Ramming Mass Market Revenues & Volume, By Up to 80%, 2021- 2031F |
6.2.3 Croatia Neutral Ramming Mass Market Revenues & Volume, By >80% to 85%, 2021- 2031F |
6.2.4 Croatia Neutral Ramming Mass Market Revenues & Volume, By >85%, 2021- 2031F |
6.3 Croatia Neutral Ramming Mass Market, By Application |
6.3.1 Overview and Analysis |
6.3.2 Croatia Neutral Ramming Mass Market Revenues & Volume, By Induction Furnaces, 2021- 2031F |
6.3.3 Croatia Neutral Ramming Mass Market Revenues & Volume, By Electric Arc Furnaces (EAF), 2021- 2031F |
6.3.4 Croatia Neutral Ramming Mass Market Revenues & Volume, By Crucibles, 2021- 2031F |
6.3.5 Croatia Neutral Ramming Mass Market Revenues & Volume, By Cupola Furnaces, 2021- 2031F |
6.3.6 Croatia Neutral Ramming Mass Market Revenues & Volume, By Others, 2021- 2031F |
6.4 Croatia Neutral Ramming Mass Market, By End-use |
6.4.1 Overview and Analysis |
6.4.2 Croatia Neutral Ramming Mass Market Revenues & Volume, By Metallurgy, 2021- 2031F |
6.4.3 Croatia Neutral Ramming Mass Market Revenues & Volume, By Glass, 2021- 2031F |
6.4.4 Croatia Neutral Ramming Mass Market Revenues & Volume, By Chemical, 2021- 2031F |
6.4.5 Croatia Neutral Ramming Mass Market Revenues & Volume, By Others, 2021- 2031F |
7 Croatia Neutral Ramming Mass Market Import-Export Trade Statistics |
7.1 Croatia Neutral Ramming Mass Market Export to Major Countries |
7.2 Croatia Neutral Ramming Mass Market Imports from Major Countries |
8 Croatia Neutral Ramming Mass Market Key Performance Indicators |
8.1 Average order value per customer for neutral ramming mass. |
8.2 Percentage of repeat customers, indicating customer satisfaction and loyalty. |
8.3 Market penetration rate of neutral ramming mass in key industries in Croatia. |
9 Croatia Neutral Ramming Mass Market - Opportunity Assessment |
9.1 Croatia Neutral Ramming Mass Market Opportunity Assessment, By Type, 2021 & 2031F |
9.2 Croatia Neutral Ramming Mass Market Opportunity Assessment, By Silica Content, 2021 & 2031F |
9.3 Croatia Neutral Ramming Mass Market Opportunity Assessment, By Application, 2021 & 2031F |
9.4 Croatia Neutral Ramming Mass Market Opportunity Assessment, By End-use, 2021 & 2031F |
10 Croatia Neutral Ramming Mass Market - Competitive Landscape |
10.1 Croatia Neutral Ramming Mass Market Revenue Share, By Companies, 2024 |
10.2 Croatia Neutral Ramming Mass Market Competitive Benchmarking, By Operating and Technical Parameters |
11 Company Profiles |
12 Recommendations |
13 Disclaimer |
Export potential assessment - trade Analytics for 2030
Export potential enables firms to identify high-growth global markets with greater confidence by combining advanced trade intelligence with a structured quantitative methodology. The framework analyzes emerging demand trends and country-level import patterns while integrating macroeconomic and trade datasets such as GDP and population forecasts, bilateral import–export flows, tariff structures, elasticity differentials between developed and developing economies, geographic distance, and import demand projections. Using weighted trade values from 2020–2024 as the base period to project country-to-country export potential for 2030, these inputs are operationalized through calculated drivers such as gravity model parameters, tariff impact factors, and projected GDP per-capita growth. Through an analysis of hidden potentials, demand hotspots, and market conditions that are most favorable to success, this method enables firms to focus on target countries, maximize returns, and global expansion with data, backed by accuracy.
By factoring in the projected importer demand gap that is currently unmet and could be potential opportunity, it identifies the potential for the Exporter (Country) among 190 countries, against the general trade analysis, which identifies the biggest importer or exporter.
To discover high-growth global markets and optimize your business strategy:
Click Here
Pricing
- Single User License$ 1,995
- Department License$ 2,400
- Site License$ 3,120
- Global License$ 3,795

Search
Thought Leadership and Analyst Meet


Our Clients
Latest Reports
- Canada Cloud CFD Market (2026-2032) | Size & Revenue, Industry, Growth, Competitive Landscape, Forecast, Segmentation, Value, Outlook, Trends, Share, Analysis, Companies
- Taiwan Food Delivery Platform Market (2026-2032) | Companies, Outlook, Analysis, Trends, Value, Revenue, Segmentation, Share, Forecast, Competitive Landscape, Growth, Size & Forecast
- United Kingdom (UK) Long-term Care Insurance Market (2026-2032) | Growth, Share, Consumer Insights, Drivers, Opportunities, Competition, Pricing Analysis, Segments, Restraints, Companies, Competitive, Value, Outlook, Size, Demand, Analysis, Challenges, Strategic Insights, Investment Trends, Revenue, Trends, Supply, Forecast
- United Kingdom (UK) Long Term Care Market (2026-2032) | Companies, Outlook, Analysis, Trends, Value, Revenue, Segmentation, Share, Forecast, Competitive Landscape, Growth, Size & Forecast
- Iraq Insulation and Waterproofing Market (2026-2032) | Outlook, Drivers, Growth, Size, Share, Industry, Revenue, Trends, Demand, Competitive, Strategic Insights, Opportunities, Segments, Companies, Challenges, Strategy, Consumer Insights, Analysis, Investment Trends, Value, Segmentation, Forecast, Restraints
- India Switchgear Market Outlook (2026-2032) | Size, Share, Trends, Growth, Revenue, Forecast, Analysis, Value, Outlook
- Pakistan Contraceptive Implants Market (2025-2031) | Demand, Growth, Size, Share, Industry, Pricing Analysis, Competitive, Strategic Insights, Strategy, Consumer Insights, Analysis, Investment Trends, Opportunities, Revenue, Segments, Value, Segmentation, Supply, Forecast, Restraints, Outlook, Competition, Drivers, Trends, Companies, Challenges
- Sri Lanka Packaging Market (2026-2032) | Outlook, Competition, Drivers, Trends, Demand, Pricing Analysis, Competitive, Strategic Insights, Companies, Challenges, Strategy, Consumer Insights, Analysis, Investment Trends, Opportunities, Growth, Size, Share, Industry, Revenue, Segments, Value, Segmentation, Supply, Forecast, Restraints
- India Kids Watches Market (2026-2032) | Strategy, Consumer Insights, Analysis, Investment Trends, Opportunities, Growth, Size, Share, Industry, Revenue, Segments, Value, Segmentation, Supply, Forecast, Restraints, Outlook, Competition, Drivers, Trends, Demand, Pricing Analysis, Competitive, Strategic Insights, Companies, Challenges
- Saudi Arabia Core Assurance Service Market (2025-2031) | Strategy, Consumer Insights, Analysis, Investment Trends, Opportunities, Growth, Size, Share, Industry, Revenue, Segments, Value, Segmentation, Supply, Forecast, Restraints, Outlook, Competition, Drivers, Trends, Demand, Pricing Analysis, Competitive, Strategic Insights, Companies, Challenges
Industry Events and Analyst Meet

India EV Show 2026

EV tech India Expo 2026

Auto Tech Asia 2026

Battery Tech India 2026

Smart Production Solutions Guangzhou 2026
Whitepaper
- Middle East & Africa Commercial Security Market Click here to view more.
- Middle East & Africa Fire Safety Systems & Equipment Market Click here to view more.
- GCC Drone Market Click here to view more.
- Middle East Lighting Fixture Market Click here to view more.
- GCC Physical & Perimeter Security Market Click here to view more.
6WResearch In News
- Doha a strategic location for EV manufacturing hub: IPA Qatar
- Demand for luxury TVs surging in the GCC, says Samsung
- Empowering Growth: The Thriving Journey of Bangladesh’s Cable Industry
- Demand for luxury TVs surging in the GCC, says Samsung
- Video call with a traditional healer? Once unthinkable, it’s now common in South Africa
- Intelligent Buildings To Smooth GCC’s Path To Net Zero