Croatia Potassium sulphate Market (2025-2031) | Outlook, Trends, Growth, Industry, Size, Segmentation, Share, Forecast, Revenue, Value, Analysis & Companies
Market Forecast By Form (Solid, Liquid), By Process (Mannheim Process, Sulphate Salts Reaction, Brine Processing, Others), By End-users (Agriculture, Industrial, Pharmaceuticals, Cosmetics, Food & Beverages, Others) And Competitive Landscape
| Product Code: ETC4703966 | Publication Date: Nov 2023 | Updated Date: Apr 2026 | Product Type: Market Research Report | |
| Publisher: 6Wresearch | Author: Shubham Deep | No. of Pages: 60 | No. of Figures: 30 | No. of Tables: 5 |
Croatia Potassium Sulphate Market Size (2020-2030)
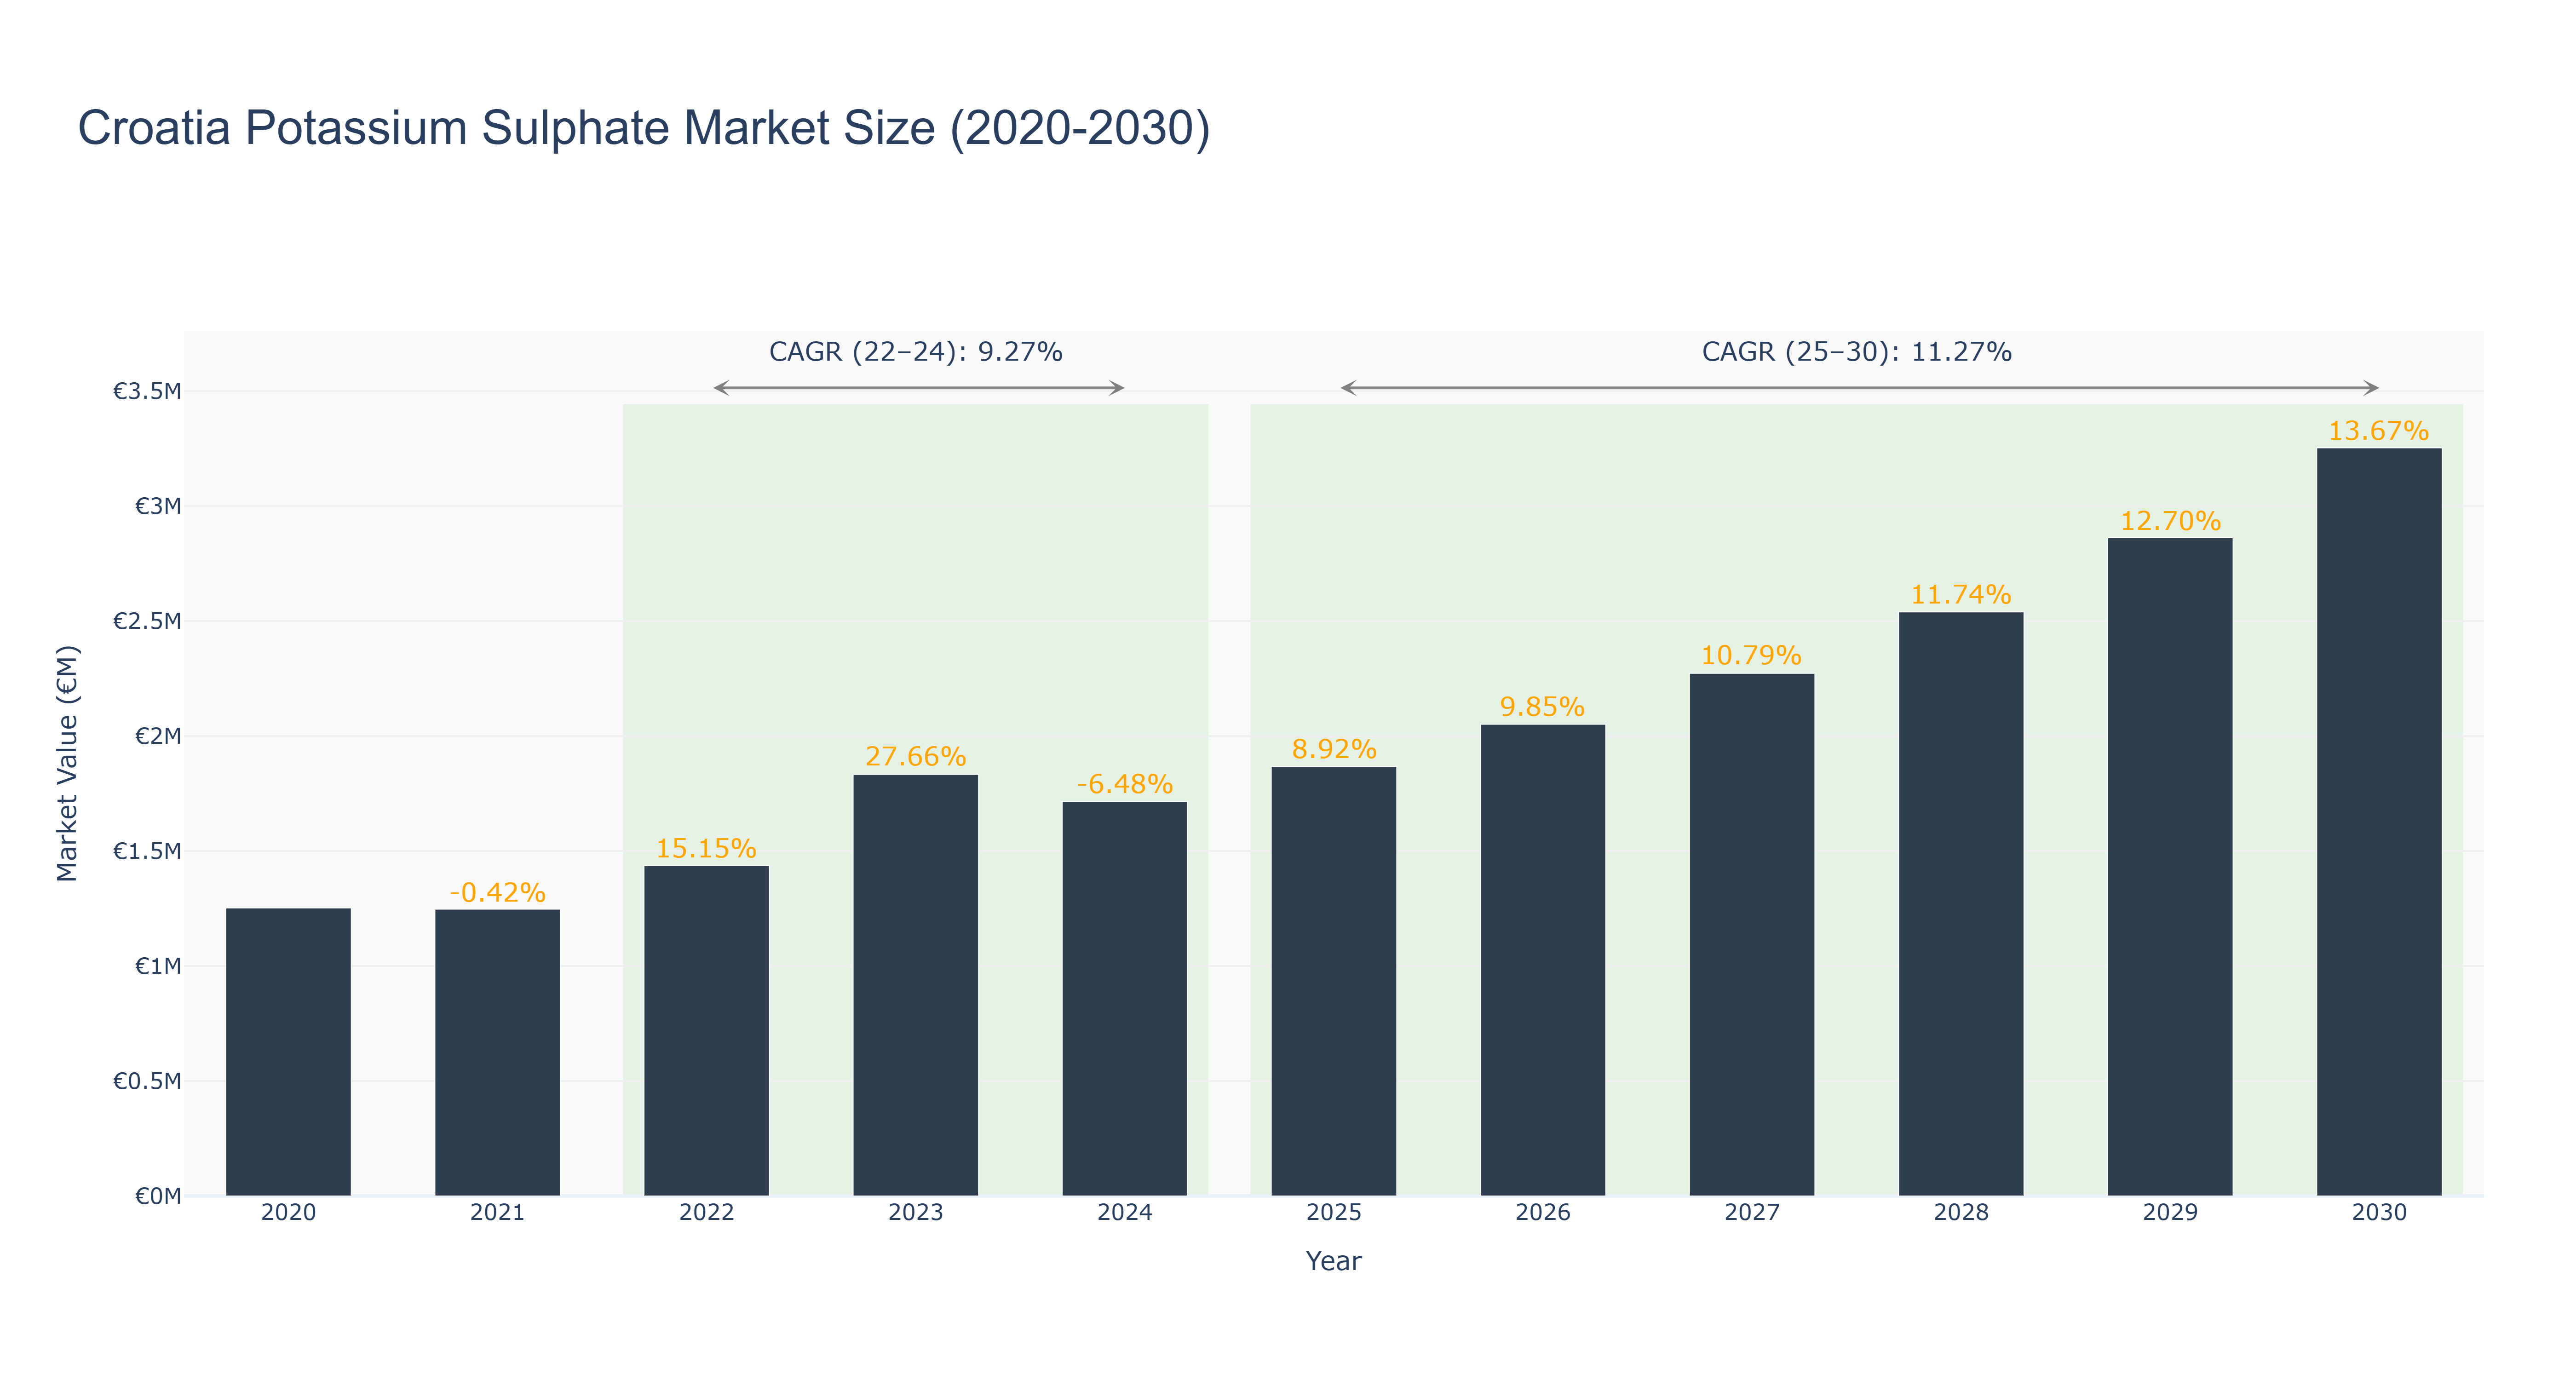
Croatia Potassium Sulphate Market demonstrated a mixed yet overall upward trajectory during the historical period, with actual data indicating fluctuations before stabilizing. The market recorded a notable rise from €1.25 million in 2020 to a peak of €1.83 million in 2023, before moderating to €1.71 million in 2024, reflecting an actual CAGR of 9.27% during 2022–2024. This growth was primarily driven by increased demand for high-efficiency fertilizers and improving agricultural productivity, while the slight decline in 2024 may be attributed to input cost volatility and shifting trade dynamics. Looking ahead, the market is projected to expand steadily, reaching €3.25 million by 2030, supported by a forecasted CAGR of 11.27% from 2025 to 2030. This anticipated growth is likely to be fueled by rising adoption of specialty fertilizers, supportive agricultural policies, and a gradual shift toward sustainable farming practices across Croatia.
Croatia Potassium Sulphate Market: Production & Trade Performance (2019-2025)
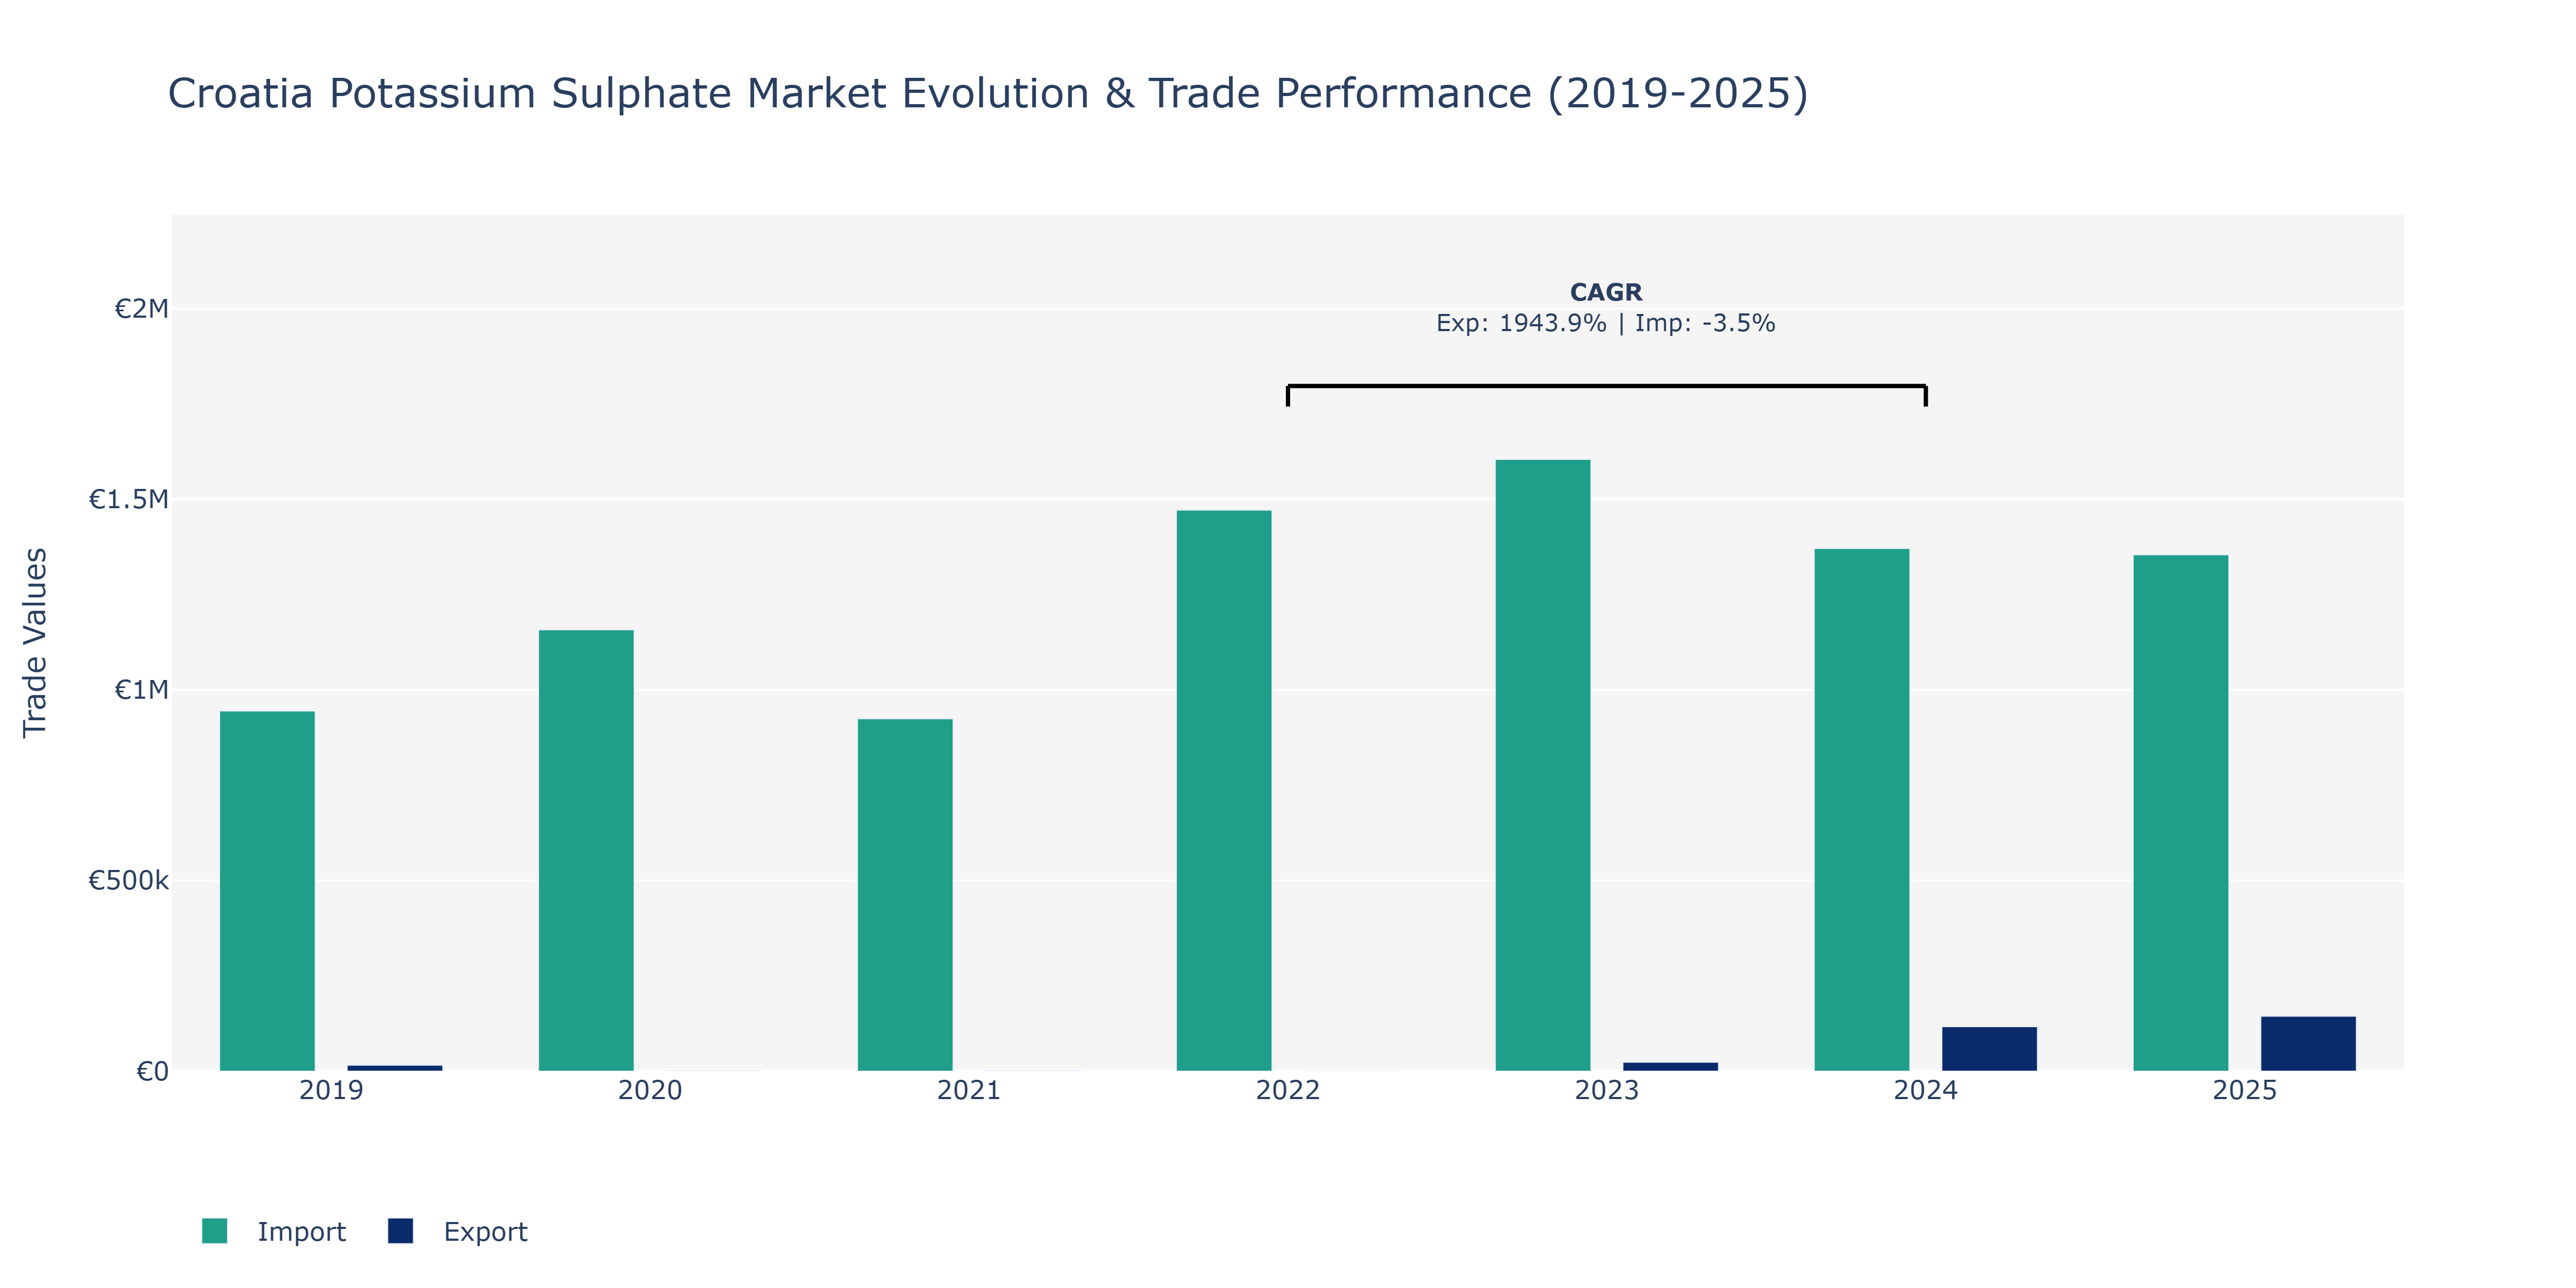
The Croatia Potassium Sulphate Market experienced notable fluctuations in both Exports and Imports from 2019 to 2025. Exports saw a substantial decrease in 2020 to €1.53 thousand before gradually recovering and reaching a peak of €144.29 thousand in 2025, representing a significant rebound. In contrast, Imports displayed a more erratic trend, peaking in 2023 at €1.6 million and then declining to €1.35 million in 2025. The fluctuations in Exports can be attributed to global demand shifts and competitive pricing strategies, while Imports may have been influenced by changes in domestic production capacity and international trade policies. The market's recovery post-2020 aligns with the overall industry resilience amidst economic uncertainties, as potassium sulphate remains a vital component in agricultural applications, driving market growth despite temporary setbacks.
Croatia Potassium sulphate Market Overview
The Croatia Potassium Sulphate Market provides a source of potassium that is free of chloride, making it ideal for crops sensitive to chloride, such as fruits, vegetables, and tobacco. The market is driven by the demand for high-quality fertilizers that cater to specific agricultural needs.
Drivers of the market
The potassium sulphate market benefits from its use as a fertilizer and in various industrial applications. Its role in enhancing crop yields and improving soil health drives demand. The growth of global agriculture and the need for effective soil nutrients support the expansion of the potassium sulphate market.
Challenges of the market
The potassium sulphate market in Croatia deals with challenges such as fluctuating raw material costs and managing the environmental impact of production. Companies must comply with stringent regulations and find ways to reduce emissions and waste associated with potassium sulphate manufacturing. Competition from alternative fertilizers and the need for efficient production technologies further complicate market dynamics.
Government Policy of the market
The Croatian government regulates the potassium sulphate market to ensure that products meet safety and quality standards. Policies focus on minimizing environmental impact and promoting sustainable agricultural practices. The government supports innovation in potassium sulphate technologies and provides incentives for the development of eco-friendly solutions.
Key Highlights of the Report:
- Croatia Potassium sulphate Market Outlook
- Market Size of Croatia Potassium sulphate Market, 2024
- Forecast of Croatia Potassium sulphate Market, 2031
- Historical Data and Forecast of Croatia Potassium sulphate Revenues & Volume for the Period 2021-2031
- Croatia Potassium sulphate Market Trend Evolution
- Croatia Potassium sulphate Market Drivers and Challenges
- Croatia Potassium sulphate Price Trends
- Croatia Potassium sulphate Porter`s Five Forces
- Croatia Potassium sulphate Industry Life Cycle
- Historical Data and Forecast of Croatia Potassium sulphate Market Revenues & Volume By Form for the Period 2021-2031
- Historical Data and Forecast of Croatia Potassium sulphate Market Revenues & Volume By Solidfor the Period 2021-2031
- Historical Data and Forecast of Croatia Potassium sulphate Market Revenues & Volume By Liquidfor the Period 2021-2031
- Historical Data and Forecast of Croatia Potassium sulphate Market Revenues & Volume By Process for the Period 2021-2031
- Historical Data and Forecast of Croatia Potassium sulphate Market Revenues & Volume By Mannheim Process for the Period 2021-2031
- Historical Data and Forecast of Croatia Potassium sulphate Market Revenues & Volume By Sulphate Salts Reaction for the Period 2021-2031
- Historical Data and Forecast of Croatia Potassium sulphate Market Revenues & Volume By Brine Processing for the Period 2021-2031
- Historical Data and Forecast of Croatia Potassium sulphate Market Revenues & Volume By Others for the Period 2021-2031
- Historical Data and Forecast of Croatia Potassium sulphate Market Revenues & Volume By End-users for the Period 2021-2031
- Historical Data and Forecast of Croatia Potassium sulphate Market Revenues & Volume By Agriculture for the Period 2021-2031
- Historical Data and Forecast of Croatia Potassium sulphate Market Revenues & Volume By Industrial for the Period 2021-2031
- Historical Data and Forecast of Croatia Potassium sulphate Market Revenues & Volume By Pharmaceuticals for the Period 2021-2031
- Historical Data and Forecast of Croatia Potassium sulphate Market Revenues & Volume By Cosmetics for the Period 2021-2031
- Historical Data and Forecast of Croatia Potassium sulphate Market Revenues & Volume By Food & Beverages for the Period 2021-2031
- Historical Data and Forecast of Croatia Potassium sulphate Market Revenues & Volume By Others for the Period 2021-2031
- Croatia Potassium sulphate Import Export Trade Statistics
- Market Opportunity Assessment By Form
- Market Opportunity Assessment By Process
- Market Opportunity Assessment By End-users
- Croatia Potassium sulphate Top Companies Market Share
- Croatia Potassium sulphate Competitive Benchmarking By Technical and Operational Parameters
- Croatia Potassium sulphate Company Profiles
- Croatia Potassium sulphate Key Strategic Recommendations
Frequently Asked Questions About the Market Study (FAQs):
6Wresearch actively monitors the Croatia Potassium sulphate Market and publishes its comprehensive annual report, highlighting emerging trends, growth drivers, revenue analysis, and forecast outlook. Our insights help businesses to make data-backed strategic decisions with ongoing market dynamics. Our analysts track relevent industries related to the Croatia Potassium sulphate Market, allowing our clients with actionable intelligence and reliable forecasts tailored to emerging regional needs.
Yes, we provide customisation as per your requirements. To learn more, feel free to contact us on sales@6wresearch.com
1 Executive Summary |
2 Introduction |
2.1 Key Highlights of the Report |
2.2 Report Description |
2.3 Market Scope & Segmentation |
2.4 Research Methodology |
2.5 Assumptions |
3 Croatia Potassium sulphate Market Overview |
3.1 Croatia Country Macro Economic Indicators |
3.2 Croatia Potassium sulphate Market Revenues & Volume, 2021 & 2031F |
3.3 Croatia Potassium sulphate Market - Industry Life Cycle |
3.4 Croatia Potassium sulphate Market - Porter's Five Forces |
3.5 Croatia Potassium sulphate Market Revenues & Volume Share, By Form, 2021 & 2031F |
3.6 Croatia Potassium sulphate Market Revenues & Volume Share, By Process, 2021 & 2031F |
3.7 Croatia Potassium sulphate Market Revenues & Volume Share, By End-users, 2021 & 2031F |
4 Croatia Potassium sulphate Market Dynamics |
4.1 Impact Analysis |
4.2 Market Drivers |
4.2.1 Growing demand for organic farming practices leading to increased use of potassium sulphate as a fertilizer |
4.2.2 Favorable government regulations promoting the use of potassium sulphate in agriculture |
4.2.3 Rising awareness about the benefits of potassium sulphate over other fertilizers |
4.3 Market Restraints |
4.3.1 Fluctuating prices of raw materials affecting the production cost of potassium sulphate |
4.3.2 Competition from alternative fertilizers like potassium chloride impacting market growth |
4.3.3 Challenges in distribution and logistics leading to supply chain disruptions |
5 Croatia Potassium sulphate Market Trends |
6 Croatia Potassium sulphate Market Segmentations |
6.1 Croatia Potassium sulphate Market, By Form |
6.1.1 Overview and Analysis |
6.1.2 Croatia Potassium sulphate Market Revenues & Volume, By Solid? , 2021-2031F |
6.1.3 Croatia Potassium sulphate Market Revenues & Volume, By Liquid? , 2021-2031F |
6.2 Croatia Potassium sulphate Market, By Process |
6.2.1 Overview and Analysis |
6.2.2 Croatia Potassium sulphate Market Revenues & Volume, By Mannheim Process, 2021-2031F |
6.2.3 Croatia Potassium sulphate Market Revenues & Volume, By Sulphate Salts Reaction, 2021-2031F |
6.2.4 Croatia Potassium sulphate Market Revenues & Volume, By Brine Processing, 2021-2031F |
6.2.5 Croatia Potassium sulphate Market Revenues & Volume, By Others, 2021-2031F |
6.3 Croatia Potassium sulphate Market, By End-users |
6.3.1 Overview and Analysis |
6.3.2 Croatia Potassium sulphate Market Revenues & Volume, By Agriculture, 2021-2031F |
6.3.3 Croatia Potassium sulphate Market Revenues & Volume, By Industrial, 2021-2031F |
6.3.4 Croatia Potassium sulphate Market Revenues & Volume, By Pharmaceuticals, 2021-2031F |
6.3.5 Croatia Potassium sulphate Market Revenues & Volume, By Cosmetics, 2021-2031F |
6.3.6 Croatia Potassium sulphate Market Revenues & Volume, By Food & Beverages, 2021-2031F |
6.3.7 Croatia Potassium sulphate Market Revenues & Volume, By Others, 2021-2031F |
7 Croatia Potassium sulphate Market Import-Export Trade Statistics |
7.1 Croatia Potassium sulphate Market Export to Major Countries |
7.2 Croatia Potassium sulphate Market Imports from Major Countries |
8 Croatia Potassium sulphate Market Key Performance Indicators |
8.1 Average selling price of potassium sulphate in the Croatian market |
8.2 Number of new product launches or innovations in the potassium sulphate sector |
8.3 Adoption rate of potassium sulphate in different agriculture segments within Croatia |
8.4 Investment in research and development for potassium sulphate products |
8.5 Sustainability initiatives implemented by potassium sulphate manufacturers in Croatia |
9 Croatia Potassium sulphate Market - Opportunity Assessment |
9.1 Croatia Potassium sulphate Market Opportunity Assessment, By Form, 2021 & 2031F |
9.2 Croatia Potassium sulphate Market Opportunity Assessment, By Process, 2021 & 2031F |
9.3 Croatia Potassium sulphate Market Opportunity Assessment, By End-users, 2021 & 2031F |
10 Croatia Potassium sulphate Market - Competitive Landscape |
10.1 Croatia Potassium sulphate Market Revenue Share, By Companies, 2024 |
10.2 Croatia Potassium sulphate Market Competitive Benchmarking, By Operating and Technical Parameters |
11 Company Profiles |
12 Recommendations | 13 Disclaimer |
Global Go To Market Strategy - 2030
Export potential enables firms to identify high-growth global markets with greater confidence by combining advanced trade intelligence with a structured quantitative methodology. The framework analyzes emerging demand trends and country-level import patterns while integrating macroeconomic and trade datasets such as GDP and population forecasts, bilateral import–export flows, tariff structures, elasticity differentials between developed and developing economies, geographic distance, and import demand projections. Using weighted trade values from 2020–2024 as the base period to project country-to-country export potential for 2030, these inputs are operationalized through calculated drivers such as gravity model parameters, tariff impact factors, and projected GDP per-capita growth. Through an analysis of hidden potentials, demand hotspots, and market conditions that are most favorable to success, this method enables firms to focus on target countries, maximize returns, and global expansion with data, backed by accuracy.
By factoring in the projected importer demand gap that is currently unmet and could be potential opportunity, it identifies the potential for the Exporter (Country) among 190 countries, against the general trade analysis, which identifies the biggest importer or exporter.
To discover high-growth global markets and optimize your business strategy:
Click Here
Pricing
- Single User License$ 1,995
- Department License$ 2,400
- Site License$ 3,120
- Global License$ 3,795

Leadership Perspectives from Industry Events
Search
Thought Leadership and Analyst Meet


Our Clients
6WResearch In News
- Doha a strategic location for EV manufacturing hub: IPA Qatar
- Demand for luxury TVs surging in the GCC, says Samsung
- Empowering Growth: The Thriving Journey of Bangladesh’s Cable Industry
- Demand for luxury TVs surging in the GCC, says Samsung
- Video call with a traditional healer? Once unthinkable, it’s now common in South Africa
- Intelligent Buildings To Smooth GCC’s Path To Net Zero
Latest Reports
- Taiwan Airport Wireless Infrastructure Market (2026-2032)
- Vietnam Airport Wireless Infrastructure Market (2026-2032)
- Thailand Airport Wireless Infrastructure Market (2026-2032)
- South Korea Airport Wireless Infrastructure Market (2026-2032)
- Romania Airport Wireless Infrastructure Market (2026-2032)
- Qatar Airport Wireless Infrastructure Market (2026-2032)
- Philippines Airport Wireless Infrastructure Market (2026-2032)
- Japan Airport Wireless Infrastructure Market (2026-2032)
- Taiwan Airport Winter Services Market (2026-2032)
- Vietnam Airport Winter Services Market (2026-2032)
Industry Events and Analyst Meet

HIMTEX 2026

India Refining Summit 2026

India EV Show 2026

EV tech India Expo 2026

Auto Tech Asia 2026
Whitepaper
- Middle East & Africa Commercial Security Market Click here to view more.
- Middle East & Africa Fire Safety Systems & Equipment Market Click here to view more.
- GCC Drone Market Click here to view more.
- Middle East Lighting Fixture Market Click here to view more.
- GCC Physical & Perimeter Security Market Click here to view more.