Croatia Soda Ash Technical Material Market (2026-2032) | Strategy, Strategic Insights, Size, Opportunities, Trends, Investment Trends, Competitive, Value, Outlook, Challenges, Restraints, Competition, Demand, Share, Drivers, Forecast, Companies, Segments, Supply, Analysis, Consumer Insights, Segmentation, Growth, Industry, Revenue, Pricing Analysis
Market Forecast By Type (Dense Soda Ash, Light Soda Ash, Natural Soda Ash, Synthetic Soda Ash, Heavy Soda Ash), By Grade (Industrial, Food-Grade, Pharmaceutical, High-Purity, Technical), By Application (Glass Manufacturing, Detergent Production, Water Treatment, Textile Processing, Chemical Processing), By Manufacturing Process (Solvay Process, Leblanc Process, Trona Mining, Carbonation, Brine Purification), By End User (Glass & Ceramics, Soaps & Detergents, Pharmaceuticals, Textile & Dyes, Pulp & Paper) And Competitive Landscape
| Product Code: ETC10852181 | Publication Date: Apr 2025 | Updated Date: Apr 2026 | Product Type: Market Research Report | |
| Publisher: 6Wresearch | No. of Pages: 65 | No. of Figures: 34 | No. of Tables: 19 | |
Croatia Soda Ash Technical Material Market Size (2020-2030)
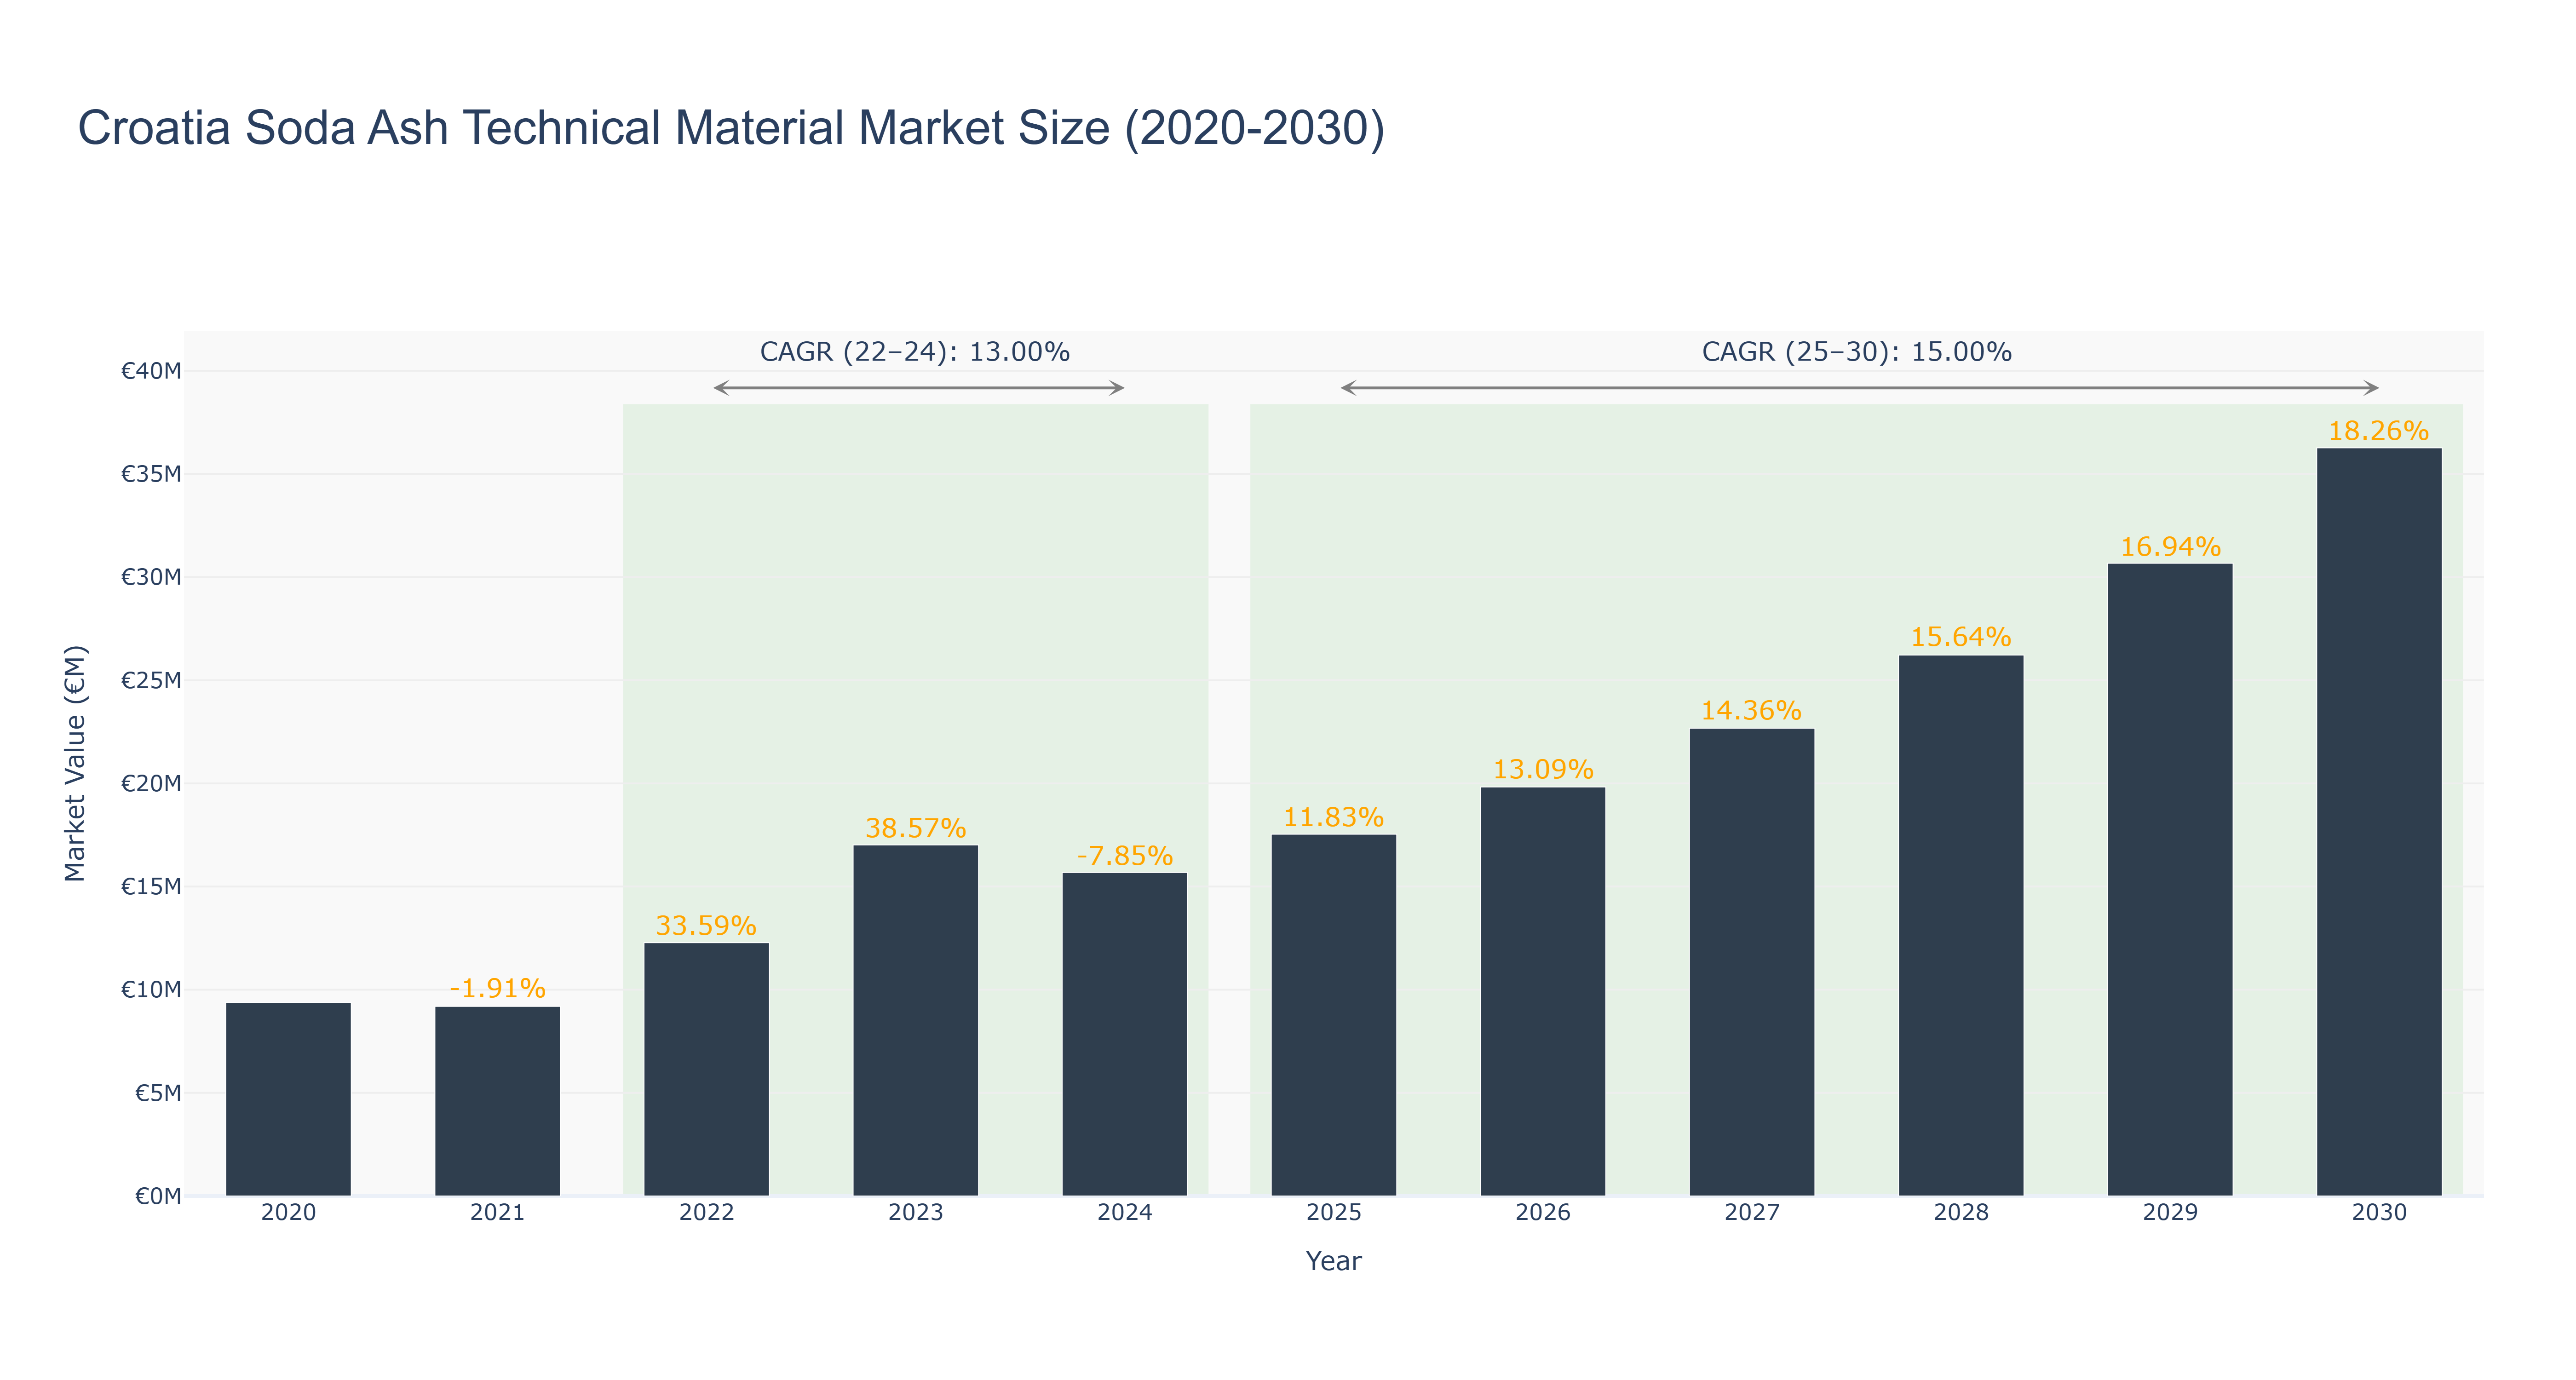
The Croatia Soda Ash Technical Material Market exhibited notable fluctuations between 2020 and 2024, peaking in 2023 at €17.02 million, following a robust growth of 38.57%. This period began with a decline to €9.37 million in 2020, followed by a slight contraction in 2021. However, a substantial recovery occurred in 2022, resulting in a market size of €12.28 million and a compounded annual growth rate (CAGR) of 13.00% from 2022 to 2024. Looking ahead to the forecasted period from 2025 to 2030, the market is projected to reach €36.27 million, with a CAGR of 15.00%. Key drivers for this growth include increasing industrial applications and the demand for sustainable materials. Continued investment in infrastructure and manufacturing capabilities is expected to support this upward trajectory, positioning Croatia as a competitive player in the regional soda ash market.
Croatia Soda Ash Technical Material Market: Production & Trade Performance (2019-2025)
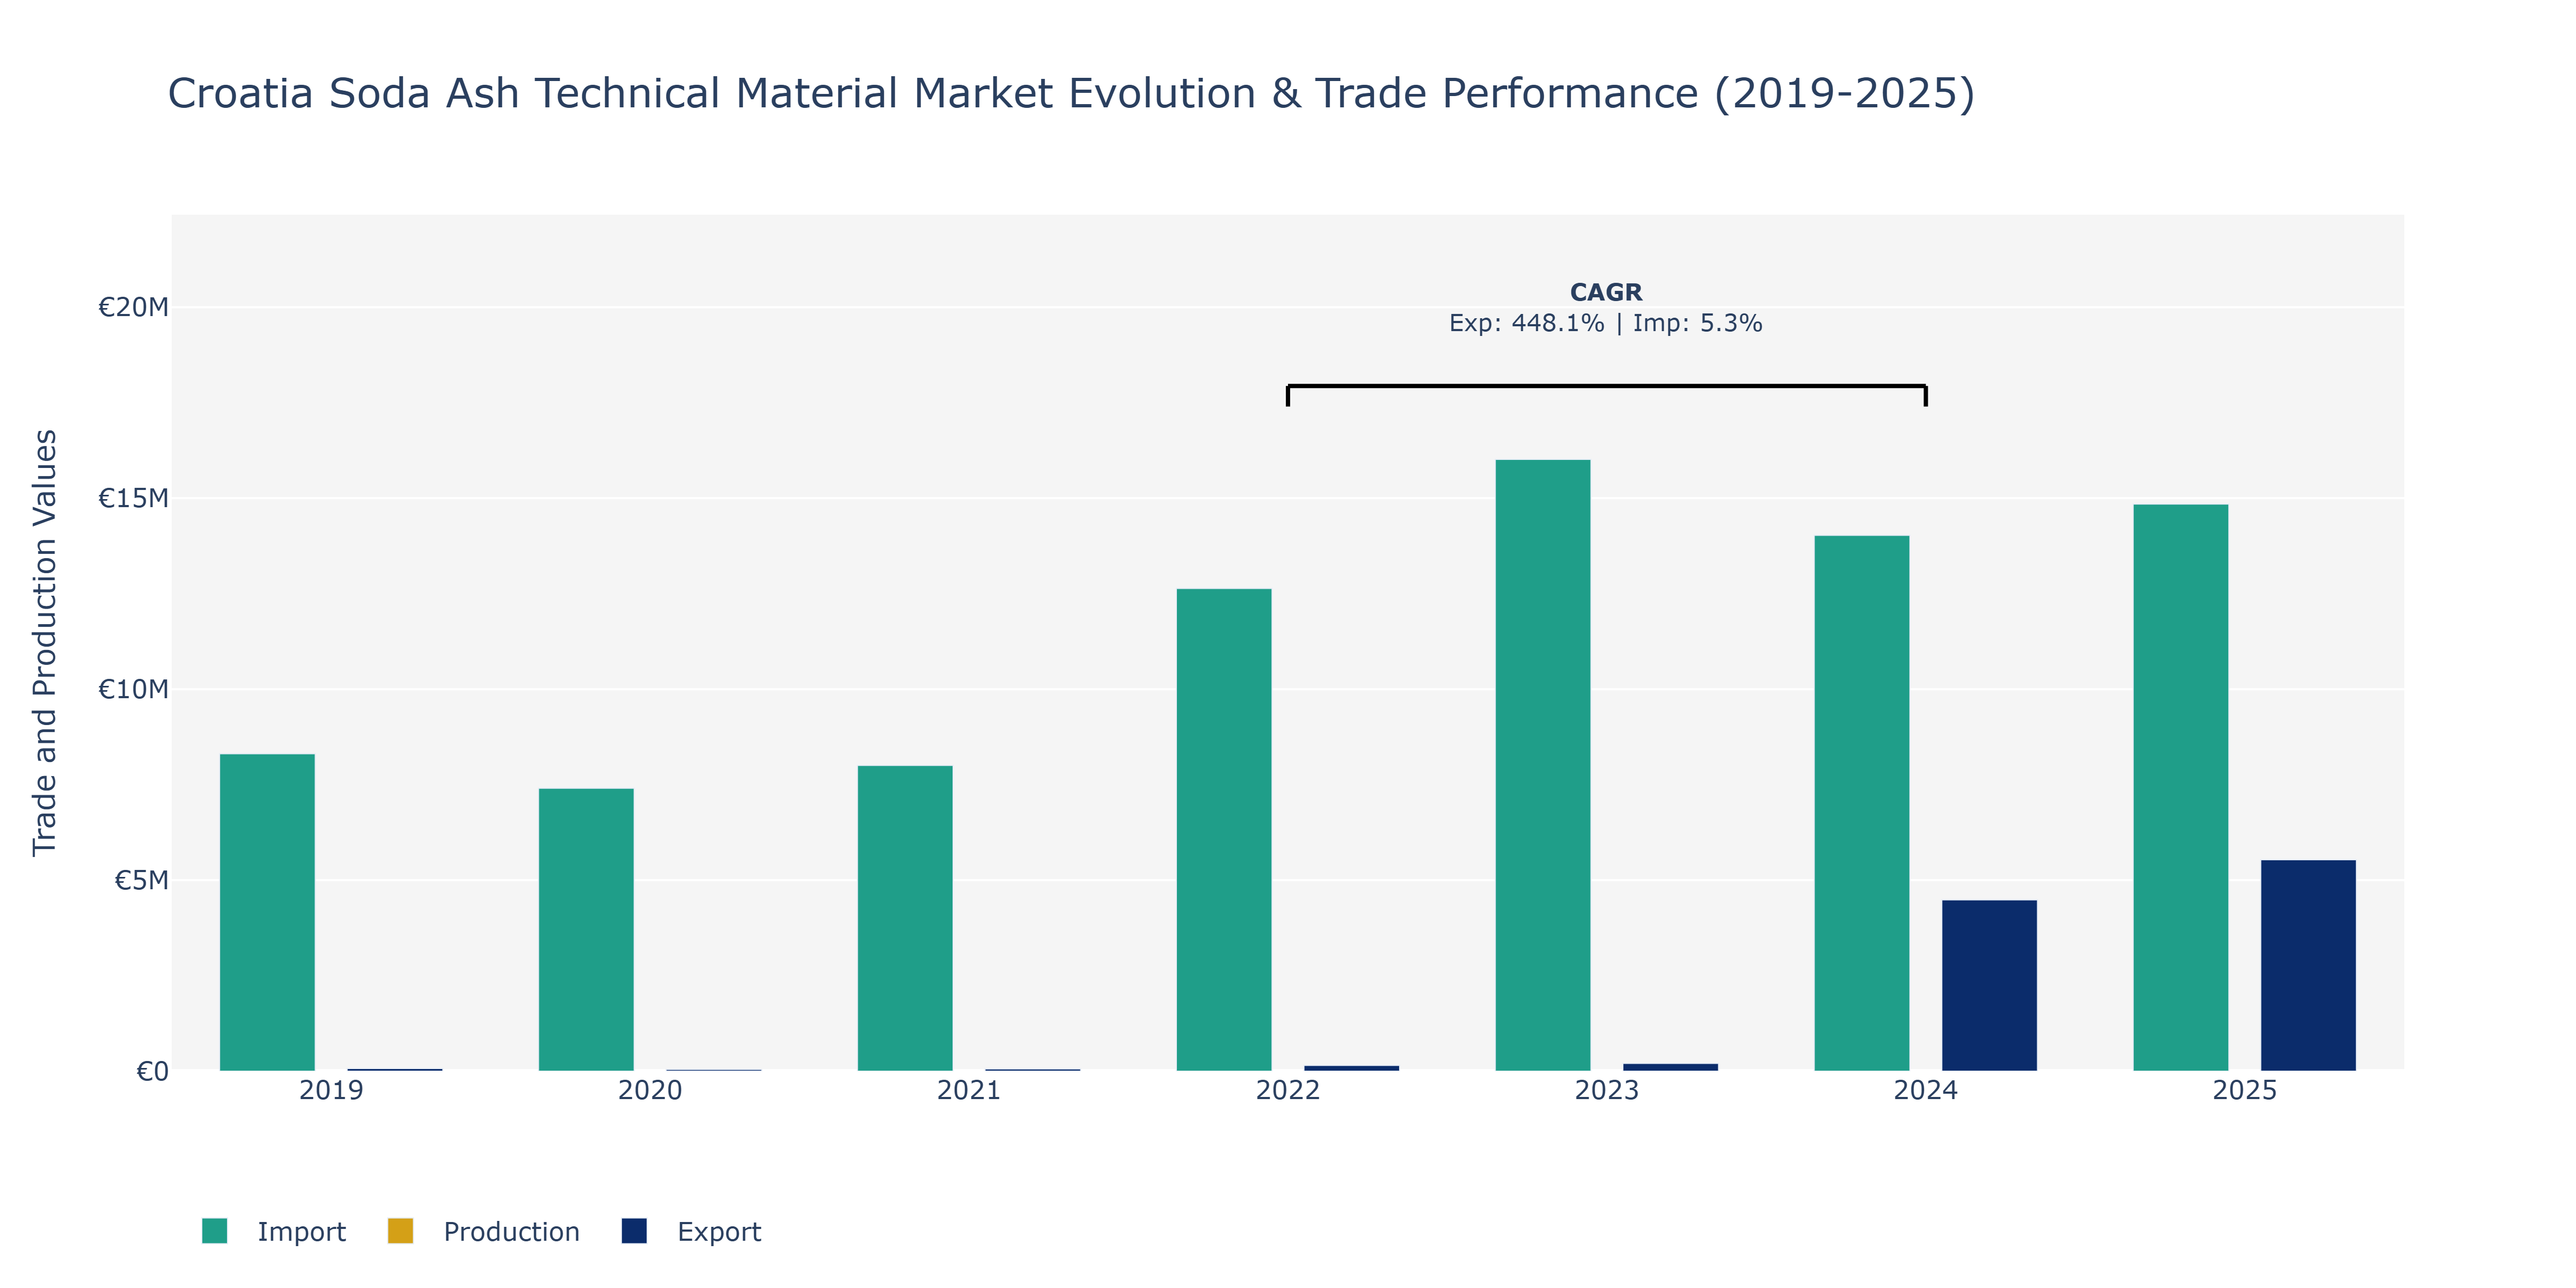
In the Croatia Soda Ash Technical Material Market, exports exhibited a notable surge from 2019 to 2025, starting at €71.82 thousand and sharply rising to €5.53 million in 2025. Conversely, imports fluctuated, peaking at €16.02 million in 2023 before falling to €14.85 million in 2025. Production displayed a steady growth trajectory, increasing from €135 million in 2019 to €265 million in 2020. The spike in exports can be attributed to increased global demand for soda ash, driven by its diverse applications in industries like glass manufacturing, chemicals, and detergents. The fluctuations in imports could be linked to changes in exchange rates and geopolitical factors affecting trade dynamics. The rise in production reflects Croatia's efforts to enhance domestic manufacturing capabilities to meet both local demand and bolster export competitiveness in the global market.
Key Highlights of the Report:
- Croatia Soda Ash Technical Material Market Outlook
- Market Size of Croatia Soda Ash Technical Material Market, 2025
- Forecast of Croatia Soda Ash Technical Material Market, 2032
- Historical Data and Forecast of Croatia Soda Ash Technical Material Revenues & Volume for the Period 2022 - 2032F
- Croatia Soda Ash Technical Material Market Trend Evolution
- Croatia Soda Ash Technical Material Market Drivers and Challenges
- Croatia Soda Ash Technical Material Price Trends
- Croatia Soda Ash Technical Material Porter's Five Forces
- Croatia Soda Ash Technical Material Industry Life Cycle
- Historical Data and Forecast of Croatia Soda Ash Technical Material Market Revenues & Volume By Type for the Period 2022 - 2032F
- Historical Data and Forecast of Croatia Soda Ash Technical Material Market Revenues & Volume By Dense Soda Ash for the Period 2022 - 2032F
- Historical Data and Forecast of Croatia Soda Ash Technical Material Market Revenues & Volume By Light Soda Ash for the Period 2022 - 2032F
- Historical Data and Forecast of Croatia Soda Ash Technical Material Market Revenues & Volume By Natural Soda Ash for the Period 2022 - 2032F
- Historical Data and Forecast of Croatia Soda Ash Technical Material Market Revenues & Volume By Synthetic Soda Ash for the Period 2022 - 2032F
- Historical Data and Forecast of Croatia Soda Ash Technical Material Market Revenues & Volume By Heavy Soda Ash for the Period 2022 - 2032F
- Historical Data and Forecast of Croatia Soda Ash Technical Material Market Revenues & Volume By Grade for the Period 2022 - 2032F
- Historical Data and Forecast of Croatia Soda Ash Technical Material Market Revenues & Volume By Industrial for the Period 2022 - 2032F
- Historical Data and Forecast of Croatia Soda Ash Technical Material Market Revenues & Volume By Food-Grade for the Period 2022 - 2032F
- Historical Data and Forecast of Croatia Soda Ash Technical Material Market Revenues & Volume By Pharmaceutical for the Period 2022 - 2032F
- Historical Data and Forecast of Croatia Soda Ash Technical Material Market Revenues & Volume By High-Purity for the Period 2022 - 2032F
- Historical Data and Forecast of Croatia Soda Ash Technical Material Market Revenues & Volume By Technical for the Period 2022 - 2032F
- Historical Data and Forecast of Croatia Soda Ash Technical Material Market Revenues & Volume By Application for the Period 2022 - 2032F
- Historical Data and Forecast of Croatia Soda Ash Technical Material Market Revenues & Volume By Glass Manufacturing for the Period 2022 - 2032F
- Historical Data and Forecast of Croatia Soda Ash Technical Material Market Revenues & Volume By Detergent Production for the Period 2022 - 2032F
- Historical Data and Forecast of Croatia Soda Ash Technical Material Market Revenues & Volume By Water Treatment for the Period 2022 - 2032F
- Historical Data and Forecast of Croatia Soda Ash Technical Material Market Revenues & Volume By Textile Processing for the Period 2022 - 2032F
- Historical Data and Forecast of Croatia Soda Ash Technical Material Market Revenues & Volume By Chemical Processing for the Period 2022 - 2032F
- Historical Data and Forecast of Croatia Soda Ash Technical Material Market Revenues & Volume By Manufacturing Process for the Period 2022 - 2032F
- Historical Data and Forecast of Croatia Soda Ash Technical Material Market Revenues & Volume By Solvay Process for the Period 2022 - 2032F
- Historical Data and Forecast of Croatia Soda Ash Technical Material Market Revenues & Volume By Leblanc Process for the Period 2022 - 2032F
- Historical Data and Forecast of Croatia Soda Ash Technical Material Market Revenues & Volume By Trona Mining for the Period 2022 - 2032F
- Historical Data and Forecast of Croatia Soda Ash Technical Material Market Revenues & Volume By Carbonation for the Period 2022 - 2032F
- Historical Data and Forecast of Croatia Soda Ash Technical Material Market Revenues & Volume By Brine Purification for the Period 2022 - 2032F
- Historical Data and Forecast of Croatia Soda Ash Technical Material Market Revenues & Volume By End User for the Period 2022 - 2032F
- Historical Data and Forecast of Croatia Soda Ash Technical Material Market Revenues & Volume By Glass & Ceramics for the Period 2022 - 2032F
- Historical Data and Forecast of Croatia Soda Ash Technical Material Market Revenues & Volume By Soaps & Detergents for the Period 2022 - 2032F
- Historical Data and Forecast of Croatia Soda Ash Technical Material Market Revenues & Volume By Pharmaceuticals for the Period 2022 - 2032F
- Historical Data and Forecast of Croatia Soda Ash Technical Material Market Revenues & Volume By Textile & Dyes for the Period 2022 - 2032F
- Historical Data and Forecast of Croatia Soda Ash Technical Material Market Revenues & Volume By Pulp & Paper for the Period 2022 - 2032F
- Croatia Soda Ash Technical Material Import Export Trade Statistics
- Market Opportunity Assessment By Type
- Market Opportunity Assessment By Grade
- Market Opportunity Assessment By Application
- Market Opportunity Assessment By Manufacturing Process
- Market Opportunity Assessment By End User
- Croatia Soda Ash Technical Material Top Companies Market Share
- Croatia Soda Ash Technical Material Competitive Benchmarking By Technical and Operational Parameters
- Croatia Soda Ash Technical Material Company Profiles
- Croatia Soda Ash Technical Material Key Strategic Recommendations
Frequently Asked Questions About the Market Study (FAQs):
6Wresearch actively monitors the Croatia Soda Ash Technical Material Market and publishes its comprehensive annual report, highlighting emerging trends, growth drivers, revenue analysis, and forecast outlook. Our insights help businesses to make data-backed strategic decisions with ongoing market dynamics. Our analysts track relevent industries related to the Croatia Soda Ash Technical Material Market, allowing our clients with actionable intelligence and reliable forecasts tailored to emerging regional needs.
Yes, we provide customisation as per your requirements. To learn more, feel free to contact us on sales@6wresearch.com
1 Executive Summary |
2 Introduction |
2.1 Key Highlights of the Report |
2.2 Report Description |
2.3 Market Scope & Segmentation |
2.4 Research Methodology |
2.5 Assumptions |
3 Croatia Soda Ash Technical Material Market Overview |
3.1 Croatia Country Macro Economic Indicators |
3.2 Croatia Soda Ash Technical Material Market Revenues & Volume, 2022 & 2032F |
3.3 Croatia Soda Ash Technical Material Market - Industry Life Cycle |
3.4 Croatia Soda Ash Technical Material Market - Porter's Five Forces |
3.5 Croatia Soda Ash Technical Material Market Revenues & Volume Share, By Type, 2022 & 2032F |
3.6 Croatia Soda Ash Technical Material Market Revenues & Volume Share, By Grade, 2022 & 2032F |
3.7 Croatia Soda Ash Technical Material Market Revenues & Volume Share, By Application, 2022 & 2032F |
3.8 Croatia Soda Ash Technical Material Market Revenues & Volume Share, By Manufacturing Process, 2022 & 2032F |
3.9 Croatia Soda Ash Technical Material Market Revenues & Volume Share, By End User, 2022 & 2032F |
4 Croatia Soda Ash Technical Material Market Dynamics |
4.1 Impact Analysis |
4.2 Market Drivers |
4.2.1 Increasing demand for glass production in Croatia |
4.2.2 Growth in the chemical industry in the region |
4.2.3 Rising usage of soda ash in water treatment applications |
4.3 Market Restraints |
4.3.1 Fluctuating prices of raw materials impacting production costs |
4.3.2 Environmental regulations affecting soda ash production |
4.3.3 Competition from alternative chemicals in certain applications |
5 Croatia Soda Ash Technical Material Market Trends |
6 Croatia Soda Ash Technical Material Market, By Types |
6.1 Croatia Soda Ash Technical Material Market, By Type |
6.1.1 Overview and Analysis |
6.1.2 Croatia Soda Ash Technical Material Market Revenues & Volume, By Type, 2022 - 2032F |
6.1.3 Croatia Soda Ash Technical Material Market Revenues & Volume, By Dense Soda Ash, 2022 - 2032F |
6.1.4 Croatia Soda Ash Technical Material Market Revenues & Volume, By Light Soda Ash, 2022 - 2032F |
6.1.5 Croatia Soda Ash Technical Material Market Revenues & Volume, By Natural Soda Ash, 2022 - 2032F |
6.1.6 Croatia Soda Ash Technical Material Market Revenues & Volume, By Synthetic Soda Ash, 2022 - 2032F |
6.1.7 Croatia Soda Ash Technical Material Market Revenues & Volume, By Heavy Soda Ash, 2022 - 2032F |
6.2 Croatia Soda Ash Technical Material Market, By Grade |
6.2.1 Overview and Analysis |
6.2.2 Croatia Soda Ash Technical Material Market Revenues & Volume, By Industrial, 2022 - 2032F |
6.2.3 Croatia Soda Ash Technical Material Market Revenues & Volume, By Food-Grade, 2022 - 2032F |
6.2.4 Croatia Soda Ash Technical Material Market Revenues & Volume, By Pharmaceutical, 2022 - 2032F |
6.2.5 Croatia Soda Ash Technical Material Market Revenues & Volume, By High-Purity, 2022 - 2032F |
6.2.6 Croatia Soda Ash Technical Material Market Revenues & Volume, By Technical, 2022 - 2032F |
6.3 Croatia Soda Ash Technical Material Market, By Application |
6.3.1 Overview and Analysis |
6.3.2 Croatia Soda Ash Technical Material Market Revenues & Volume, By Glass Manufacturing, 2022 - 2032F |
6.3.3 Croatia Soda Ash Technical Material Market Revenues & Volume, By Detergent Production, 2022 - 2032F |
6.3.4 Croatia Soda Ash Technical Material Market Revenues & Volume, By Water Treatment, 2022 - 2032F |
6.3.5 Croatia Soda Ash Technical Material Market Revenues & Volume, By Textile Processing, 2022 - 2032F |
6.3.6 Croatia Soda Ash Technical Material Market Revenues & Volume, By Chemical Processing, 2022 - 2032F |
6.4 Croatia Soda Ash Technical Material Market, By Manufacturing Process |
6.4.1 Overview and Analysis |
6.4.2 Croatia Soda Ash Technical Material Market Revenues & Volume, By Solvay Process, 2022 - 2032F |
6.4.3 Croatia Soda Ash Technical Material Market Revenues & Volume, By Leblanc Process, 2022 - 2032F |
6.4.4 Croatia Soda Ash Technical Material Market Revenues & Volume, By Trona Mining, 2022 - 2032F |
6.4.5 Croatia Soda Ash Technical Material Market Revenues & Volume, By Carbonation, 2022 - 2032F |
6.4.6 Croatia Soda Ash Technical Material Market Revenues & Volume, By Brine Purification, 2022 - 2032F |
6.5 Croatia Soda Ash Technical Material Market, By End User |
6.5.1 Overview and Analysis |
6.5.2 Croatia Soda Ash Technical Material Market Revenues & Volume, By Glass & Ceramics, 2022 - 2032F |
6.5.3 Croatia Soda Ash Technical Material Market Revenues & Volume, By Soaps & Detergents, 2022 - 2032F |
6.5.4 Croatia Soda Ash Technical Material Market Revenues & Volume, By Pharmaceuticals, 2022 - 2032F |
6.5.5 Croatia Soda Ash Technical Material Market Revenues & Volume, By Textile & Dyes, 2022 - 2032F |
6.5.6 Croatia Soda Ash Technical Material Market Revenues & Volume, By Pulp & Paper, 2022 - 2032F |
7 Croatia Soda Ash Technical Material Market Import-Export Trade Statistics |
7.1 Croatia Soda Ash Technical Material Market Export to Major Countries |
7.2 Croatia Soda Ash Technical Material Market Imports from Major Countries |
8 Croatia Soda Ash Technical Material Market Key Performance Indicators |
8.1 Average selling price of soda ash in Croatia |
8.2 Capacity utilization rate of soda ash manufacturers |
8.3 Number of new applications or sectors adopting soda ash technology |
9 Croatia Soda Ash Technical Material Market - Opportunity Assessment |
9.1 Croatia Soda Ash Technical Material Market Opportunity Assessment, By Type, 2022 & 2032F |
9.2 Croatia Soda Ash Technical Material Market Opportunity Assessment, By Grade, 2022 & 2032F |
9.3 Croatia Soda Ash Technical Material Market Opportunity Assessment, By Application, 2022 & 2032F |
9.4 Croatia Soda Ash Technical Material Market Opportunity Assessment, By Manufacturing Process, 2022 & 2032F |
9.5 Croatia Soda Ash Technical Material Market Opportunity Assessment, By End User, 2022 & 2032F |
10 Croatia Soda Ash Technical Material Market - Competitive Landscape |
10.1 Croatia Soda Ash Technical Material Market Revenue Share, By Companies, 2025 |
10.2 Croatia Soda Ash Technical Material Market Competitive Benchmarking, By Operating and Technical Parameters |
11 Company Profiles |
12 Recommendations |
13 Disclaimer |
Global Go To Market Strategy - 2030
Export potential enables firms to identify high-growth global markets with greater confidence by combining advanced trade intelligence with a structured quantitative methodology. The framework analyzes emerging demand trends and country-level import patterns while integrating macroeconomic and trade datasets such as GDP and population forecasts, bilateral import–export flows, tariff structures, elasticity differentials between developed and developing economies, geographic distance, and import demand projections. Using weighted trade values from 2020–2024 as the base period to project country-to-country export potential for 2030, these inputs are operationalized through calculated drivers such as gravity model parameters, tariff impact factors, and projected GDP per-capita growth. Through an analysis of hidden potentials, demand hotspots, and market conditions that are most favorable to success, this method enables firms to focus on target countries, maximize returns, and global expansion with data, backed by accuracy.
By factoring in the projected importer demand gap that is currently unmet and could be potential opportunity, it identifies the potential for the Exporter (Country) among 190 countries, against the general trade analysis, which identifies the biggest importer or exporter.
To discover high-growth global markets and optimize your business strategy:
Click Here
Pricing
- Single User License$ 1,995
- Department License$ 2,400
- Site License$ 3,120
- Global License$ 3,795

Leadership Perspectives from Industry Events
Search
Thought Leadership and Analyst Meet


Our Clients
6WResearch In News
- Doha a strategic location for EV manufacturing hub: IPA Qatar
- Demand for luxury TVs surging in the GCC, says Samsung
- Empowering Growth: The Thriving Journey of Bangladesh’s Cable Industry
- Demand for luxury TVs surging in the GCC, says Samsung
- Video call with a traditional healer? Once unthinkable, it’s now common in South Africa
- Intelligent Buildings To Smooth GCC’s Path To Net Zero
Latest Reports
- New Zealand Aseptic Manufacturing Market (2026-2032)
- Netherlands Aseptic Manufacturing Market (2026-2032)
- Nauru Aseptic Manufacturing Market (2026-2032)
- Namibia Aseptic Manufacturing Market (2026-2032)
- Mozambique Aseptic Manufacturing Market (2026-2032)
- Montenegro Aseptic Manufacturing Market (2026-2032)
- Mongolia Aseptic Manufacturing Market (2026-2032)
- Monaco Aseptic Manufacturing Market (2026-2032)
- Micronesia Aseptic Manufacturing Market (2026-2032)
- Mauritius Aseptic Manufacturing Market (2026-2032)
Industry Events and Analyst Meet

HIMTEX 2026

India Refining Summit 2026

India EV Show 2026

EV tech India Expo 2026

Auto Tech Asia 2026
Whitepaper
- Middle East & Africa Commercial Security Market Click here to view more.
- Middle East & Africa Fire Safety Systems & Equipment Market Click here to view more.
- GCC Drone Market Click here to view more.
- Middle East Lighting Fixture Market Click here to view more.
- GCC Physical & Perimeter Security Market Click here to view more.