Croatia Sodium Phosphate Market (2026-2032) | Share, Analysis, Value, Companies, Revenue, Forecast, Outlook, Growth, Size, Segmentation, Industry & Trends
Market Forecast By Distribution Channel (Online Retailing, Offline Retailing), By Application (Leavening & Emulsifying Agent, Processed Food Stabilizing, pH Balance & Saline Laxatives, Other), By End-Use (Food & Beverage Industry, Medical & Pharmaceutical, Personal Care & Water Treatment, Others) And Competitive Landscape
| Product Code: ETC4860241 | Publication Date: Nov 2023 | Updated Date: Apr 2026 | Product Type: Market Research Report | |
| Publisher: 6Wresearch | Author: Shubham Padhi | No. of Pages: 60 | No. of Figures: 30 | No. of Tables: 5 |
Croatia Sodium Phosphate Market Size (2020-2030)
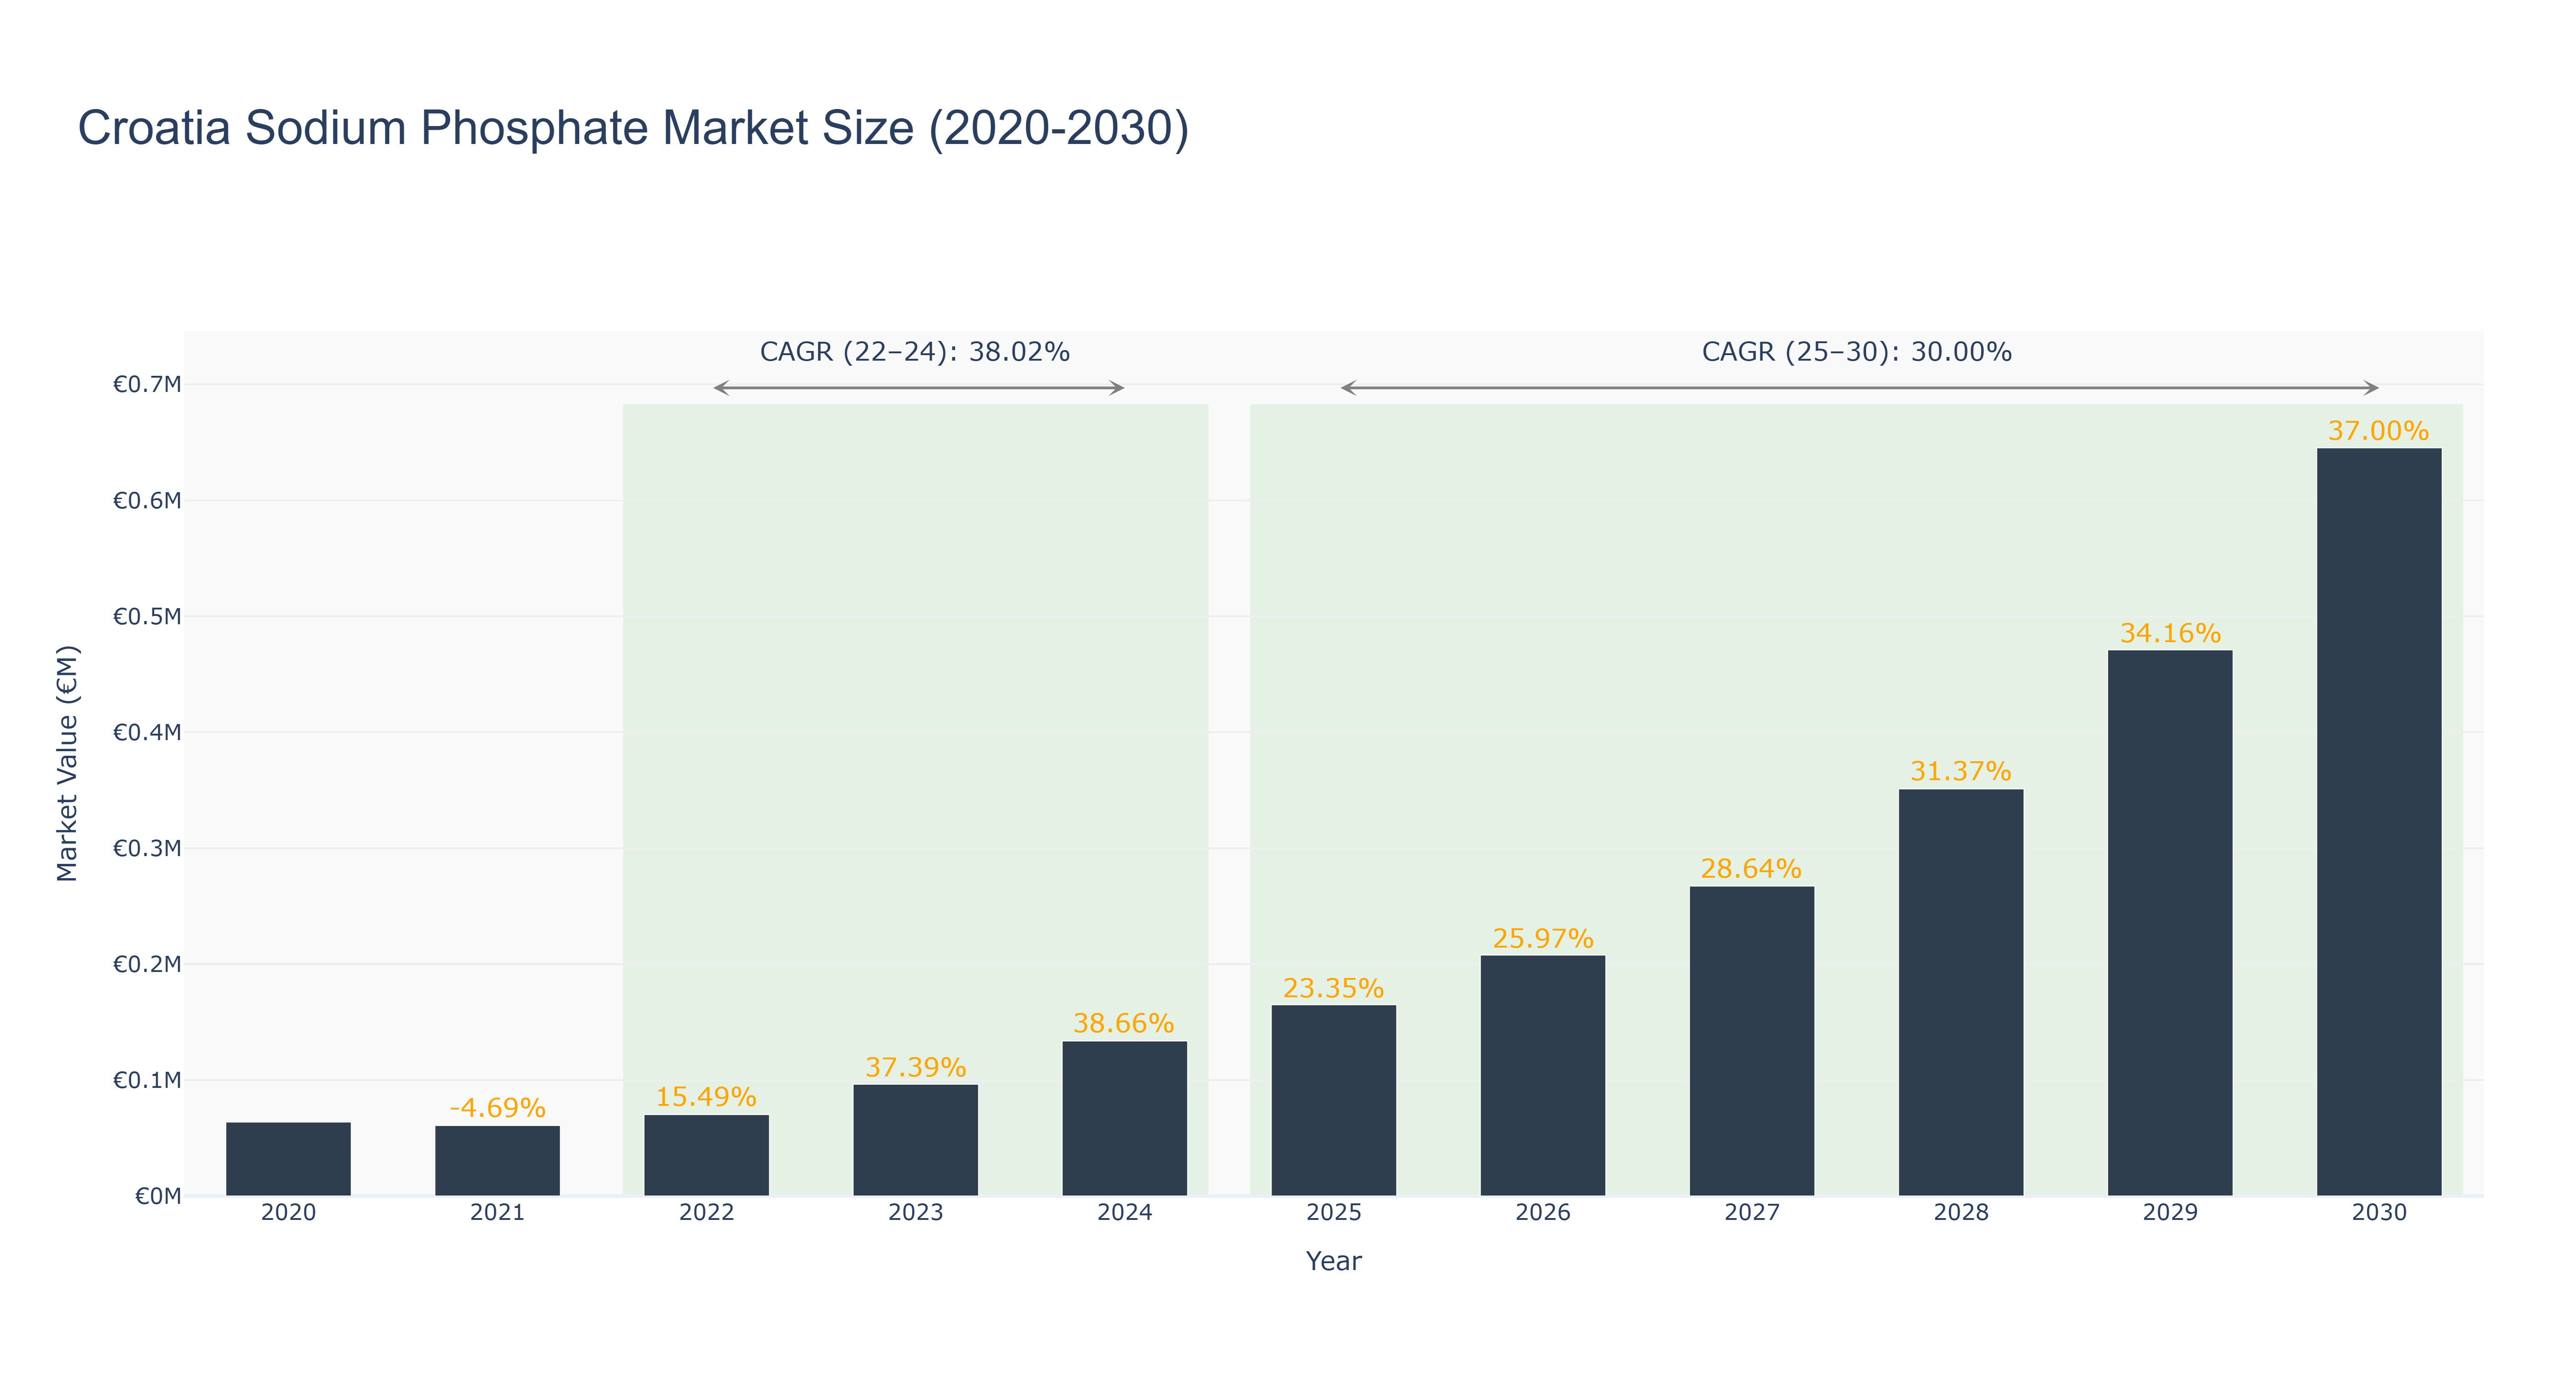
The Croatia Sodium Phosphate Market has shown a significant growth trend over the past decade. The peak market size of €0.65 million was achieved in 2030, with a consistent increase in market size from €0.06 million in 2020 to €0.65 million in 2030. The CAGR for the period 2022-24 was 38.02%, reflecting a strong growth phase, while the CAGR for 2025-30 is projected at 30.0%. The market experienced a notable spike in growth from 2023 onwards, driven by increasing demand for sodium phosphate in various industries such as food processing and pharmaceuticals. Looking ahead, recent developments in Croatia indicate upcoming investments in infrastructure to support the growth of the chemical industry, which is expected to further boost the sodium phosphate market in the country.
Croatia Sodium Phosphate Market: Production & Trade Performance (2019-2025)
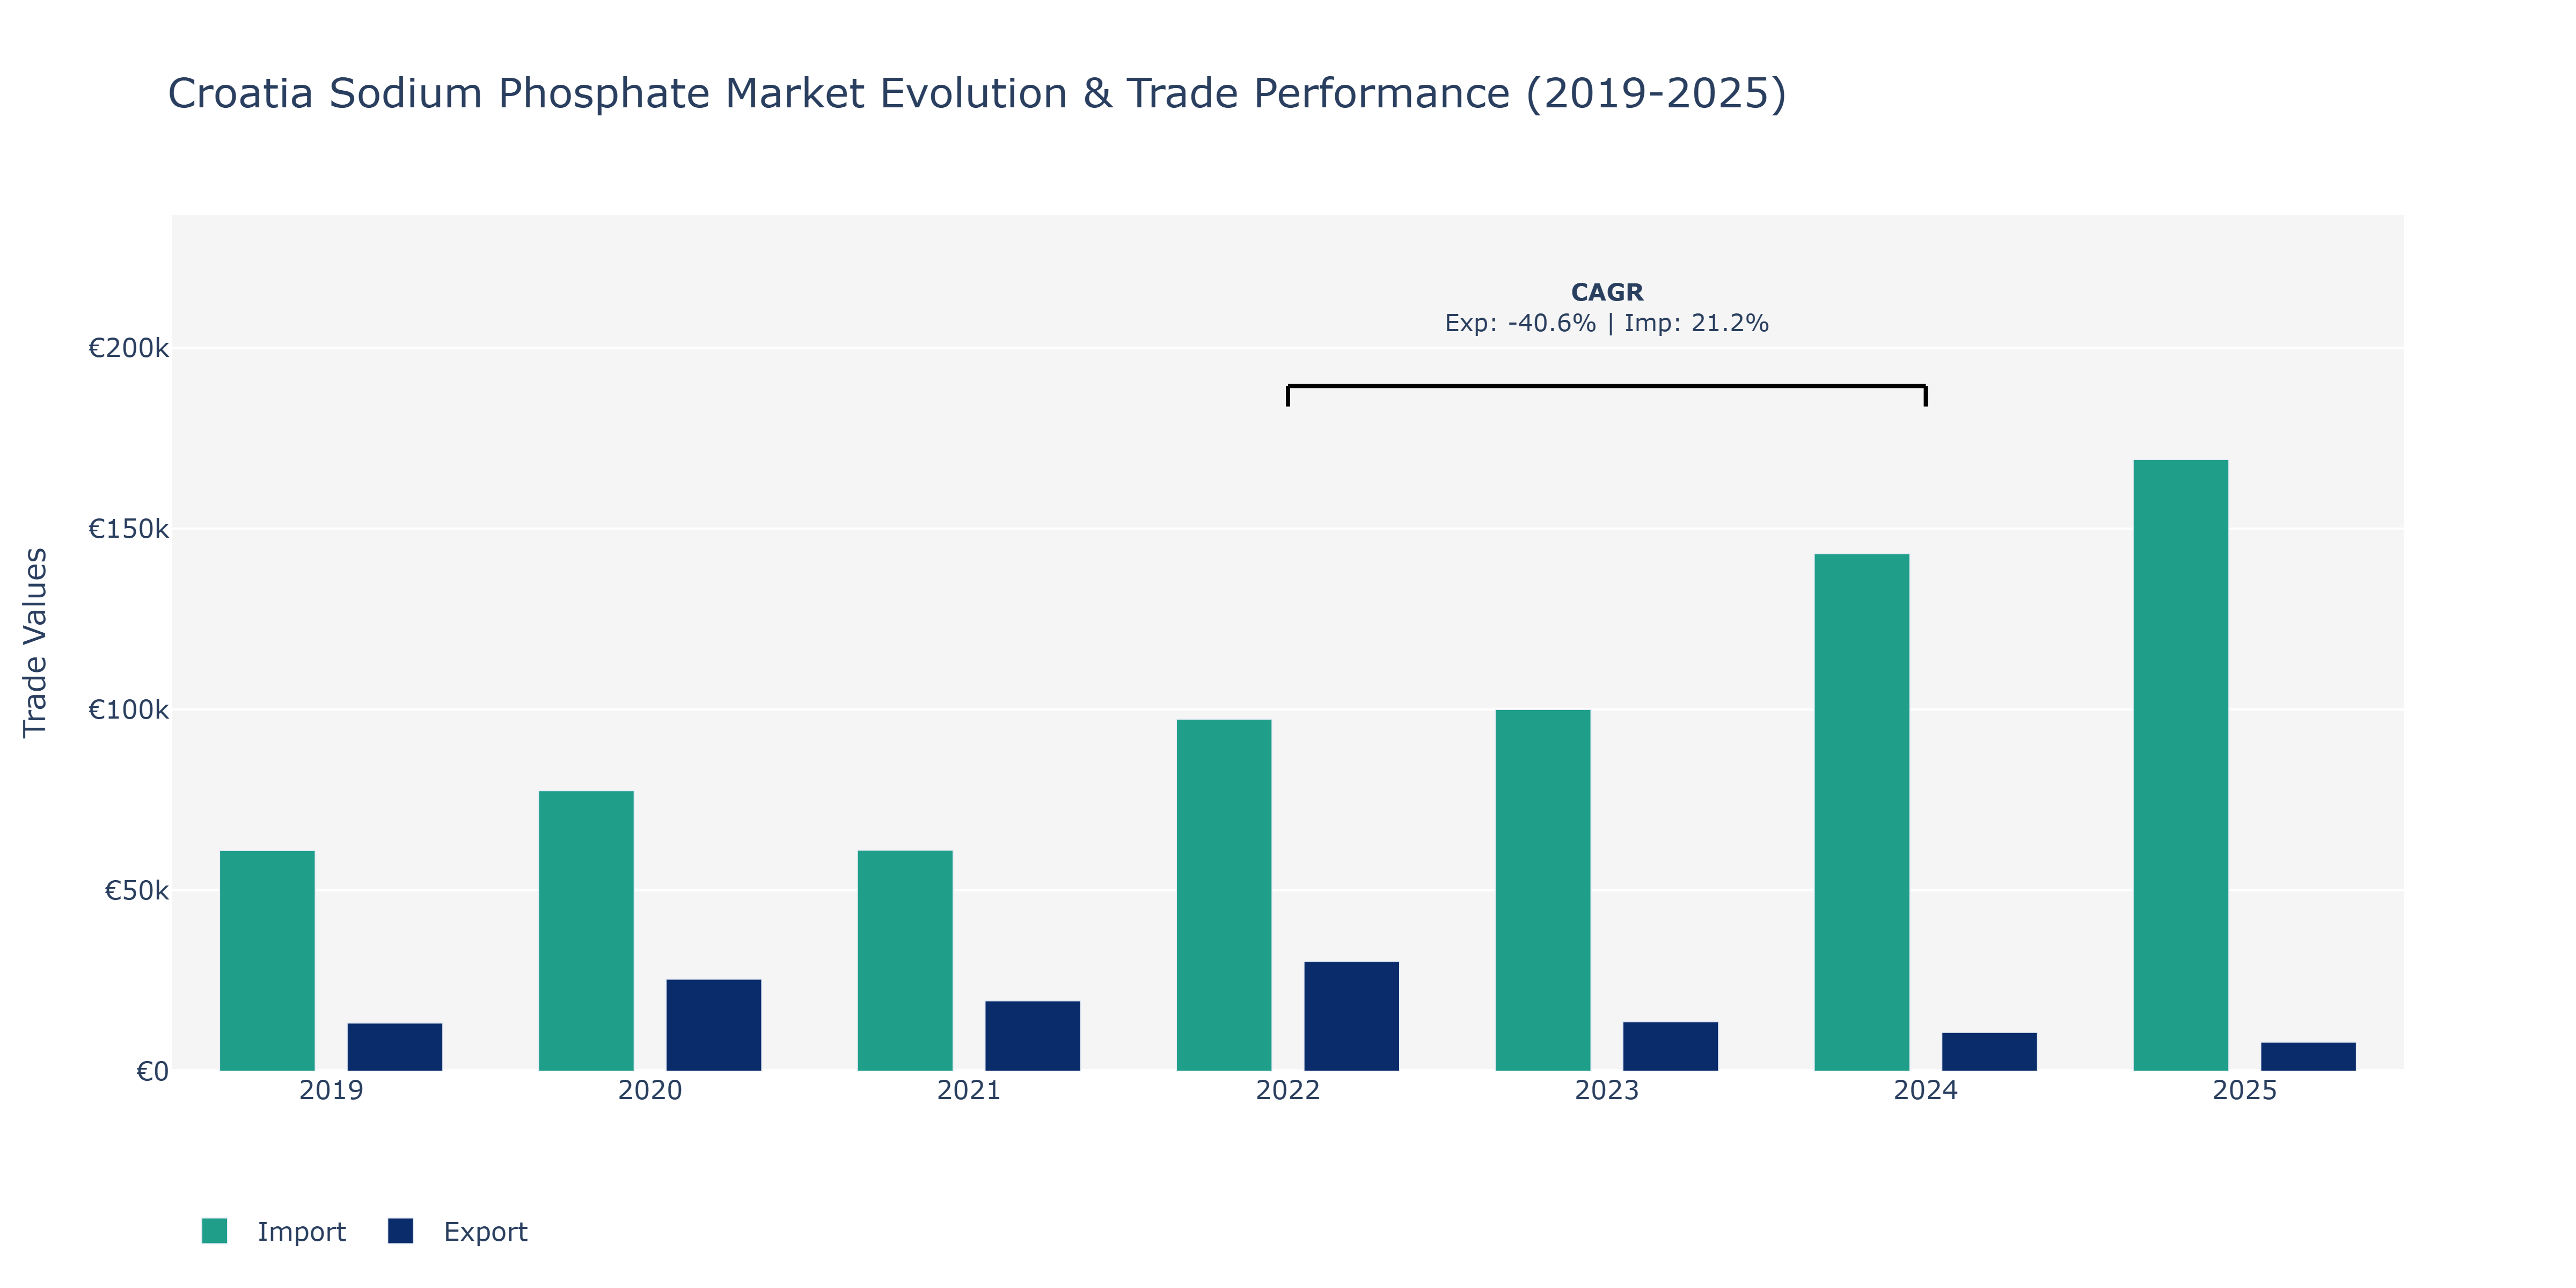
Between 2019 and 2025, Croatia's Sodium Phosphate Market witnessed varying trends in exports and imports. In 2022, exports notably peaked at €30.37 thousand, only to sharply decline in the following years. Conversely, imports steadily increased from €61.0 thousand in 2019 to €169.16 thousand in 2025, reflecting a growing demand for sodium phosphate in Croatia. The surge in imports can be attributed to the country's expanding industrial sector, particularly in food processing, where sodium phosphate is a key additive. The fluctuating Export value may be influenced by global market dynamics and shifting trade patterns. Despite the fluctuations, the consistent rise in imports underscores Croatia's reliance on foreign sources for sodium phosphate, indicating opportunities for domestic production expansion to reduce import dependency and enhance market stability.
Key Highlights of the Report:
- Croatia Sodium Phosphate Market Outlook
- Market Size of Croatia Sodium Phosphate Market, 2025
- Forecast of Croatia Sodium Phosphate Market, 2032
- Historical Data and Forecast of Croatia Sodium Phosphate Revenues & Volume for the Period 2022 - 2032F
- Croatia Sodium Phosphate Market Trend Evolution
- Croatia Sodium Phosphate Market Drivers and Challenges
- Croatia Sodium Phosphate Price Trends
- Croatia Sodium Phosphate Porter`s Five Forces
- Croatia Sodium Phosphate Industry Life Cycle
- Historical Data and Forecast of Croatia Sodium Phosphate Market Revenues & Volume By Distribution Channel for the Period 2022 - 2032F
- Historical Data and Forecast of Croatia Sodium Phosphate Market Revenues & Volume By Online Retailing for the Period 2022 - 2032F
- Historical Data and Forecast of Croatia Sodium Phosphate Market Revenues & Volume By Offline Retailing for the Period 2022 - 2032F
- Historical Data and Forecast of Croatia Sodium Phosphate Market Revenues & Volume By Application for the Period 2022 - 2032F
- Historical Data and Forecast of Croatia Sodium Phosphate Market Revenues & Volume By Leavening & Emulsifying Agent for the Period 2022 - 2032F
- Historical Data and Forecast of Croatia Sodium Phosphate Market Revenues & Volume By Processed Food Stabilizing for the Period 2022 - 2032F
- Historical Data and Forecast of Croatia Sodium Phosphate Market Revenues & Volume By pH Balance & Saline Laxatives for the Period 2022 - 2032F
- Historical Data and Forecast of Croatia Sodium Phosphate Market Revenues & Volume By Other for the Period 2022 - 2032F
- Historical Data and Forecast of Croatia Sodium Phosphate Market Revenues & Volume By End-Use for the Period 2022 - 2032F
- Historical Data and Forecast of Croatia Sodium Phosphate Market Revenues & Volume By Food & Beverage Industry for the Period 2022 - 2032F
- Historical Data and Forecast of Croatia Sodium Phosphate Market Revenues & Volume By Medical & Pharmaceutical for the Period 2022 - 2032F
- Historical Data and Forecast of Croatia Sodium Phosphate Market Revenues & Volume By Personal Care & Water Treatment for the Period 2022 - 2032F
- Historical Data and Forecast of Croatia Sodium Phosphate Market Revenues & Volume By Others for the Period 2022 - 2032F
- Croatia Sodium Phosphate Import Export Trade Statistics
- Market Opportunity Assessment By Distribution Channel
- Market Opportunity Assessment By Application
- Market Opportunity Assessment By End-Use
- Croatia Sodium Phosphate Top Companies Market Share
- Croatia Sodium Phosphate Competitive Benchmarking By Technical and Operational Parameters
- Croatia Sodium Phosphate Company Profiles
- Croatia Sodium Phosphate Key Strategic Recommendations
Frequently Asked Questions About the Market Study (FAQs):
6Wresearch actively monitors the Croatia Sodium Phosphate Market and publishes its comprehensive annual report, highlighting emerging trends, growth drivers, revenue analysis, and forecast outlook. Our insights help businesses to make data-backed strategic decisions with ongoing market dynamics. Our analysts track relevent industries related to the Croatia Sodium Phosphate Market, allowing our clients with actionable intelligence and reliable forecasts tailored to emerging regional needs.
Yes, we provide customisation as per your requirements. To learn more, feel free to contact us on sales@6wresearch.com
1 Executive Summary |
2 Introduction |
2.1 Key Highlights of the Report |
2.2 Report Description |
2.3 Market Scope & Segmentation |
2.4 Research Methodology |
2.5 Assumptions |
3 Croatia Sodium Phosphate Market Overview |
3.1 Croatia Country Macro Economic Indicators |
3.2 Croatia Sodium Phosphate Market Revenues & Volume, 2022 & 2032F |
3.3 Croatia Sodium Phosphate Market - Industry Life Cycle |
3.4 Croatia Sodium Phosphate Market - Porter's Five Forces |
3.5 Croatia Sodium Phosphate Market Revenues & Volume Share, By Distribution Channel, 2022 & 2032F |
3.6 Croatia Sodium Phosphate Market Revenues & Volume Share, By Application, 2022 & 2032F |
3.7 Croatia Sodium Phosphate Market Revenues & Volume Share, By End-Use, 2022 & 2032F |
4 Croatia Sodium Phosphate Market Dynamics |
4.1 Impact Analysis |
4.2 Market Drivers |
4.2.1 Increasing demand for processed food products which use sodium phosphate as a food additive |
4.2.2 Growing adoption of sodium phosphate in pharmaceuticals for various applications |
4.2.3 Rising awareness about the benefits of sodium phosphate in water treatment processes |
4.3 Market Restraints |
4.3.1 Stringent regulations and guidelines regarding the permissible limits of sodium phosphate in food and pharmaceutical products |
4.3.2 Fluctuating prices of raw materials used in the production of sodium phosphate |
4.3.3 Concerns over the environmental impact of the disposal of sodium phosphate waste |
5 Croatia Sodium Phosphate Market Trends |
6 Croatia Sodium Phosphate Market Segmentations |
6.1 Croatia Sodium Phosphate Market, By Distribution Channel |
6.1.1 Overview and Analysis |
6.1.2 Croatia Sodium Phosphate Market Revenues & Volume, By Online Retailing, 2022 - 2032F |
6.1.3 Croatia Sodium Phosphate Market Revenues & Volume, By Offline Retailing, 2022 - 2032F |
6.2 Croatia Sodium Phosphate Market, By Application |
6.2.1 Overview and Analysis |
6.2.2 Croatia Sodium Phosphate Market Revenues & Volume, By Leavening & Emulsifying Agent, 2022 - 2032F |
6.2.3 Croatia Sodium Phosphate Market Revenues & Volume, By Processed Food Stabilizing, 2022 - 2032F |
6.2.4 Croatia Sodium Phosphate Market Revenues & Volume, By pH Balance & Saline Laxatives, 2022 - 2032F |
6.2.5 Croatia Sodium Phosphate Market Revenues & Volume, By Other, 2022 - 2032F |
6.3 Croatia Sodium Phosphate Market, By End-Use |
6.3.1 Overview and Analysis |
6.3.2 Croatia Sodium Phosphate Market Revenues & Volume, By Food & Beverage Industry, 2022 - 2032F |
6.3.3 Croatia Sodium Phosphate Market Revenues & Volume, By Medical & Pharmaceutical, 2022 - 2032F |
6.3.4 Croatia Sodium Phosphate Market Revenues & Volume, By Personal Care & Water Treatment, 2022 - 2032F |
6.3.5 Croatia Sodium Phosphate Market Revenues & Volume, By Others, 2022 - 2032F |
7 Croatia Sodium Phosphate Market Import-Export Trade Statistics |
7.1 Croatia Sodium Phosphate Market Export to Major Countries |
7.2 Croatia Sodium Phosphate Market Imports from Major Countries |
8 Croatia Sodium Phosphate Market Key Performance Indicators |
8.1 Number of new product launches containing sodium phosphate in the food and pharmaceutical industries |
8.2 Investment in research and development for innovative applications of sodium phosphate |
8.3 Adoption rate of sodium phosphate in water treatment plants and processes |
9 Croatia Sodium Phosphate Market - Opportunity Assessment |
9.1 Croatia Sodium Phosphate Market Opportunity Assessment, By Distribution Channel, 2022 & 2032F |
9.2 Croatia Sodium Phosphate Market Opportunity Assessment, By Application, 2022 & 2032F |
9.3 Croatia Sodium Phosphate Market Opportunity Assessment, By End-Use, 2022 & 2032F |
10 Croatia Sodium Phosphate Market - Competitive Landscape |
10.1 Croatia Sodium Phosphate Market Revenue Share, By Companies, 2025 |
10.2 Croatia Sodium Phosphate Market Competitive Benchmarking, By Operating and Technical Parameters |
11 Company Profiles |
12 Recommendations | 13 Disclaimer |
Export potential assessment - trade Analytics for 2030
Export potential enables firms to identify high-growth global markets with greater confidence by combining advanced trade intelligence with a structured quantitative methodology. The framework analyzes emerging demand trends and country-level import patterns while integrating macroeconomic and trade datasets such as GDP and population forecasts, bilateral import–export flows, tariff structures, elasticity differentials between developed and developing economies, geographic distance, and import demand projections. Using weighted trade values from 2020–2024 as the base period to project country-to-country export potential for 2030, these inputs are operationalized through calculated drivers such as gravity model parameters, tariff impact factors, and projected GDP per-capita growth. Through an analysis of hidden potentials, demand hotspots, and market conditions that are most favorable to success, this method enables firms to focus on target countries, maximize returns, and global expansion with data, backed by accuracy.
By factoring in the projected importer demand gap that is currently unmet and could be potential opportunity, it identifies the potential for the Exporter (Country) among 190 countries, against the general trade analysis, which identifies the biggest importer or exporter.
To discover high-growth global markets and optimize your business strategy:
Click Here
Pricing
- Single User License$ 1,995
- Department License$ 2,400
- Site License$ 3,120
- Global License$ 3,795

Search
Thought Leadership and Analyst Meet


Our Clients
Latest Reports
- Canada Cloud CFD Market (2026-2032) | Size & Revenue, Industry, Growth, Competitive Landscape, Forecast, Segmentation, Value, Outlook, Trends, Share, Analysis, Companies
- Taiwan Food Delivery Platform Market (2026-2032) | Companies, Outlook, Analysis, Trends, Value, Revenue, Segmentation, Share, Forecast, Competitive Landscape, Growth, Size & Forecast
- United Kingdom (UK) Long-term Care Insurance Market (2026-2032) | Growth, Share, Consumer Insights, Drivers, Opportunities, Competition, Pricing Analysis, Segments, Restraints, Companies, Competitive, Value, Outlook, Size, Demand, Analysis, Challenges, Strategic Insights, Investment Trends, Revenue, Trends, Supply, Forecast
- United Kingdom (UK) Long Term Care Market (2026-2032) | Companies, Outlook, Analysis, Trends, Value, Revenue, Segmentation, Share, Forecast, Competitive Landscape, Growth, Size & Forecast
- Iraq Insulation and Waterproofing Market (2026-2032) | Outlook, Drivers, Growth, Size, Share, Industry, Revenue, Trends, Demand, Competitive, Strategic Insights, Opportunities, Segments, Companies, Challenges, Strategy, Consumer Insights, Analysis, Investment Trends, Value, Segmentation, Forecast, Restraints
- India Switchgear Market Outlook (2026-2032) | Size, Share, Trends, Growth, Revenue, Forecast, Analysis, Value, Outlook
- Pakistan Contraceptive Implants Market (2025-2031) | Demand, Growth, Size, Share, Industry, Pricing Analysis, Competitive, Strategic Insights, Strategy, Consumer Insights, Analysis, Investment Trends, Opportunities, Revenue, Segments, Value, Segmentation, Supply, Forecast, Restraints, Outlook, Competition, Drivers, Trends, Companies, Challenges
- Sri Lanka Packaging Market (2026-2032) | Outlook, Competition, Drivers, Trends, Demand, Pricing Analysis, Competitive, Strategic Insights, Companies, Challenges, Strategy, Consumer Insights, Analysis, Investment Trends, Opportunities, Growth, Size, Share, Industry, Revenue, Segments, Value, Segmentation, Supply, Forecast, Restraints
- India Kids Watches Market (2026-2032) | Strategy, Consumer Insights, Analysis, Investment Trends, Opportunities, Growth, Size, Share, Industry, Revenue, Segments, Value, Segmentation, Supply, Forecast, Restraints, Outlook, Competition, Drivers, Trends, Demand, Pricing Analysis, Competitive, Strategic Insights, Companies, Challenges
- Saudi Arabia Core Assurance Service Market (2025-2031) | Strategy, Consumer Insights, Analysis, Investment Trends, Opportunities, Growth, Size, Share, Industry, Revenue, Segments, Value, Segmentation, Supply, Forecast, Restraints, Outlook, Competition, Drivers, Trends, Demand, Pricing Analysis, Competitive, Strategic Insights, Companies, Challenges
Industry Events and Analyst Meet

India EV Show 2026

EV tech India Expo 2026

Auto Tech Asia 2026

Battery Tech India 2026

Smart Production Solutions Guangzhou 2026
Whitepaper
- Middle East & Africa Commercial Security Market Click here to view more.
- Middle East & Africa Fire Safety Systems & Equipment Market Click here to view more.
- GCC Drone Market Click here to view more.
- Middle East Lighting Fixture Market Click here to view more.
- GCC Physical & Perimeter Security Market Click here to view more.
6WResearch In News
- Doha a strategic location for EV manufacturing hub: IPA Qatar
- Demand for luxury TVs surging in the GCC, says Samsung
- Empowering Growth: The Thriving Journey of Bangladesh’s Cable Industry
- Demand for luxury TVs surging in the GCC, says Samsung
- Video call with a traditional healer? Once unthinkable, it’s now common in South Africa
- Intelligent Buildings To Smooth GCC’s Path To Net Zero