Croatia Soups Market (2025-2031) | Trends, Size, Outlook, Companies, Analysis, Forecast, Segmentation, Growth, Industry, Share, Revenue & Value
Market Forecast By Type (Dry, Wet, Others), By Distribution Channel (Supermarkets & Hypermarkets, Convenience Stores, Others) And Competitive Landscape
| Product Code: ETC5008935 | Publication Date: Nov 2023 | Updated Date: Oct 2025 | Product Type: Market Research Report | |
| Publisher: 6Wresearch | Author: Sachin Kumar Rai | No. of Pages: 60 | No. of Figures: 30 | No. of Tables: 5 |
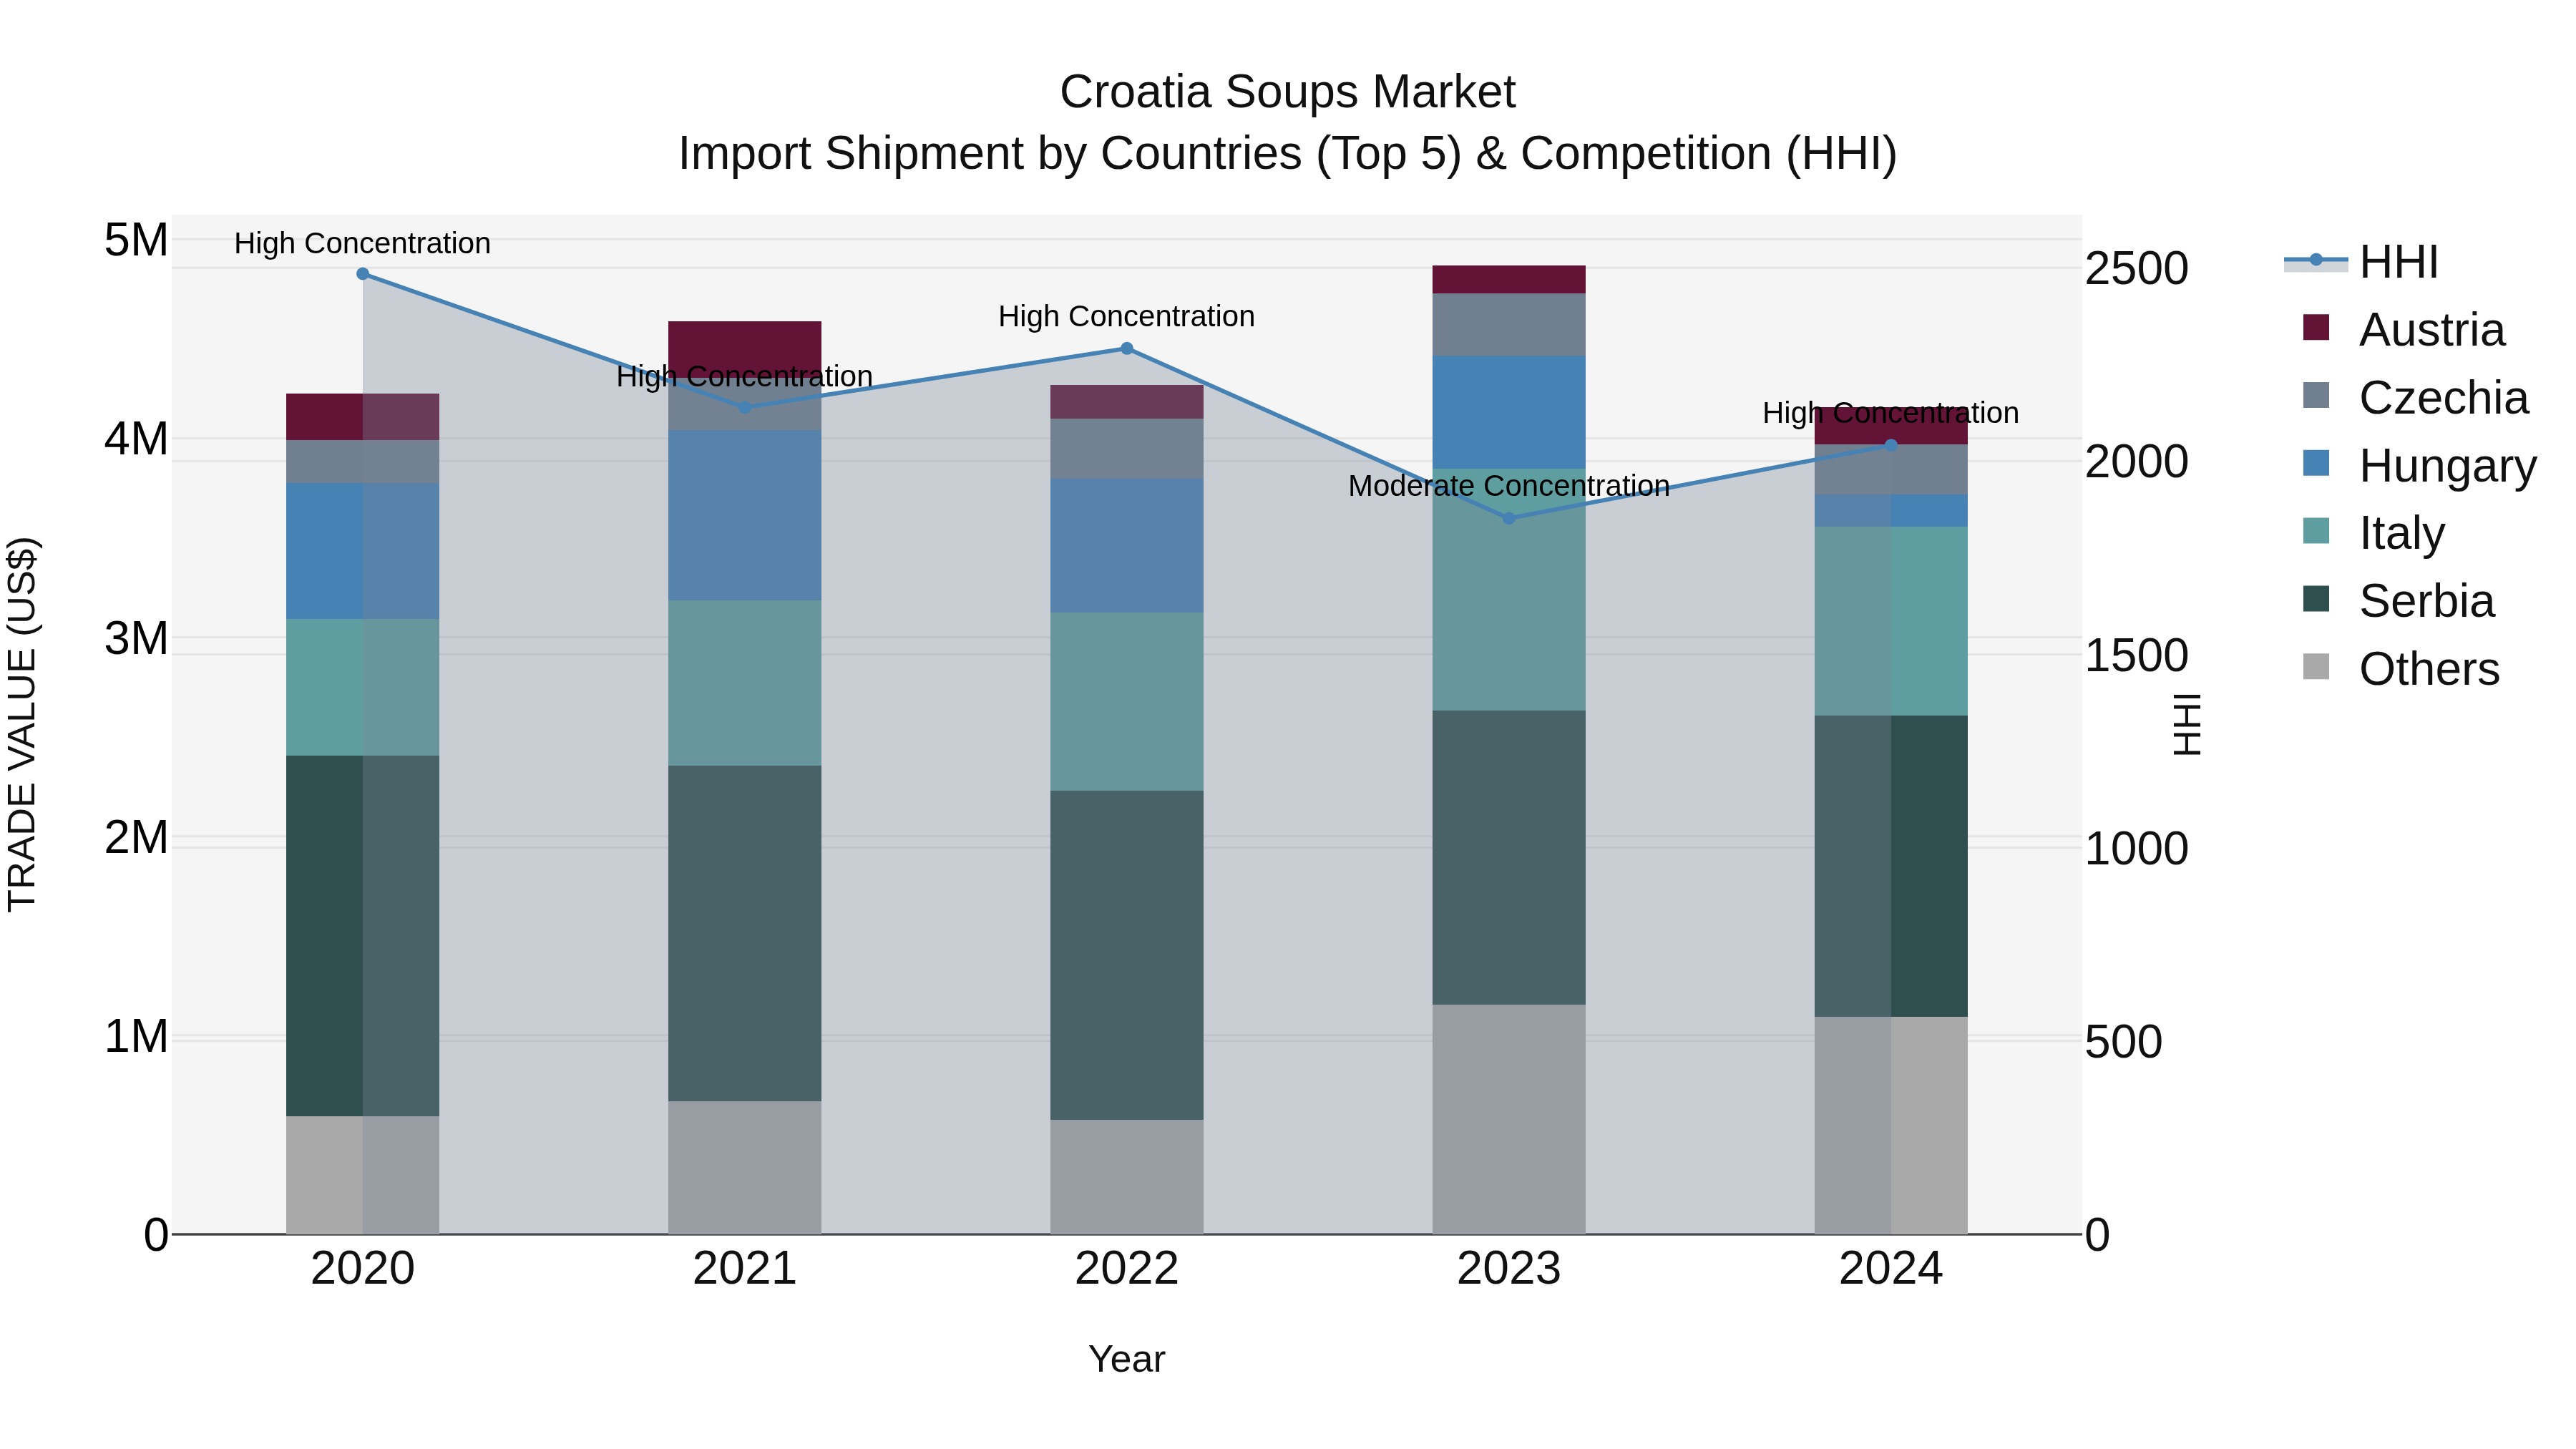
Croatia Soups Market Top 5 Importing Countries and Market Competition (HHI) Analysis
In 2024, Croatia soup import market saw a significant increase in concentration, with top exporting countries including Serbia, Italy, Spain, Czechia, and Germany. The negative Compound Annual Growth Rate (CAGR) of -0.42% from 2020 to 2024 indicates a slight decline in overall market size. Furthermore, the sharp decline in growth rate from 2023 to 2024 at -14.64% suggests a challenging year for soup imports in Croatia. This shift in concentration and growth rates may necessitate a closer examination of market dynamics and potential factors influencing these trends for stakeholders in the industry.
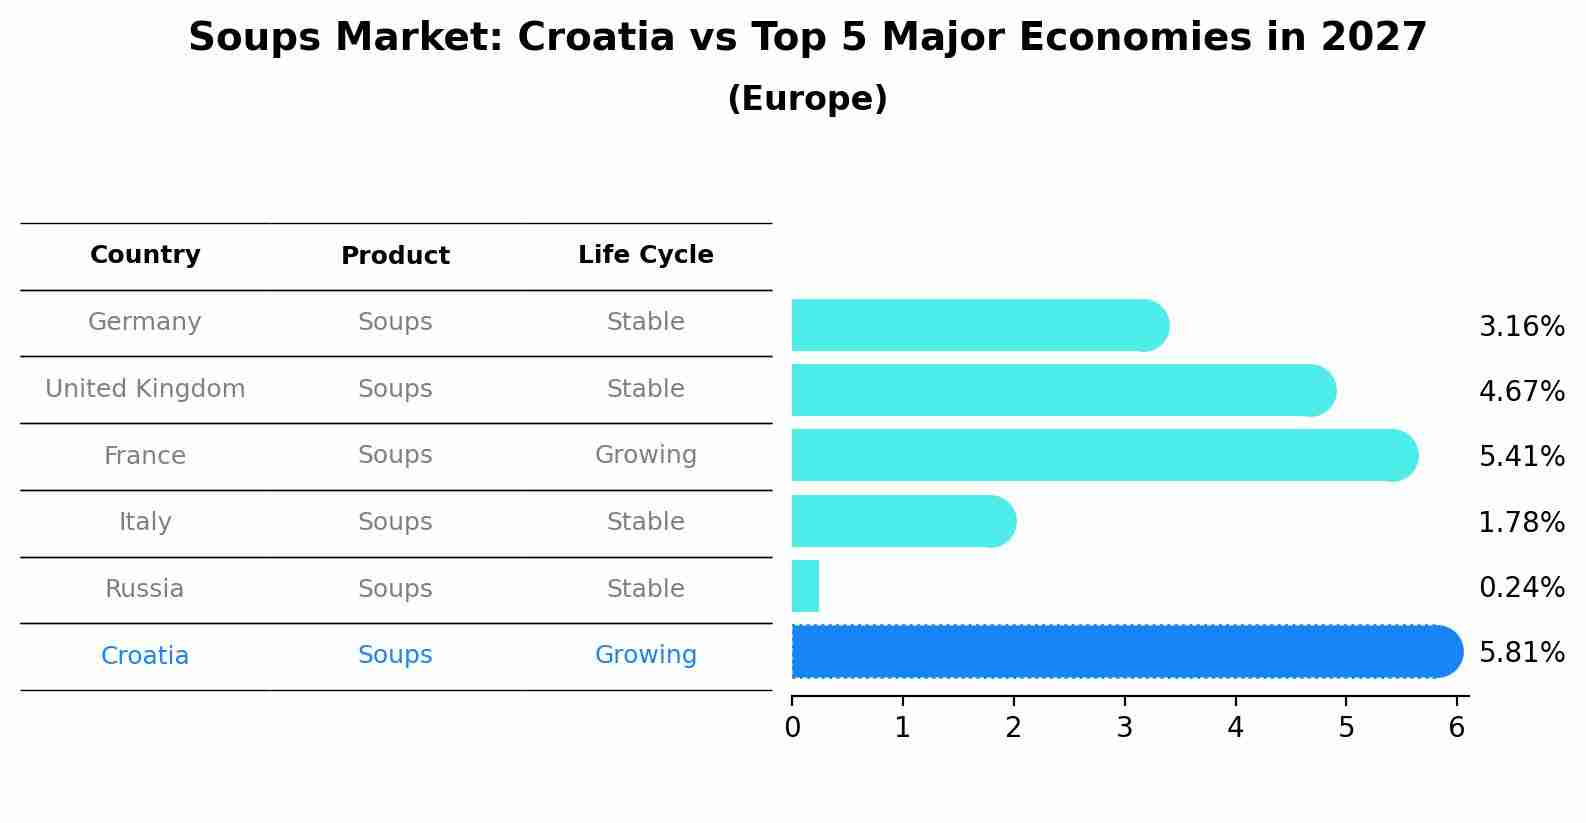
Soups Market: Croatia vs Top 5 Major Economies in 2027 (Europe)
By 2027, the Soups market in Croatia is anticipated to reach a growth rate of 5.81%, as part of an increasingly competitive Europe region, where Germany remains at the forefront, supported by United Kingdom, France, Italy and Russia, driving innovations and market adoption across sectors.
Croatia Soups Market Overview
The soups market in Croatia includes a variety of ready-to-eat and canned soups. The market is influenced by changing consumer preferences for convenient and nutritious food options, the growth of the food and beverage sector, and innovations in soup products.
Drivers of the market
The soups market in Croatia is growing due to the increasing demand for convenient and nutritious meal options. Soups are popular for their ease of preparation and variety of flavors. The market is driven by changing consumer lifestyles, the rise in ready-to-eat and packaged soups, and the focus on health and wellness. Advancements in soup formulations and the growing trend of gourmet and specialty soups are also contributing to market growth.
Challenges of the market
In the soups market, Croatia grapples with fluctuating raw material costs and the growing demand for natural and healthier soup options. The market faces competition from alternative ready-to-eat meals, and manufacturers must comply with evolving food safety and labeling regulations. Additionally, consumer trends are shifting towards convenience foods that offer nutritional benefits.
Government Policy of the market
The Croatian governments policies supporting the food and beverage industry, including regulations on food safety and quality, foster growth in the soups market. The promotion of locally produced foods is also a key factor in market expansion.
Key Highlights of the Report:
- Croatia Soups Market Outlook
- Market Size of Croatia Soups Market, 2024
- Forecast of Croatia Soups Market, 2031
- Historical Data and Forecast of Croatia Soups Revenues & Volume for the Period 2021-2031
- Croatia Soups Market Trend Evolution
- Croatia Soups Market Drivers and Challenges
- Croatia Soups Price Trends
- Croatia Soups Porter`s Five Forces
- Croatia Soups Industry Life Cycle
- Historical Data and Forecast of Croatia Soups Market Revenues & Volume By Type for the Period 2021-2031
- Historical Data and Forecast of Croatia Soups Market Revenues & Volume By Dry for the Period 2021-2031
- Historical Data and Forecast of Croatia Soups Market Revenues & Volume By Wet for the Period 2021-2031
- Historical Data and Forecast of Croatia Soups Market Revenues & Volume By Others for the Period 2021-2031
- Historical Data and Forecast of Croatia Soups Market Revenues & Volume By Distribution Channel for the Period 2021-2031
- Historical Data and Forecast of Croatia Soups Market Revenues & Volume By Supermarkets & Hypermarkets for the Period 2021-2031
- Historical Data and Forecast of Croatia Soups Market Revenues & Volume By Convenience Stores for the Period 2021-2031
- Historical Data and Forecast of Croatia Soups Market Revenues & Volume By Others for the Period 2021-2031
- Croatia Soups Import Export Trade Statistics
- Market Opportunity Assessment By Type
- Market Opportunity Assessment By Distribution Channel
- Croatia Soups Top Companies Market Share
- Croatia Soups Competitive Benchmarking By Technical and Operational Parameters
- Croatia Soups Company Profiles
- Croatia Soups Key Strategic Recommendations
Frequently Asked Questions About the Market Study (FAQs):
6Wresearch actively monitors the Croatia Soups Market and publishes its comprehensive annual report, highlighting emerging trends, growth drivers, revenue analysis, and forecast outlook. Our insights help businesses to make data-backed strategic decisions with ongoing market dynamics. Our analysts track relevent industries related to the Croatia Soups Market, allowing our clients with actionable intelligence and reliable forecasts tailored to emerging regional needs.
Yes, we provide customisation as per your requirements. To learn more, feel free to contact us on sales@6wresearch.com
1 Executive Summary |
2 Introduction |
2.1 Key Highlights of the Report |
2.2 Report Description |
2.3 Market Scope & Segmentation |
2.4 Research Methodology |
2.5 Assumptions |
3 Croatia Soups Market Overview |
3.1 Croatia Country Macro Economic Indicators |
3.2 Croatia Soups Market Revenues & Volume, 2021 & 2031F |
3.3 Croatia Soups Market - Industry Life Cycle |
3.4 Croatia Soups Market - Porter's Five Forces |
3.5 Croatia Soups Market Revenues & Volume Share, By Type, 2021 & 2031F |
3.6 Croatia Soups Market Revenues & Volume Share, By Distribution Channel, 2021 & 2031F |
4 Croatia Soups Market Dynamics |
4.1 Impact Analysis |
4.2 Market Drivers |
4.2.1 Increasing consumer awareness about the health benefits of soups |
4.2.2 Growing demand for convenient and ready-to-eat meal solutions |
4.2.3 Rising popularity of traditional Croatian cuisine globally |
4.3 Market Restraints |
4.3.1 Seasonality of soup consumption, with higher demand during colder months |
4.3.2 Competition from other convenient meal options like frozen meals and fast food |
5 Croatia Soups Market Trends |
6 Croatia Soups Market Segmentations |
6.1 Croatia Soups Market, By Type |
6.1.1 Overview and Analysis |
6.1.2 Croatia Soups Market Revenues & Volume, By Dry, 2021-2031F |
6.1.3 Croatia Soups Market Revenues & Volume, By Wet, 2021-2031F |
6.1.4 Croatia Soups Market Revenues & Volume, By Others, 2021-2031F |
6.2 Croatia Soups Market, By Distribution Channel |
6.2.1 Overview and Analysis |
6.2.2 Croatia Soups Market Revenues & Volume, By Supermarkets & Hypermarkets, 2021-2031F |
6.2.3 Croatia Soups Market Revenues & Volume, By Convenience Stores, 2021-2031F |
6.2.4 Croatia Soups Market Revenues & Volume, By Others, 2021-2031F |
7 Croatia Soups Market Import-Export Trade Statistics |
7.1 Croatia Soups Market Export to Major Countries |
7.2 Croatia Soups Market Imports from Major Countries |
8 Croatia Soups Market Key Performance Indicators |
8.1 Number of new product launches in the soup category |
8.2 Consumer engagement on social media platforms for soup brands |
8.3 Percentage of households consuming soups as a meal option |
8.4 Average time spent by consumers in the soup aisle at supermarkets |
8.5 Number of partnerships with restaurants or food delivery services for soup offerings |
9 Croatia Soups Market - Opportunity Assessment |
9.1 Croatia Soups Market Opportunity Assessment, By Type, 2021 & 2031F |
9.2 Croatia Soups Market Opportunity Assessment, By Distribution Channel, 2021 & 2031F |
10 Croatia Soups Market - Competitive Landscape |
10.1 Croatia Soups Market Revenue Share, By Companies, 2024 |
10.2 Croatia Soups Market Competitive Benchmarking, By Operating and Technical Parameters |
11 Company Profiles |
12 Recommendations | 13 Disclaimer |
Global Go To Market Strategy - 2030
Export potential enables firms to identify high-growth global markets with greater confidence by combining advanced trade intelligence with a structured quantitative methodology. The framework analyzes emerging demand trends and country-level import patterns while integrating macroeconomic and trade datasets such as GDP and population forecasts, bilateral import–export flows, tariff structures, elasticity differentials between developed and developing economies, geographic distance, and import demand projections. Using weighted trade values from 2020–2024 as the base period to project country-to-country export potential for 2030, these inputs are operationalized through calculated drivers such as gravity model parameters, tariff impact factors, and projected GDP per-capita growth. Through an analysis of hidden potentials, demand hotspots, and market conditions that are most favorable to success, this method enables firms to focus on target countries, maximize returns, and global expansion with data, backed by accuracy.
By factoring in the projected importer demand gap that is currently unmet and could be potential opportunity, it identifies the potential for the Exporter (Country) among 190 countries, against the general trade analysis, which identifies the biggest importer or exporter.
To discover high-growth global markets and optimize your business strategy:
Click Here
Pricing
- Single User License$ 1,995
- Department License$ 2,400
- Site License$ 3,120
- Global License$ 3,795

Leadership Perspectives from Industry Events
Search
Thought Leadership and Analyst Meet


Our Clients
6WResearch In News
- Doha a strategic location for EV manufacturing hub: IPA Qatar
- Demand for luxury TVs surging in the GCC, says Samsung
- Empowering Growth: The Thriving Journey of Bangladesh’s Cable Industry
- Demand for luxury TVs surging in the GCC, says Samsung
- Video call with a traditional healer? Once unthinkable, it’s now common in South Africa
- Intelligent Buildings To Smooth GCC’s Path To Net Zero
Latest Reports
- Taiwan Airport Wireless Infrastructure Market (2026-2032)
- Vietnam Airport Wireless Infrastructure Market (2026-2032)
- Thailand Airport Wireless Infrastructure Market (2026-2032)
- South Korea Airport Wireless Infrastructure Market (2026-2032)
- Romania Airport Wireless Infrastructure Market (2026-2032)
- Qatar Airport Wireless Infrastructure Market (2026-2032)
- Philippines Airport Wireless Infrastructure Market (2026-2032)
- Japan Airport Wireless Infrastructure Market (2026-2032)
- Taiwan Airport Winter Services Market (2026-2032)
- Vietnam Airport Winter Services Market (2026-2032)
Industry Events and Analyst Meet

HIMTEX 2026

India Refining Summit 2026

India EV Show 2026

EV tech India Expo 2026

Auto Tech Asia 2026
Whitepaper
- Middle East & Africa Commercial Security Market Click here to view more.
- Middle East & Africa Fire Safety Systems & Equipment Market Click here to view more.
- GCC Drone Market Click here to view more.
- Middle East Lighting Fixture Market Click here to view more.
- GCC Physical & Perimeter Security Market Click here to view more.