Georgia Soups Market Outlook | Value, Size, Companies, Growth, Trends, Industry, COVID-19 IMPACT, Revenue, Forecast, Analysis & Share
Market Forecast By Type (Dry, Wet, Others), By Distribution Channel (Supermarkets & Hypermarkets, Convenience Stores, Others) And Competitive Landscape
| Product Code: ETC218700 | Publication Date: Aug 2022 | Updated Date: Aug 2025 | Product Type: Market Research Report | |
| Publisher: 6Wresearch | Author: Ravi Bhandari | No. of Pages: 75 | No. of Figures: 35 | No. of Tables: 20 |
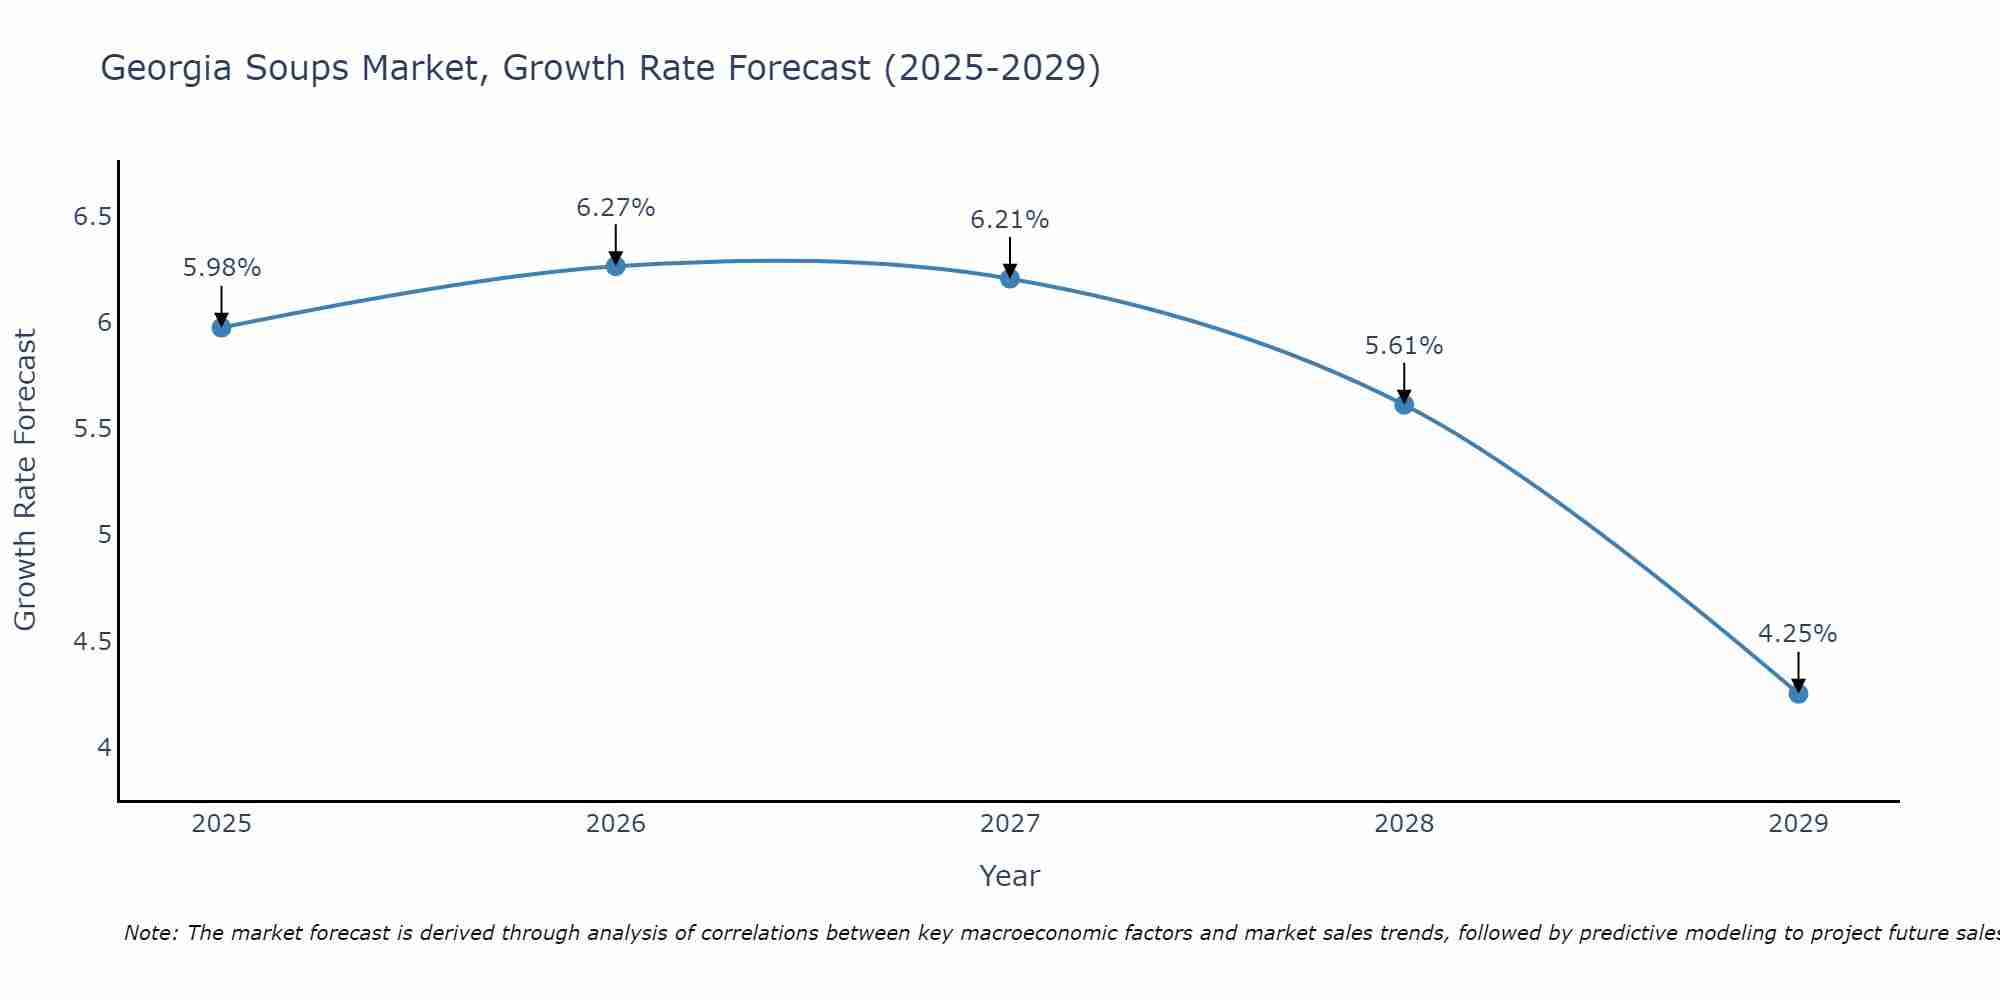
Georgia Soups Market Size Growth Rate
The Georgia Soups Market is projected to witness mixed growth rate patterns during 2025 to 2029. Starting at 5.98% in 2025, the market peaks at 6.27% in 2026, and settles at 4.25% by 2029.
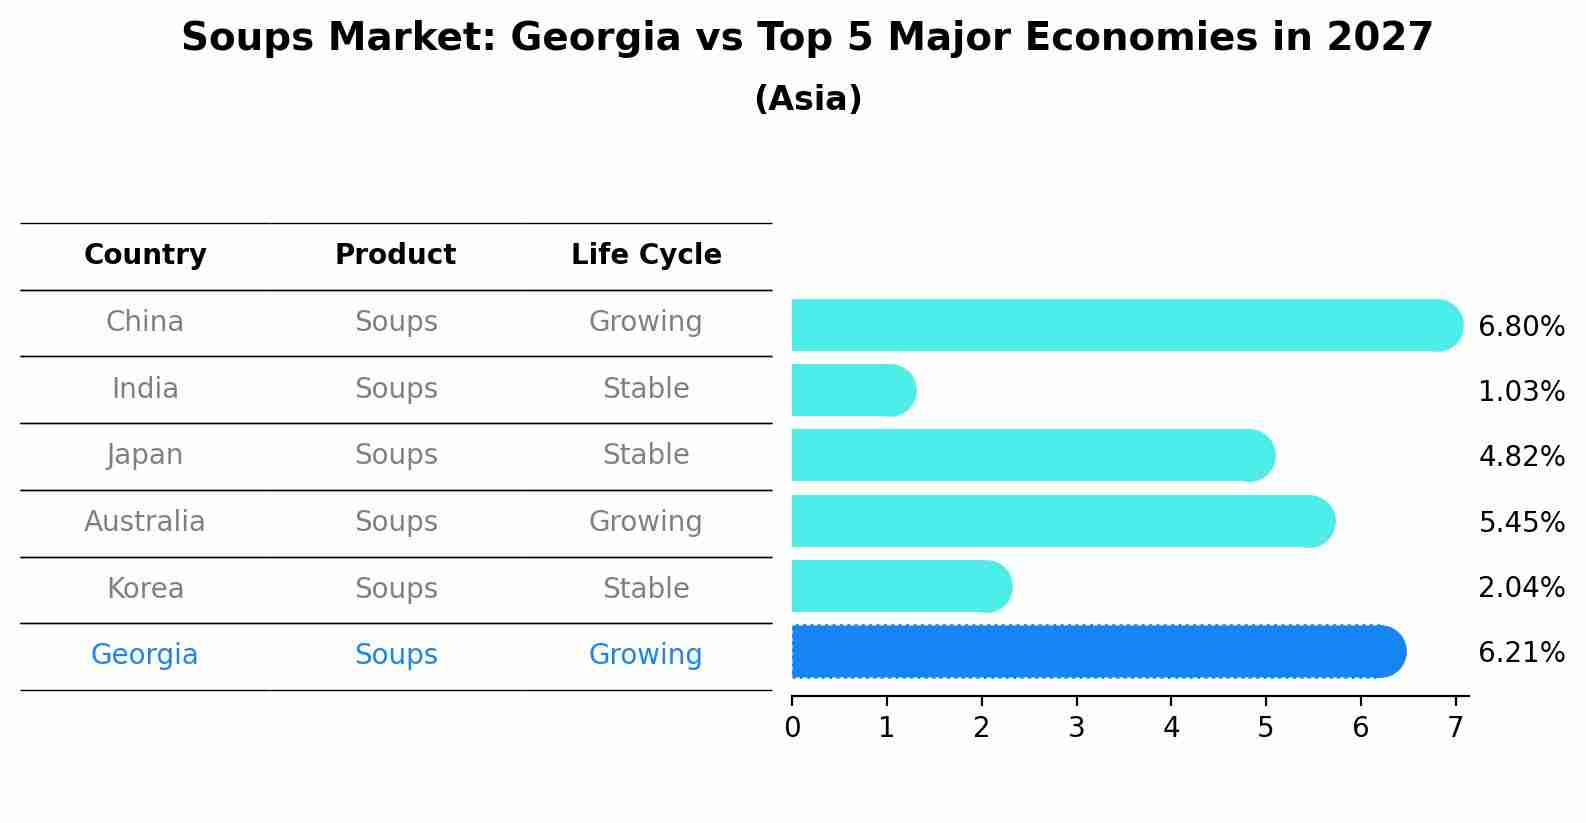
Soups Market: Georgia vs Top 5 Major Economies in 2027 (Asia)
The Soups market in Georgia is projected to grow at a growing growth rate of 6.21% by 2027, within the Asia region led by China, along with other countries like India, Japan, Australia and South Korea, collectively shaping a dynamic and evolving market environment driven by innovation and increasing adoption of emerging technologies.
Georgia Soups Market Overview
Georgia soups market caters to consumers seeking convenient and nutritious meal options. With a variety of flavors and formulations, packaged soups offer quick and easy solutions for busy lifestyles.
/h3
The soups market in Georgia is influenced by factors such as busy lifestyles, changing consumer preferences, and the popularity of convenience foods. Soups are consumed as appetizers, snacks, or main meals and are available in various flavors and formulations. Market growth is driven by trends such as the demand for ready-to-eat meals, the introduction of gourmet and ethnic soup varieties, and innovations in packaging and distribution channels.
/h3
The soups market in Georgia faces challenges related to changing consumer preferences and market dynamics. While soups are a staple convenience food, challenges such as competition from fresh and ready-to-eat meal options, ingredient sourcing, and flavor innovation pose barriers to market growth. Additionally, addressing concerns about product differentiation, packaging sustainability, and health-conscious consumer trends adds complexity to the soups market.
/h3
In Georgia, the soups market is shaped by government policies addressing food safety, labeling regulations, and agricultural production. Regulatory agencies may establish rules and guidelines for soup manufacturing, packaging, and distribution to ensure product quality, safety, and compliance with food regulations. Additionally, government initiatives promoting local agriculture, culinary tourism, and healthy eating habits may drive demand for soups made from locally sourced ingredients in Georgia. Government support for food industry entrepreneurship, small business development, and agricultural sustainability may also influence market dynamics in the soups market.
Key Highlights of the Report:
- Georgia Soups Market Outlook
- Market Size of Georgia Soups Market, 2021
- Forecast of Georgia Soups Market, 2028
- Historical Data and Forecast of Georgia Soups Revenues & Volume for the Period 2018 - 2028
- Georgia Soups Market Trend Evolution
- Georgia Soups Market Drivers and Challenges
- Georgia Soups Price Trends
- Georgia Soups Porter's Five Forces
- Georgia Soups Industry Life Cycle
- Historical Data and Forecast of Georgia Soups Market Revenues & Volume By Type for the Period 2018 - 2028
- Historical Data and Forecast of Georgia Soups Market Revenues & Volume By Dry for the Period 2018 - 2028
- Historical Data and Forecast of Georgia Soups Market Revenues & Volume By Wet for the Period 2018 - 2028
- Historical Data and Forecast of Georgia Soups Market Revenues & Volume By Others for the Period 2018 - 2028
- Historical Data and Forecast of Georgia Soups Market Revenues & Volume By Distribution Channel for the Period 2018 - 2028
- Historical Data and Forecast of Georgia Soups Market Revenues & Volume By Supermarkets & Hypermarkets for the Period 2018 - 2028
- Historical Data and Forecast of Georgia Soups Market Revenues & Volume By Convenience Stores for the Period 2018 - 2028
- Historical Data and Forecast of Georgia Soups Market Revenues & Volume By Others for the Period 2018 - 2028
- Georgia Soups Import Export Trade Statistics
- Market Opportunity Assessment By Type
- Market Opportunity Assessment By Distribution Channel
- Georgia Soups Top Companies Market Share
- Georgia Soups Competitive Benchmarking By Technical and Operational Parameters
- Georgia Soups Company Profiles
- Georgia Soups Key Strategic Recommendations
Frequently Asked Questions About the Market Study (FAQs):
6Wresearch actively monitors the Georgia Soups Market and publishes its comprehensive annual report, highlighting emerging trends, growth drivers, revenue analysis, and forecast outlook. Our insights help businesses to make data-backed strategic decisions with ongoing market dynamics. Our analysts track relevent industries related to the Georgia Soups Market, allowing our clients with actionable intelligence and reliable forecasts tailored to emerging regional needs.
Yes, we provide customisation as per your requirements. To learn more, feel free to contact us on sales@6wresearch.com
1 Executive Summary |
2 Introduction |
2.1 Key Highlights of the Report |
2.2 Report Description |
2.3 Market Scope & Segmentation |
2.4 Research Methodology |
2.5 Assumptions |
3 Georgia Soups Market Overview |
3.1 Georgia Country Macro Economic Indicators |
3.2 Georgia Soups Market Revenues & Volume, 2021 & 2028F |
3.3 Georgia Soups Market - Industry Life Cycle |
3.4 Georgia Soups Market - Porter's Five Forces |
3.5 Georgia Soups Market Revenues & Volume Share, By Type, 2021 & 2028F |
3.6 Georgia Soups Market Revenues & Volume Share, By Distribution Channel, 2021 & 2028F |
4 Georgia Soups Market Dynamics |
4.1 Impact Analysis |
4.2 Market Drivers |
4.2.1 Increasing consumer awareness about the benefits of consuming soups for health and convenience |
4.2.2 Growing demand for ready-to-eat and convenient meal options |
4.2.3 Rising trend of healthy eating and preference for natural and organic ingredients |
4.3 Market Restraints |
4.3.1 Seasonal demand fluctuations due to weather changes impacting soup consumption |
4.3.2 Competition from other convenient meal options such as fast food and meal delivery services |
5 Georgia Soups Market Trends |
6 Georgia Soups Market, By Types |
6.1 Georgia Soups Market, By Type |
6.1.1 Overview and Analysis |
6.1.2 Georgia Soups Market Revenues & Volume, By Type, 2018 - 2028F |
6.1.3 Georgia Soups Market Revenues & Volume, By Dry, 2018 - 2028F |
6.1.4 Georgia Soups Market Revenues & Volume, By Wet, 2018 - 2028F |
6.1.5 Georgia Soups Market Revenues & Volume, By Others, 2018 - 2028F |
6.2 Georgia Soups Market, By Distribution Channel |
6.2.1 Overview and Analysis |
6.2.2 Georgia Soups Market Revenues & Volume, By Supermarkets & Hypermarkets, 2018 - 2028F |
6.2.3 Georgia Soups Market Revenues & Volume, By Convenience Stores, 2018 - 2028F |
6.2.4 Georgia Soups Market Revenues & Volume, By Others, 2018 - 2028F |
7 Georgia Soups Market Import-Export Trade Statistics |
7.1 Georgia Soups Market Export to Major Countries |
7.2 Georgia Soups Market Imports from Major Countries |
8 Georgia Soups Market Key Performance Indicators |
8.1 Consumer engagement on social media platforms promoting healthy eating and soup recipes |
8.2 Number of new product launches in the Georgia soups market with natural and organic ingredients |
8.3 Percentage increase in online searches for soup recipes and soup-related content |
9 Georgia Soups Market - Opportunity Assessment |
9.1 Georgia Soups Market Opportunity Assessment, By Type, 2021 & 2028F |
9.2 Georgia Soups Market Opportunity Assessment, By Distribution Channel, 2021 & 2028F |
10 Georgia Soups Market - Competitive Landscape |
10.1 Georgia Soups Market Revenue Share, By Companies, 2021 |
10.2 Georgia Soups Market Competitive Benchmarking, By Operating and Technical Parameters |
11 Company Profiles |
12 Recommendations |
13 Disclaimer |
Global Go To Market Strategy - 2030
Export potential enables firms to identify high-growth global markets with greater confidence by combining advanced trade intelligence with a structured quantitative methodology. The framework analyzes emerging demand trends and country-level import patterns while integrating macroeconomic and trade datasets such as GDP and population forecasts, bilateral import–export flows, tariff structures, elasticity differentials between developed and developing economies, geographic distance, and import demand projections. Using weighted trade values from 2020–2024 as the base period to project country-to-country export potential for 2030, these inputs are operationalized through calculated drivers such as gravity model parameters, tariff impact factors, and projected GDP per-capita growth. Through an analysis of hidden potentials, demand hotspots, and market conditions that are most favorable to success, this method enables firms to focus on target countries, maximize returns, and global expansion with data, backed by accuracy.
By factoring in the projected importer demand gap that is currently unmet and could be potential opportunity, it identifies the potential for the Exporter (Country) among 190 countries, against the general trade analysis, which identifies the biggest importer or exporter.
To discover high-growth global markets and optimize your business strategy:
Click Here
Pricing
- Single User License$ 1,995
- Department License$ 2,400
- Site License$ 3,120
- Global License$ 3,795

Leadership Perspectives from Industry Events
Search
Thought Leadership and Analyst Meet


Our Clients
6WResearch In News
- Doha a strategic location for EV manufacturing hub: IPA Qatar
- Demand for luxury TVs surging in the GCC, says Samsung
- Empowering Growth: The Thriving Journey of Bangladesh’s Cable Industry
- Demand for luxury TVs surging in the GCC, says Samsung
- Video call with a traditional healer? Once unthinkable, it’s now common in South Africa
- Intelligent Buildings To Smooth GCC’s Path To Net Zero
Latest Reports
- Taiwan Airport Wireless Infrastructure Market (2026-2032)
- Vietnam Airport Wireless Infrastructure Market (2026-2032)
- Thailand Airport Wireless Infrastructure Market (2026-2032)
- South Korea Airport Wireless Infrastructure Market (2026-2032)
- Romania Airport Wireless Infrastructure Market (2026-2032)
- Qatar Airport Wireless Infrastructure Market (2026-2032)
- Philippines Airport Wireless Infrastructure Market (2026-2032)
- Japan Airport Wireless Infrastructure Market (2026-2032)
- Taiwan Airport Winter Services Market (2026-2032)
- Vietnam Airport Winter Services Market (2026-2032)
Industry Events and Analyst Meet

HIMTEX 2026

India Refining Summit 2026

India EV Show 2026

EV tech India Expo 2026

Auto Tech Asia 2026
Whitepaper
- Middle East & Africa Commercial Security Market Click here to view more.
- Middle East & Africa Fire Safety Systems & Equipment Market Click here to view more.
- GCC Drone Market Click here to view more.
- Middle East Lighting Fixture Market Click here to view more.
- GCC Physical & Perimeter Security Market Click here to view more.