Croatia Tanning Agents Market (2026-2032) | Segmentation, Size, Industry, Value, Outlook, Trends, Growth, Revenue, Companies, Analysis, Share & Forecast
Market Forecast By Type (Inorganic Materials, Aldehyde Tanning Agents, Vegetable Tanning Agents, Other Types), By Application (Leather tanning, Sun Tanning and Personal Care Products, Other Applications) And Competitive Landscape
| Product Code: ETC5157363 | Publication Date: Nov 2023 | Updated Date: Apr 2026 | Product Type: Market Research Report | |
| Publisher: 6Wresearch | Author: Shubham Padhi | No. of Pages: 60 | No. of Figures: 30 | No. of Tables: 5 |
Croatia Tanning Agents Market Size (2020-2030)
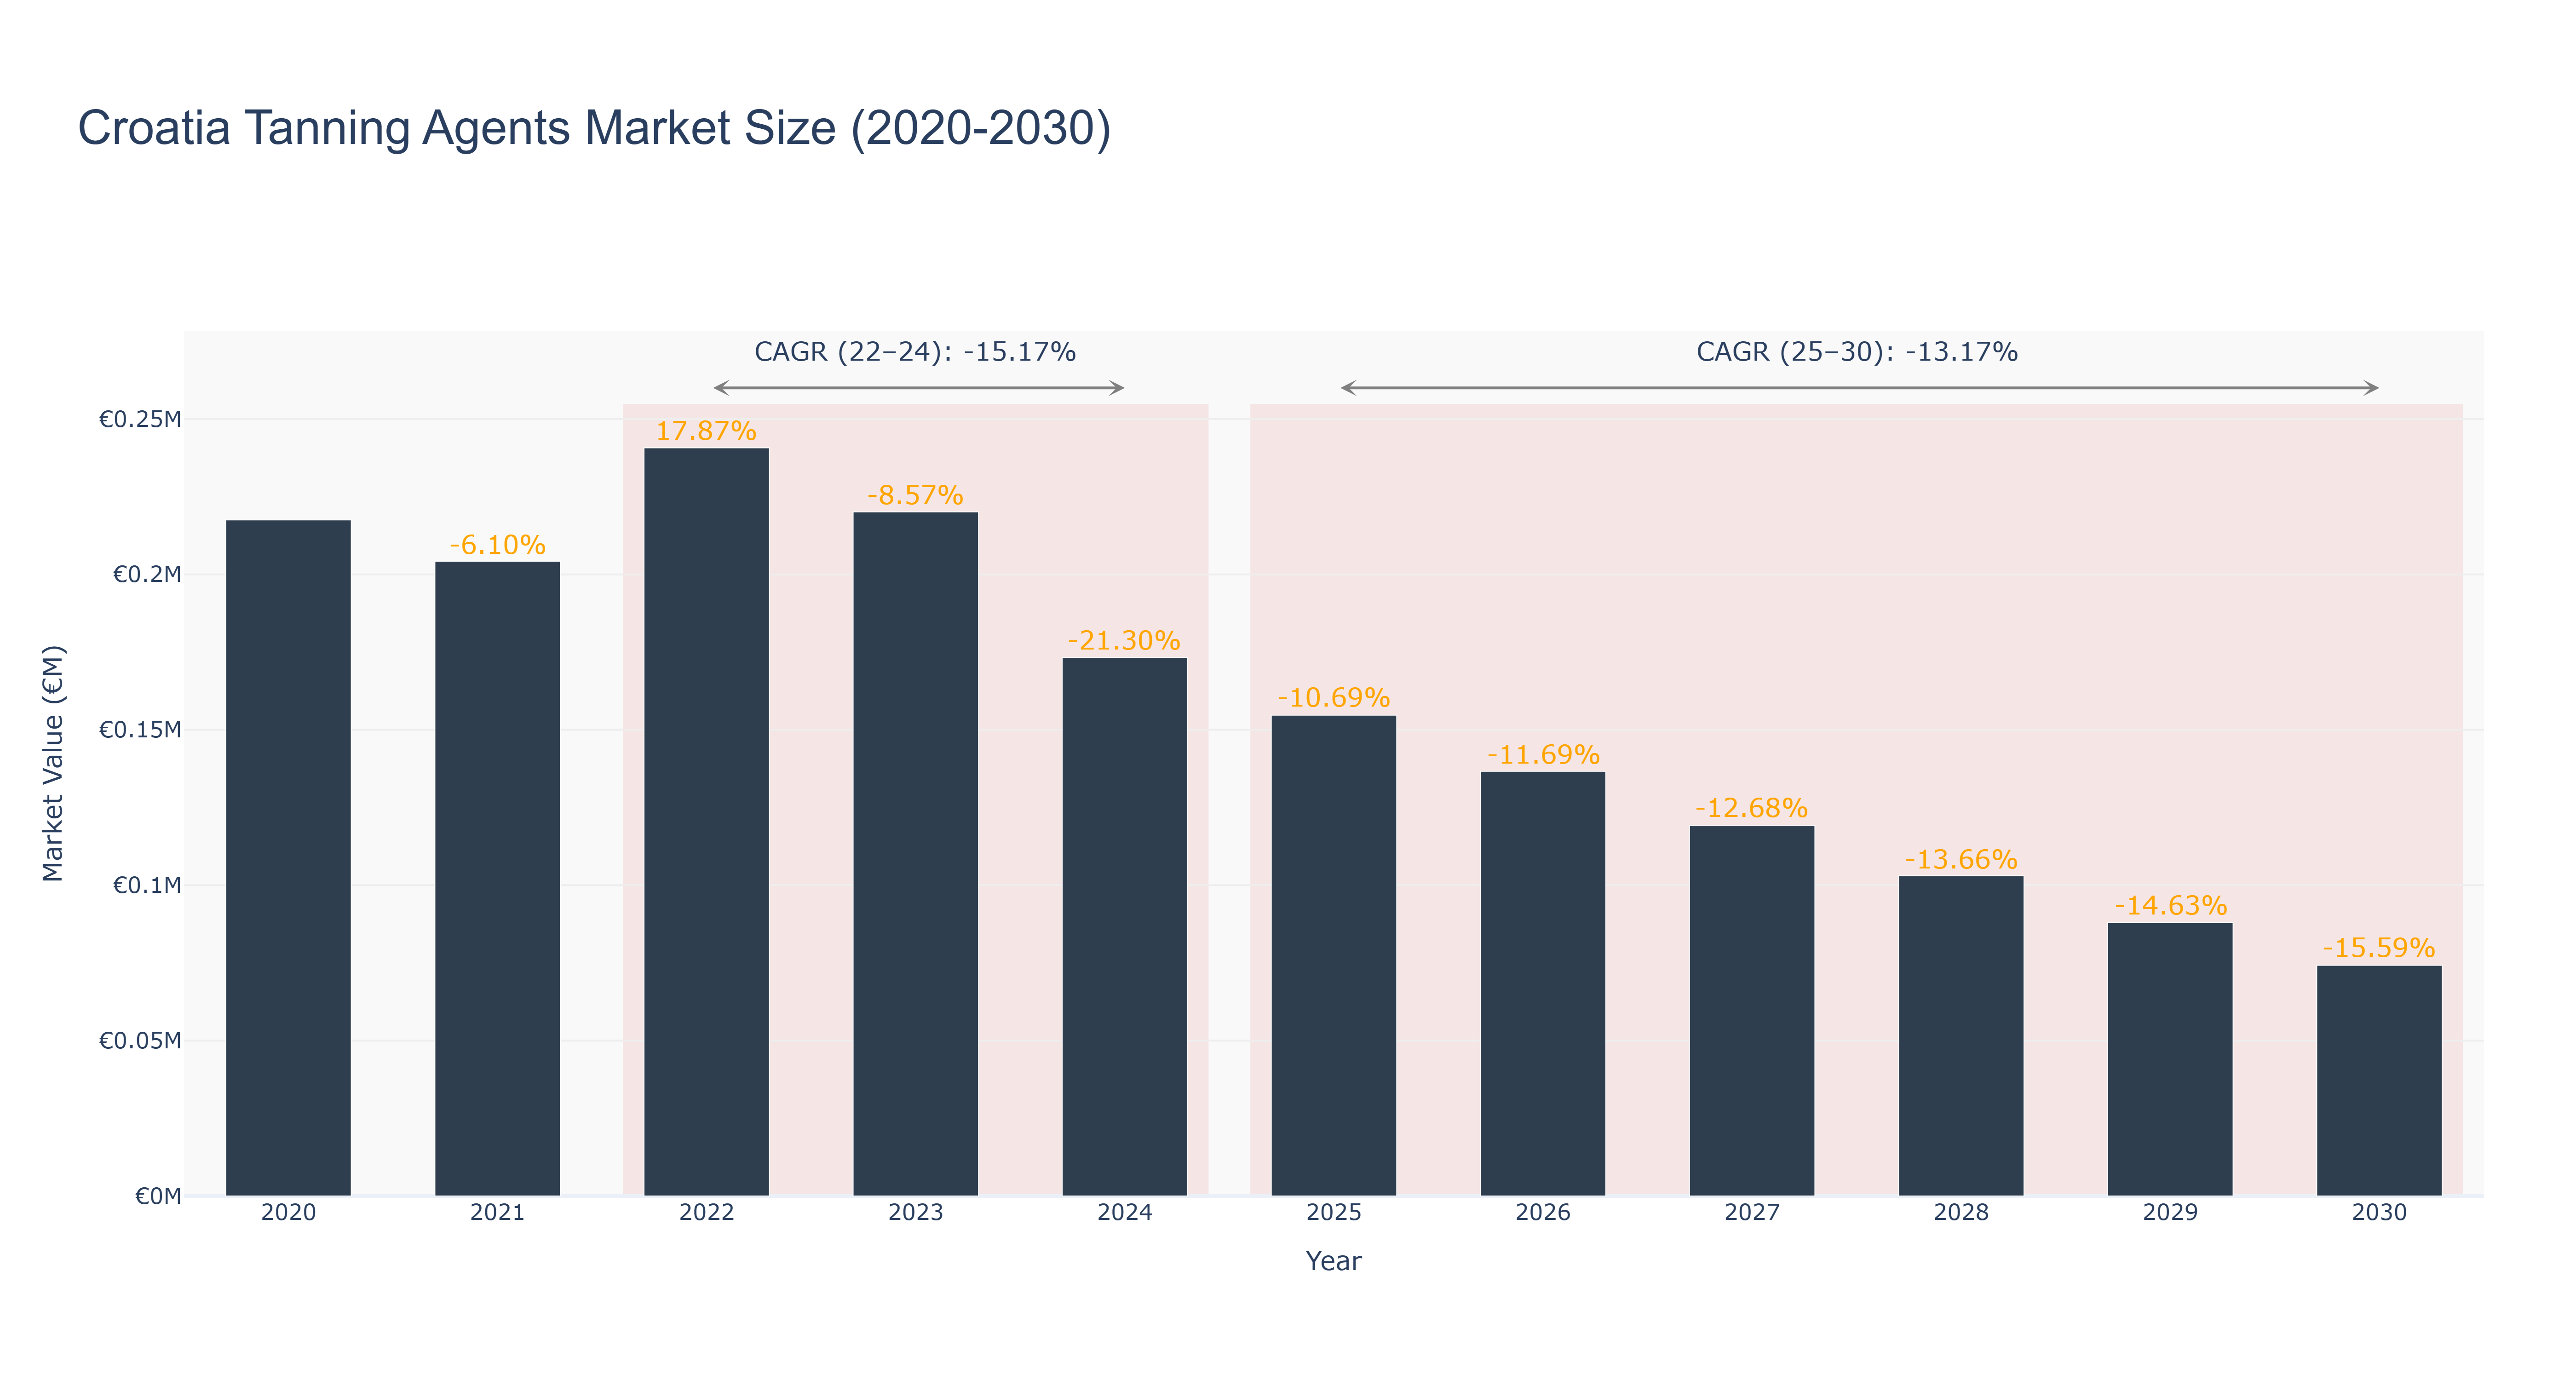
The Croatia Tanning Agents Market experienced a peak market size of €240.73 thousand in 2022, reflecting a robust growth of 17.87% from the previous year. However, this growth was short-lived, as the market contracted to €220.11 thousand in 2023 and further declined to €173.22 thousand in 2024, resulting in an actual CAGR of -15.17% for the period from 2022 to 2024. Looking ahead, the forecasted market size continues to diminish, with projections indicating a decline to €74.22 thousand by 2030, reflecting a CAGR of -13.17% from 2025 to 2030. The downturn can be attributed to increasing regulatory pressures and a shift toward sustainable practices in the tanning industry. Although there are no specific upcoming projects known to stimulate growth, macroeconomic factors, including changes in consumer preferences and environmental regulations, will likely continue to influence market dynamics in the coming years.
Croatia Tanning Agents Market: Production & Trade Performance (2019-2025)
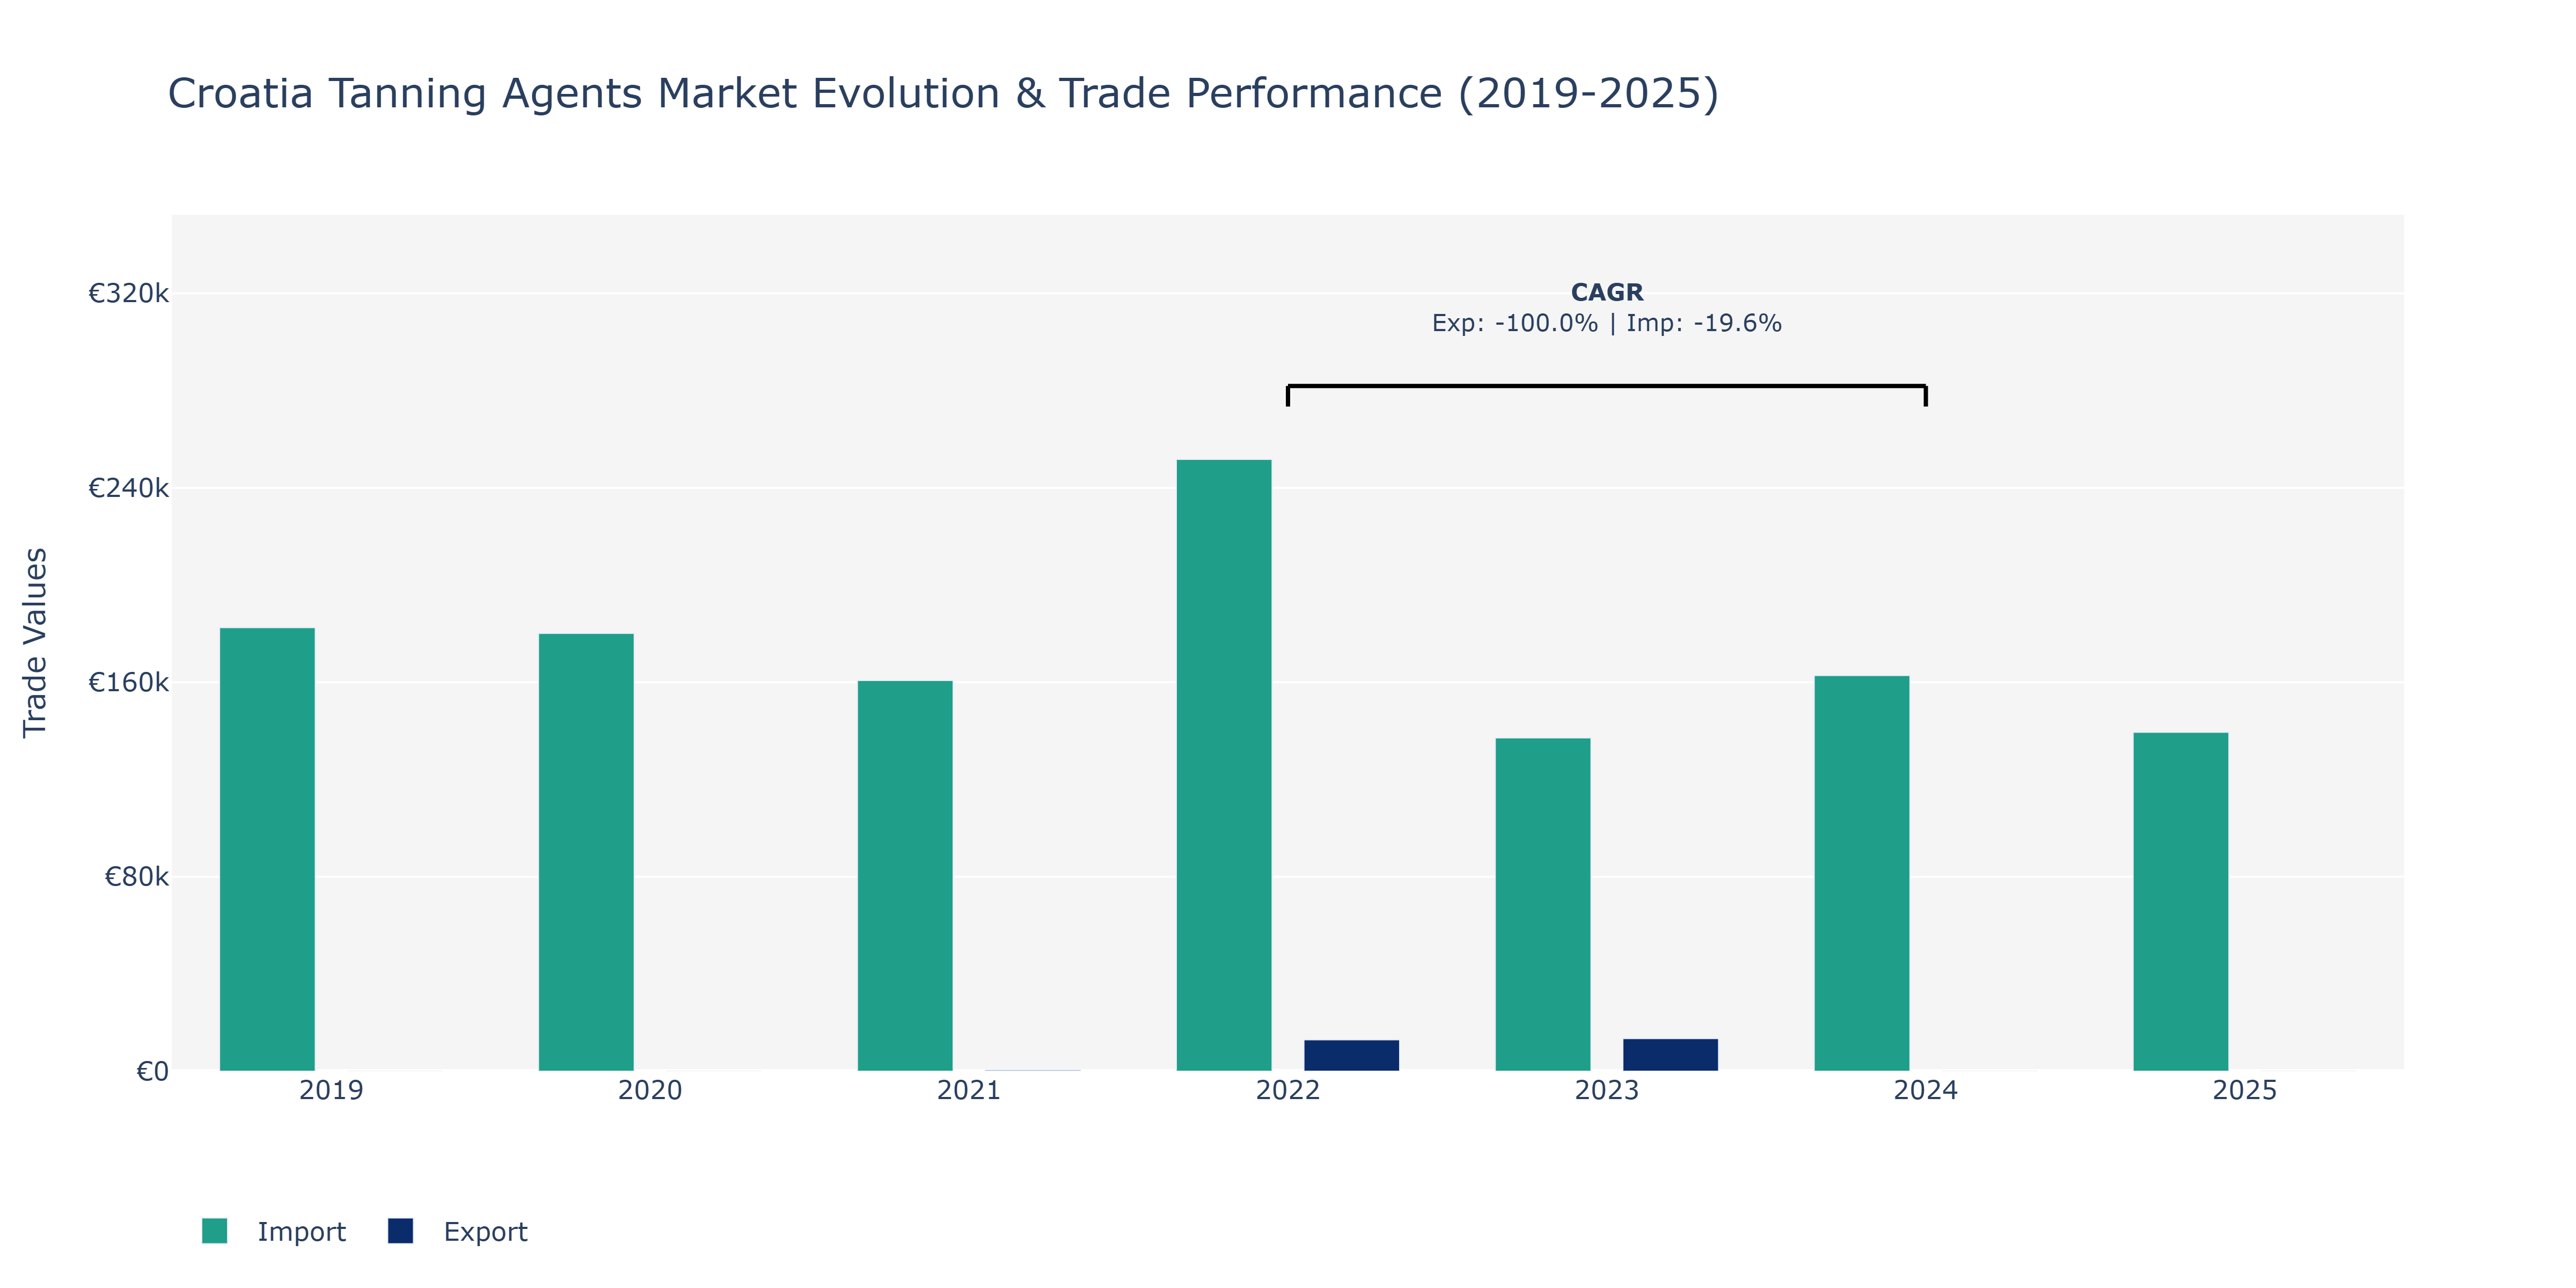
In the Croatia Tanning Agents Market, imports experienced fluctuations over the years, starting at €182.44 thousand in 2019 and declining to €160.74 thousand in 2021. However, there was a notable increase in 2022 to €251.68 thousand, marking a peak before decreasing to €137.12 thousand in 2023, and slightly rebounding to €139.42 thousand in 2025. On the other hand, exports demonstrated a different pattern, with figures steadily rising from €508 thousand in 2021 to €13.4 million in 2023. Notably, exports declined to €12.93 thousand in 2022. The market's import fluctuations may be attributed to shifts in consumer demand, changes in raw material prices, and evolving trade agreements affecting procurement strategies. Conversely, the gradual export growth could be linked to market expansion initiatives, product innovation, and targeted marketing efforts to capitalize on international demand for Croatian tanning products.
Key Highlights of the Report:
- Croatia Tanning Agents Market Outlook
- Market Size of Croatia Tanning Agents Market, 2025
- Forecast of Croatia Tanning Agents Market, 2032
- Historical Data and Forecast of Croatia Tanning Agents Revenues & Volume for the Period 2022 - 2032F
- Croatia Tanning Agents Market Trend Evolution
- Croatia Tanning Agents Market Drivers and Challenges
- Croatia Tanning Agents Price Trends
- Croatia Tanning Agents Porter`s Five Forces
- Croatia Tanning Agents Industry Life Cycle
- Historical Data and Forecast of Croatia Tanning Agents Market Revenues & Volume By Type for the Period 2022 - 2032F
- Historical Data and Forecast of Croatia Tanning Agents Market Revenues & Volume By Inorganic Materials for the Period 2022 - 2032F
- Historical Data and Forecast of Croatia Tanning Agents Market Revenues & Volume By Aldehyde Tanning Agents for the Period 2022 - 2032F
- Historical Data and Forecast of Croatia Tanning Agents Market Revenues & Volume By Vegetable Tanning Agents for the Period 2022 - 2032F
- Historical Data and Forecast of Croatia Tanning Agents Market Revenues & Volume By Other Types for the Period 2022 - 2032F
- Historical Data and Forecast of Croatia Tanning Agents Market Revenues & Volume By Application for the Period 2022 - 2032F
- Historical Data and Forecast of Croatia Tanning Agents Market Revenues & Volume By Leather tanning for the Period 2022 - 2032F
- Historical Data and Forecast of Croatia Tanning Agents Market Revenues & Volume By Sun Tanning and Personal Care Products for the Period 2022 - 2032F
- Historical Data and Forecast of Croatia Tanning Agents Market Revenues & Volume By Other Applications for the Period 2022 - 2032F
- Croatia Tanning Agents Import Export Trade Statistics
- Market Opportunity Assessment By Type
- Market Opportunity Assessment By Application
- Croatia Tanning Agents Top Companies Market Share
- Croatia Tanning Agents Competitive Benchmarking By Technical and Operational Parameters
- Croatia Tanning Agents Company Profiles
- Croatia Tanning Agents Key Strategic Recommendations
Frequently Asked Questions About the Market Study (FAQs):
6Wresearch actively monitors the Croatia Tanning Agents Market and publishes its comprehensive annual report, highlighting emerging trends, growth drivers, revenue analysis, and forecast outlook. Our insights help businesses to make data-backed strategic decisions with ongoing market dynamics. Our analysts track relevent industries related to the Croatia Tanning Agents Market, allowing our clients with actionable intelligence and reliable forecasts tailored to emerging regional needs.
Yes, we provide customisation as per your requirements. To learn more, feel free to contact us on sales@6wresearch.com
1 Executive Summary |
2 Introduction |
2.1 Key Highlights of the Report |
2.2 Report Description |
2.3 Market Scope & Segmentation |
2.4 Research Methodology |
2.5 Assumptions |
3 Croatia Tanning Agents Market Overview |
3.1 Croatia Country Macro Economic Indicators |
3.2 Croatia Tanning Agents Market Revenues & Volume, 2022 & 2032F |
3.3 Croatia Tanning Agents Market - Industry Life Cycle |
3.4 Croatia Tanning Agents Market - Porter's Five Forces |
3.5 Croatia Tanning Agents Market Revenues & Volume Share, By Type, 2022 & 2032F |
3.6 Croatia Tanning Agents Market Revenues & Volume Share, By Application, 2022 & 2032F |
4 Croatia Tanning Agents Market Dynamics |
4.1 Impact Analysis |
4.2 Market Drivers |
4.2.1 Growing demand for leather products in the fashion industry |
4.2.2 Increasing disposable income leading to higher spending on luxury goods |
4.2.3 Advancements in tanning technologies leading to improved product quality and efficiency |
4.3 Market Restraints |
4.3.1 Fluctuating raw material prices impacting production costs |
4.3.2 Environmental regulations and sustainability concerns affecting tanning processes |
4.3.3 Competition from synthetic leather substitutes affecting market demand |
5 Croatia Tanning Agents Market Trends |
6 Croatia Tanning Agents Market Segmentations |
6.1 Croatia Tanning Agents Market, By Type |
6.1.1 Overview and Analysis |
6.1.2 Croatia Tanning Agents Market Revenues & Volume, By Inorganic Materials, 2022 - 2032F |
6.1.3 Croatia Tanning Agents Market Revenues & Volume, By Aldehyde Tanning Agents, 2022 - 2032F | 6.1.5 Croatia Tanning Agents Market Revenues & Volume, By Vegetable Tanning Agents, 2022 - 2032F |
6.1.5 Croatia Tanning Agents Market Revenues & Volume, By Other Types, 2022 - 2032F |
6.2 Croatia Tanning Agents Market, By Application |
6.2.1 Overview and Analysis |
6.2.2 Croatia Tanning Agents Market Revenues & Volume, By Leather tanning, 2022 - 2032F |
6.2.3 Croatia Tanning Agents Market Revenues & Volume, By Sun Tanning and Personal Care Products, 2022 - 2032F |
6.2.4 Croatia Tanning Agents Market Revenues & Volume, By Other Applications, 2022 - 2032F |
7 Croatia Tanning Agents Market Import-Export Trade Statistics |
7.1 Croatia Tanning Agents Market Export to Major Countries |
7.2 Croatia Tanning Agents Market Imports from Major Countries |
8 Croatia Tanning Agents Market Key Performance Indicators |
8.1 Adoption rate of eco-friendly tanning processes |
8.2 Number of new product innovations in the tanning agents market |
8.3 Average time taken for product development cycles |
8.4 Percentage of market share held by sustainable tanning agents |
9 Croatia Tanning Agents Market - Opportunity Assessment |
9.1 Croatia Tanning Agents Market Opportunity Assessment, By Type, 2022 & 2032F |
9.2 Croatia Tanning Agents Market Opportunity Assessment, By Application, 2022 & 2032F |
10 Croatia Tanning Agents Market - Competitive Landscape |
10.1 Croatia Tanning Agents Market Revenue Share, By Companies, 2025 |
10.2 Croatia Tanning Agents Market Competitive Benchmarking, By Operating and Technical Parameters |
11 Company Profiles |
12 Recommendations | 13 Disclaimer |
Global Go To Market Strategy - 2030
Export potential enables firms to identify high-growth global markets with greater confidence by combining advanced trade intelligence with a structured quantitative methodology. The framework analyzes emerging demand trends and country-level import patterns while integrating macroeconomic and trade datasets such as GDP and population forecasts, bilateral import–export flows, tariff structures, elasticity differentials between developed and developing economies, geographic distance, and import demand projections. Using weighted trade values from 2020–2024 as the base period to project country-to-country export potential for 2030, these inputs are operationalized through calculated drivers such as gravity model parameters, tariff impact factors, and projected GDP per-capita growth. Through an analysis of hidden potentials, demand hotspots, and market conditions that are most favorable to success, this method enables firms to focus on target countries, maximize returns, and global expansion with data, backed by accuracy.
By factoring in the projected importer demand gap that is currently unmet and could be potential opportunity, it identifies the potential for the Exporter (Country) among 190 countries, against the general trade analysis, which identifies the biggest importer or exporter.
To discover high-growth global markets and optimize your business strategy:
Click Here
Pricing
- Single User License$ 1,995
- Department License$ 2,400
- Site License$ 3,120
- Global License$ 3,795

Leadership Perspectives from Industry Events
Search
Thought Leadership and Analyst Meet


Our Clients
6WResearch In News
- Doha a strategic location for EV manufacturing hub: IPA Qatar
- Demand for luxury TVs surging in the GCC, says Samsung
- Empowering Growth: The Thriving Journey of Bangladesh’s Cable Industry
- Demand for luxury TVs surging in the GCC, says Samsung
- Video call with a traditional healer? Once unthinkable, it’s now common in South Africa
- Intelligent Buildings To Smooth GCC’s Path To Net Zero
Latest Reports
- Taiwan Airport Wireless Infrastructure Market (2026-2032)
- Vietnam Airport Wireless Infrastructure Market (2026-2032)
- Thailand Airport Wireless Infrastructure Market (2026-2032)
- South Korea Airport Wireless Infrastructure Market (2026-2032)
- Romania Airport Wireless Infrastructure Market (2026-2032)
- Qatar Airport Wireless Infrastructure Market (2026-2032)
- Philippines Airport Wireless Infrastructure Market (2026-2032)
- Japan Airport Wireless Infrastructure Market (2026-2032)
- Taiwan Airport Winter Services Market (2026-2032)
- Vietnam Airport Winter Services Market (2026-2032)
Industry Events and Analyst Meet

HIMTEX 2026

India Refining Summit 2026

India EV Show 2026

EV tech India Expo 2026

Auto Tech Asia 2026
Whitepaper
- Middle East & Africa Commercial Security Market Click here to view more.
- Middle East & Africa Fire Safety Systems & Equipment Market Click here to view more.
- GCC Drone Market Click here to view more.
- Middle East Lighting Fixture Market Click here to view more.
- GCC Physical & Perimeter Security Market Click here to view more.