Croatia Tinned Copper Bar Market (2025-2031) | Revenue, Forecast, Segmentation, Growth, Size, Industry, Value, Share, Analysis, Companies, Trends & Outlook
Market Forecast By Type (Full Round, Slightly Round Edge, Square), By Application (Electrical Conductor, Induction Motors, Earthing, Lightning Protection, General Engineering, Switch Gears, Others) And Competitive Landscape
| Product Code: ETC5148851 | Publication Date: Nov 2023 | Updated Date: Apr 2026 | Product Type: Market Research Report | |
| Publisher: 6Wresearch | Author: Shubham Padhi | No. of Pages: 60 | No. of Figures: 30 | No. of Tables: 5 |
Croatia Tinned Copper Bar Market Size (2020-2030)
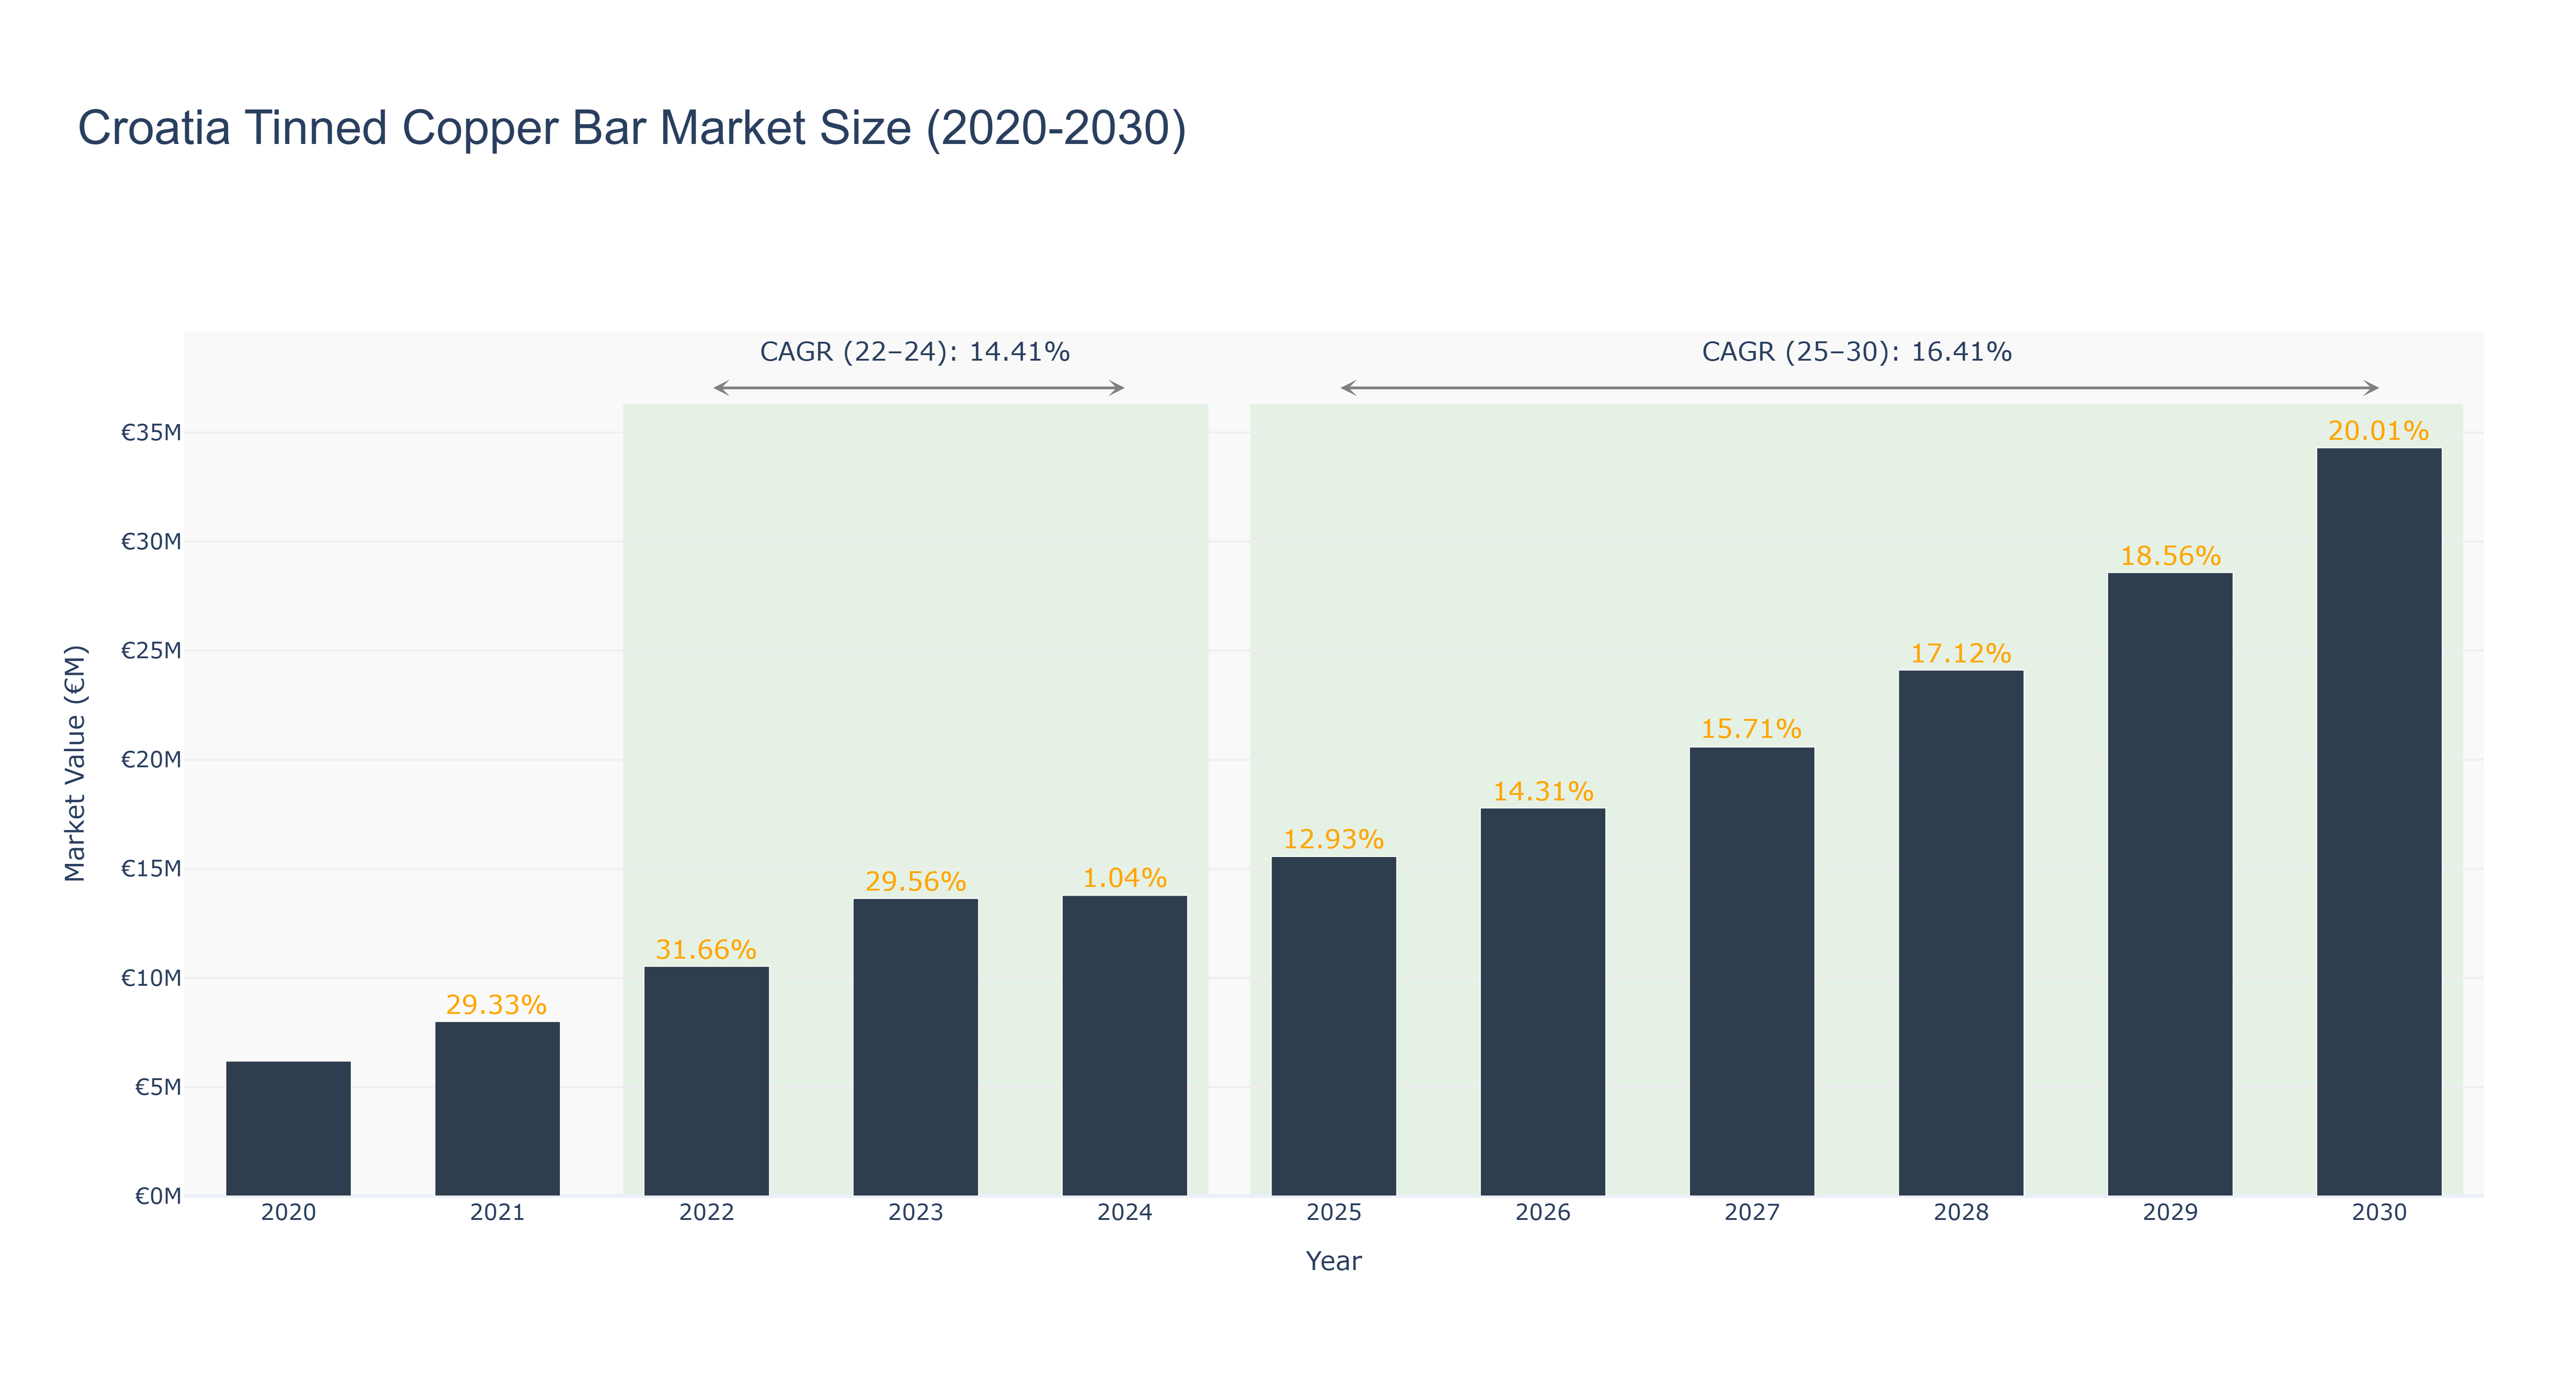
The Croatia Tinned Copper Bar Market has exhibited robust growth, reaching a peak market size of €13.64 million in 2023, with actual growth rates averaging 29.56% from 2021 to 2023. Following a slight deceleration, the market size is projected to stabilize at €13.78 million in 2024, reflecting a modest growth of 1.04%. The forecasted period from 2025 to 2030 anticipates a more dynamic growth trajectory, with a projected CAGR of 16.41%, leading to an estimated market size of €34.30 million by 2030. Key industry drivers include increased demand in construction and electrical sectors, alongside advancements in manufacturing processes. Furthermore, the ongoing push for sustainable practices and the electrification of transportation are likely to amplify demand for copper products. As the market evolves, strategic investments in infrastructure and energy projects may serve as significant catalysts for growth in this period.
Croatia Tinned Copper Bar Market: Production & Trade Performance (2019-2025)
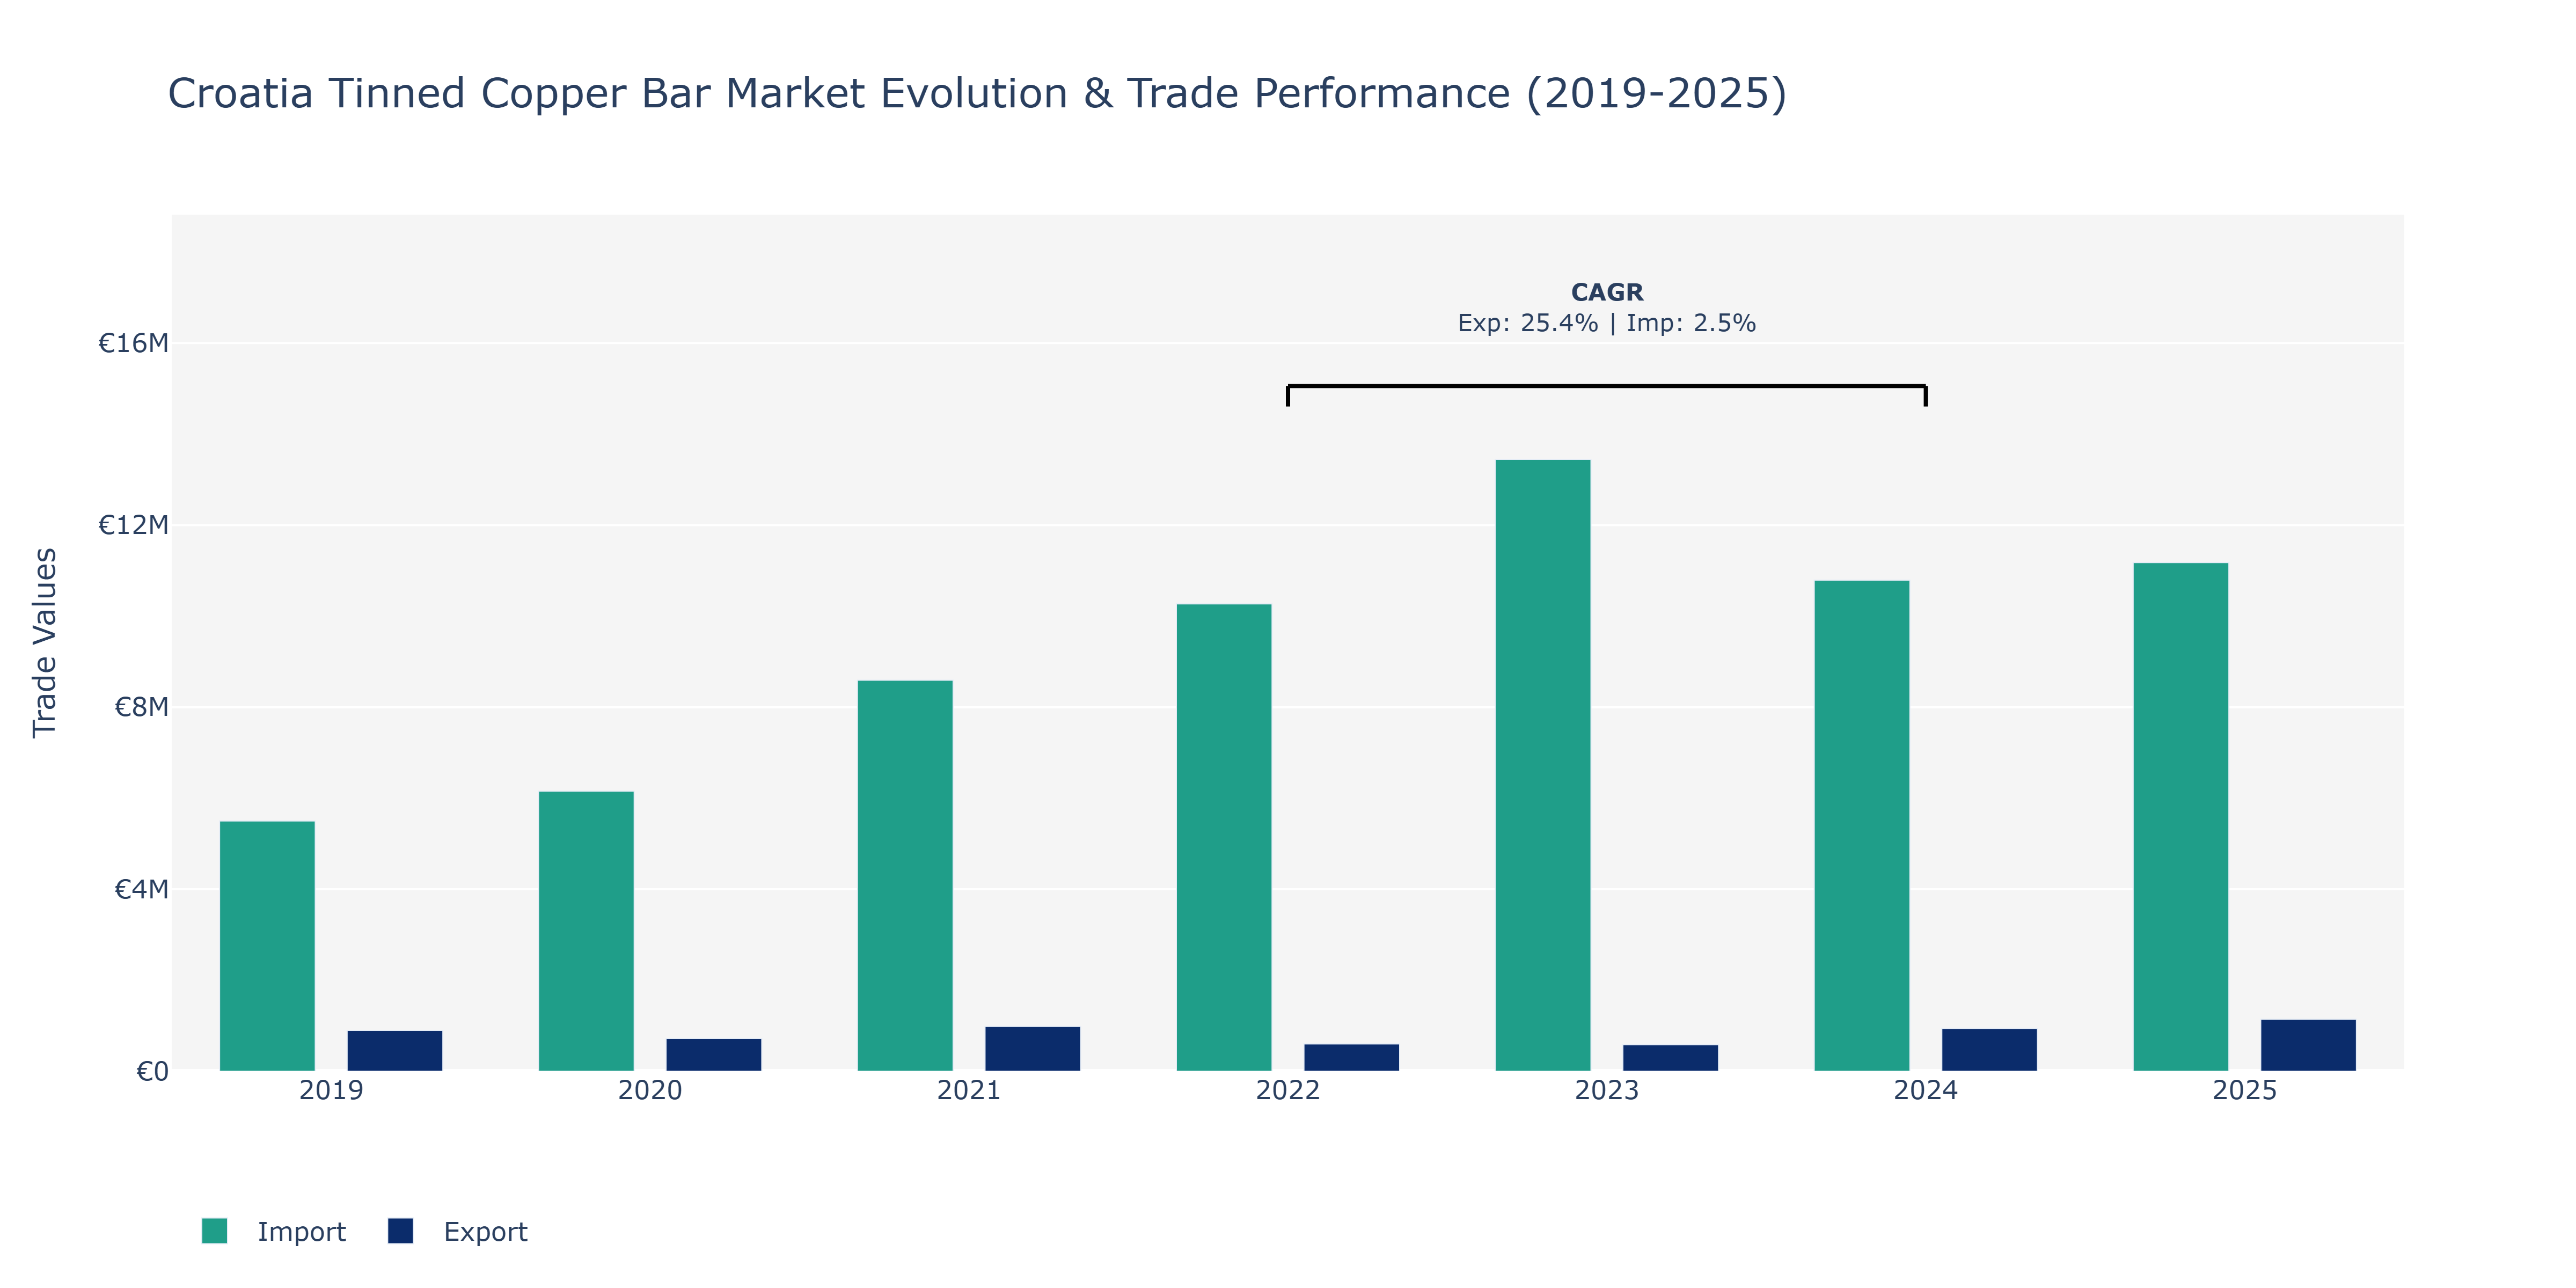
Between 2019 and 2025, Croatia's Tinned Copper Bar Market saw varying trends in exports and imports. The exports witnessed a notable rise from €897.57 thousand in 2019 to €1.14 million in 2025, hitting a peak in 2025. Conversely, imports fluctuated, reaching their highest point in 2023 at €13.44 million, after a continuous increase from 2019. A major factor contributing to the growth in exports could be attributed to increased demand from industries like electronics, construction, and automotive, which are key users of tinned copper bars. On the other hand, the surge in imports may reflect Croatia's reliance on international sources for raw materials, potentially driven by the country's expanding manufacturing sector. The modest growth in imports from 2022 to 2024 aligns with the marginal CAGR of 2.51% during that period, possibly indicating efforts towards import substitution or greater domestic production capabilities.
Key Highlights of the Report:
- Croatia Tinned Copper Bar Market Outlook
- Market Size of Croatia Tinned Copper Bar Market, 2024
- Forecast of Croatia Tinned Copper Bar Market, 2031
- Historical Data and Forecast of Croatia Tinned Copper Bar Revenues & Volume for the Period 2021-2031
- Croatia Tinned Copper Bar Market Trend Evolution
- Croatia Tinned Copper Bar Market Drivers and Challenges
- Croatia Tinned Copper Bar Price Trends
- Croatia Tinned Copper Bar Porter`s Five Forces
- Croatia Tinned Copper Bar Industry Life Cycle
- Historical Data and Forecast of Croatia Tinned Copper Bar Market Revenues & Volume By Type for the Period 2021-2031
- Historical Data and Forecast of Croatia Tinned Copper Bar Market Revenues & Volume By Full Round for the Period 2021-2031
- Historical Data and Forecast of Croatia Tinned Copper Bar Market Revenues & Volume By Slightly Round Edge for the Period 2021-2031
- Historical Data and Forecast of Croatia Tinned Copper Bar Market Revenues & Volume By Square for the Period 2021-2031
- Historical Data and Forecast of Croatia Tinned Copper Bar Market Revenues & Volume By Application for the Period 2021-2031
- Historical Data and Forecast of Croatia Tinned Copper Bar Market Revenues & Volume By Electrical Conductor for the Period 2021-2031
- Historical Data and Forecast of Croatia Tinned Copper Bar Market Revenues & Volume By Induction Motors for the Period 2021-2031
- Historical Data and Forecast of Croatia Tinned Copper Bar Market Revenues & Volume By Earthing for the Period 2021-2031
- Historical Data and Forecast of Croatia Tinned Copper Bar Market Revenues & Volume By Lightning Protection for the Period 2021-2031
- Historical Data and Forecast of Croatia Tinned Copper Bar Market Revenues & Volume By General Engineering for the Period 2021-2031
- Historical Data and Forecast of Croatia Tinned Copper Bar Market Revenues & Volume By Switch Gears for the Period 2021-2031
- Historical Data and Forecast of Croatia Tinned Copper Bar Market Revenues & Volume By Others for the Period 2021-2031
- Croatia Tinned Copper Bar Import Export Trade Statistics
- Market Opportunity Assessment By Type
- Market Opportunity Assessment By Application
- Croatia Tinned Copper Bar Top Companies Market Share
- Croatia Tinned Copper Bar Competitive Benchmarking By Technical and Operational Parameters
- Croatia Tinned Copper Bar Company Profiles
- Croatia Tinned Copper Bar Key Strategic Recommendations
Frequently Asked Questions About the Market Study (FAQs):
6Wresearch actively monitors the Croatia Tinned Copper Bar Market and publishes its comprehensive annual report, highlighting emerging trends, growth drivers, revenue analysis, and forecast outlook. Our insights help businesses to make data-backed strategic decisions with ongoing market dynamics. Our analysts track relevent industries related to the Croatia Tinned Copper Bar Market, allowing our clients with actionable intelligence and reliable forecasts tailored to emerging regional needs.
Yes, we provide customisation as per your requirements. To learn more, feel free to contact us on sales@6wresearch.com
1 Executive Summary |
2 Introduction |
2.1 Key Highlights of the Report |
2.2 Report Description |
2.3 Market Scope & Segmentation |
2.4 Research Methodology |
2.5 Assumptions |
3 Croatia Tinned Copper Bar Market Overview |
3.1 Croatia Country Macro Economic Indicators |
3.2 Croatia Tinned Copper Bar Market Revenues & Volume, 2021 & 2031F |
3.3 Croatia Tinned Copper Bar Market - Industry Life Cycle |
3.4 Croatia Tinned Copper Bar Market - Porter's Five Forces |
3.5 Croatia Tinned Copper Bar Market Revenues & Volume Share, By Type, 2021 & 2031F |
3.6 Croatia Tinned Copper Bar Market Revenues & Volume Share, By Application, 2021 & 2031F |
4 Croatia Tinned Copper Bar Market Dynamics |
4.1 Impact Analysis |
4.2 Market Drivers |
4.2.1 Increasing demand for tinned copper bars in the electronics industry for printed circuit boards and semiconductor applications. |
4.2.2 Growth in the construction sector driving the demand for tinned copper bars for electrical wiring and grounding applications. |
4.2.3 Rising focus on renewable energy sources leading to higher consumption of tinned copper bars for solar panels and wind turbines. |
4.3 Market Restraints |
4.3.1 Fluctuating prices of raw materials such as copper impacting the overall production cost of tinned copper bars. |
4.3.2 Competition from alternative materials like aluminum impacting the market share of tinned copper bars. |
4.3.3 Environmental regulations and sustainability concerns affecting the manufacturing processes of tinned copper bars. |
5 Croatia Tinned Copper Bar Market Trends |
6 Croatia Tinned Copper Bar Market Segmentations |
6.1 Croatia Tinned Copper Bar Market, By Type |
6.1.1 Overview and Analysis |
6.1.2 Croatia Tinned Copper Bar Market Revenues & Volume, By Full Round, 2021-2031F |
6.1.3 Croatia Tinned Copper Bar Market Revenues & Volume, By Slightly Round Edge, 2021-2031F |
6.1.4 Croatia Tinned Copper Bar Market Revenues & Volume, By Square, 2021-2031F |
6.2 Croatia Tinned Copper Bar Market, By Application |
6.2.1 Overview and Analysis |
6.2.2 Croatia Tinned Copper Bar Market Revenues & Volume, By Electrical Conductor, 2021-2031F |
6.2.3 Croatia Tinned Copper Bar Market Revenues & Volume, By Induction Motors, 2021-2031F |
6.2.4 Croatia Tinned Copper Bar Market Revenues & Volume, By Earthing, 2021-2031F |
6.2.5 Croatia Tinned Copper Bar Market Revenues & Volume, By Lightning Protection, 2021-2031F |
6.2.6 Croatia Tinned Copper Bar Market Revenues & Volume, By General Engineering, 2021-2031F |
6.2.7 Croatia Tinned Copper Bar Market Revenues & Volume, By Switch Gears, 2021-2031F |
7 Croatia Tinned Copper Bar Market Import-Export Trade Statistics |
7.1 Croatia Tinned Copper Bar Market Export to Major Countries |
7.2 Croatia Tinned Copper Bar Market Imports from Major Countries |
8 Croatia Tinned Copper Bar Market Key Performance Indicators |
8.1 Percentage of tinned copper bar imports and exports in Croatia. |
8.2 Average selling price of tinned copper bars in the market. |
8.3 Number of new applications or industries adopting tinned copper bars. |
8.4 Percentage of research and development investment in tinned copper bar technology. |
8.5 Energy efficiency improvements in the production processes of tinned copper bars. |
9 Croatia Tinned Copper Bar Market - Opportunity Assessment |
9.1 Croatia Tinned Copper Bar Market Opportunity Assessment, By Type, 2021 & 2031F |
9.2 Croatia Tinned Copper Bar Market Opportunity Assessment, By Application, 2021 & 2031F |
10 Croatia Tinned Copper Bar Market - Competitive Landscape |
10.1 Croatia Tinned Copper Bar Market Revenue Share, By Companies, 2024 |
10.2 Croatia Tinned Copper Bar Market Competitive Benchmarking, By Operating and Technical Parameters |
11 Company Profiles |
12 Recommendations | 13 Disclaimer |
Export potential assessment - trade Analytics for 2030
Export potential enables firms to identify high-growth global markets with greater confidence by combining advanced trade intelligence with a structured quantitative methodology. The framework analyzes emerging demand trends and country-level import patterns while integrating macroeconomic and trade datasets such as GDP and population forecasts, bilateral import–export flows, tariff structures, elasticity differentials between developed and developing economies, geographic distance, and import demand projections. Using weighted trade values from 2020–2024 as the base period to project country-to-country export potential for 2030, these inputs are operationalized through calculated drivers such as gravity model parameters, tariff impact factors, and projected GDP per-capita growth. Through an analysis of hidden potentials, demand hotspots, and market conditions that are most favorable to success, this method enables firms to focus on target countries, maximize returns, and global expansion with data, backed by accuracy.
By factoring in the projected importer demand gap that is currently unmet and could be potential opportunity, it identifies the potential for the Exporter (Country) among 190 countries, against the general trade analysis, which identifies the biggest importer or exporter.
To discover high-growth global markets and optimize your business strategy:
Click Here
Pricing
- Single User License$ 1,995
- Department License$ 2,400
- Site License$ 3,120
- Global License$ 3,795

Search
Thought Leadership and Analyst Meet


Our Clients
Latest Reports
- Canada Cloud CFD Market (2026-2032) | Size & Revenue, Industry, Growth, Competitive Landscape, Forecast, Segmentation, Value, Outlook, Trends, Share, Analysis, Companies
- Taiwan Food Delivery Platform Market (2026-2032) | Companies, Outlook, Analysis, Trends, Value, Revenue, Segmentation, Share, Forecast, Competitive Landscape, Growth, Size & Forecast
- United Kingdom (UK) Long-term Care Insurance Market (2026-2032) | Growth, Share, Consumer Insights, Drivers, Opportunities, Competition, Pricing Analysis, Segments, Restraints, Companies, Competitive, Value, Outlook, Size, Demand, Analysis, Challenges, Strategic Insights, Investment Trends, Revenue, Trends, Supply, Forecast
- United Kingdom (UK) Long Term Care Market (2026-2032) | Companies, Outlook, Analysis, Trends, Value, Revenue, Segmentation, Share, Forecast, Competitive Landscape, Growth, Size & Forecast
- Iraq Insulation and Waterproofing Market (2026-2032) | Outlook, Drivers, Growth, Size, Share, Industry, Revenue, Trends, Demand, Competitive, Strategic Insights, Opportunities, Segments, Companies, Challenges, Strategy, Consumer Insights, Analysis, Investment Trends, Value, Segmentation, Forecast, Restraints
- India Switchgear Market Outlook (2026-2032) | Size, Share, Trends, Growth, Revenue, Forecast, Analysis, Value, Outlook
- Pakistan Contraceptive Implants Market (2025-2031) | Demand, Growth, Size, Share, Industry, Pricing Analysis, Competitive, Strategic Insights, Strategy, Consumer Insights, Analysis, Investment Trends, Opportunities, Revenue, Segments, Value, Segmentation, Supply, Forecast, Restraints, Outlook, Competition, Drivers, Trends, Companies, Challenges
- Sri Lanka Packaging Market (2026-2032) | Outlook, Competition, Drivers, Trends, Demand, Pricing Analysis, Competitive, Strategic Insights, Companies, Challenges, Strategy, Consumer Insights, Analysis, Investment Trends, Opportunities, Growth, Size, Share, Industry, Revenue, Segments, Value, Segmentation, Supply, Forecast, Restraints
- India Kids Watches Market (2026-2032) | Strategy, Consumer Insights, Analysis, Investment Trends, Opportunities, Growth, Size, Share, Industry, Revenue, Segments, Value, Segmentation, Supply, Forecast, Restraints, Outlook, Competition, Drivers, Trends, Demand, Pricing Analysis, Competitive, Strategic Insights, Companies, Challenges
- Saudi Arabia Core Assurance Service Market (2025-2031) | Strategy, Consumer Insights, Analysis, Investment Trends, Opportunities, Growth, Size, Share, Industry, Revenue, Segments, Value, Segmentation, Supply, Forecast, Restraints, Outlook, Competition, Drivers, Trends, Demand, Pricing Analysis, Competitive, Strategic Insights, Companies, Challenges
Industry Events and Analyst Meet

India EV Show 2026

EV tech India Expo 2026

Auto Tech Asia 2026

Battery Tech India 2026

Smart Production Solutions Guangzhou 2026
Whitepaper
- Middle East & Africa Commercial Security Market Click here to view more.
- Middle East & Africa Fire Safety Systems & Equipment Market Click here to view more.
- GCC Drone Market Click here to view more.
- Middle East Lighting Fixture Market Click here to view more.
- GCC Physical & Perimeter Security Market Click here to view more.
6WResearch In News
- Doha a strategic location for EV manufacturing hub: IPA Qatar
- Demand for luxury TVs surging in the GCC, says Samsung
- Empowering Growth: The Thriving Journey of Bangladesh’s Cable Industry
- Demand for luxury TVs surging in the GCC, says Samsung
- Video call with a traditional healer? Once unthinkable, it’s now common in South Africa
- Intelligent Buildings To Smooth GCC’s Path To Net Zero