Croatia Triacetin Market (2026-2032) | Share, Forecast, Size, Value, Segmentation, Growth, Companies, Industry, Trends, Revenue, Outlook & Analysis
Market Forecast By Grade (Tobacco, Food, Industrial), By Product Type (Plasticizer, Solvent, Humectant), By End Use Industry (Tobacco, Food & Beverage, Pharmaceutical, Cosmetic, Chemical) And Competitive Landscape
| Product Code: ETC5651838 | Publication Date: Nov 2023 | Updated Date: Apr 2026 | Product Type: Market Research Report | |
| Publisher: 6Wresearch | Author: Ravi Bhandari | No. of Pages: 60 | No. of Figures: 30 | No. of Tables: 5 |
Croatia Triacetin Market Size (2020-2030)
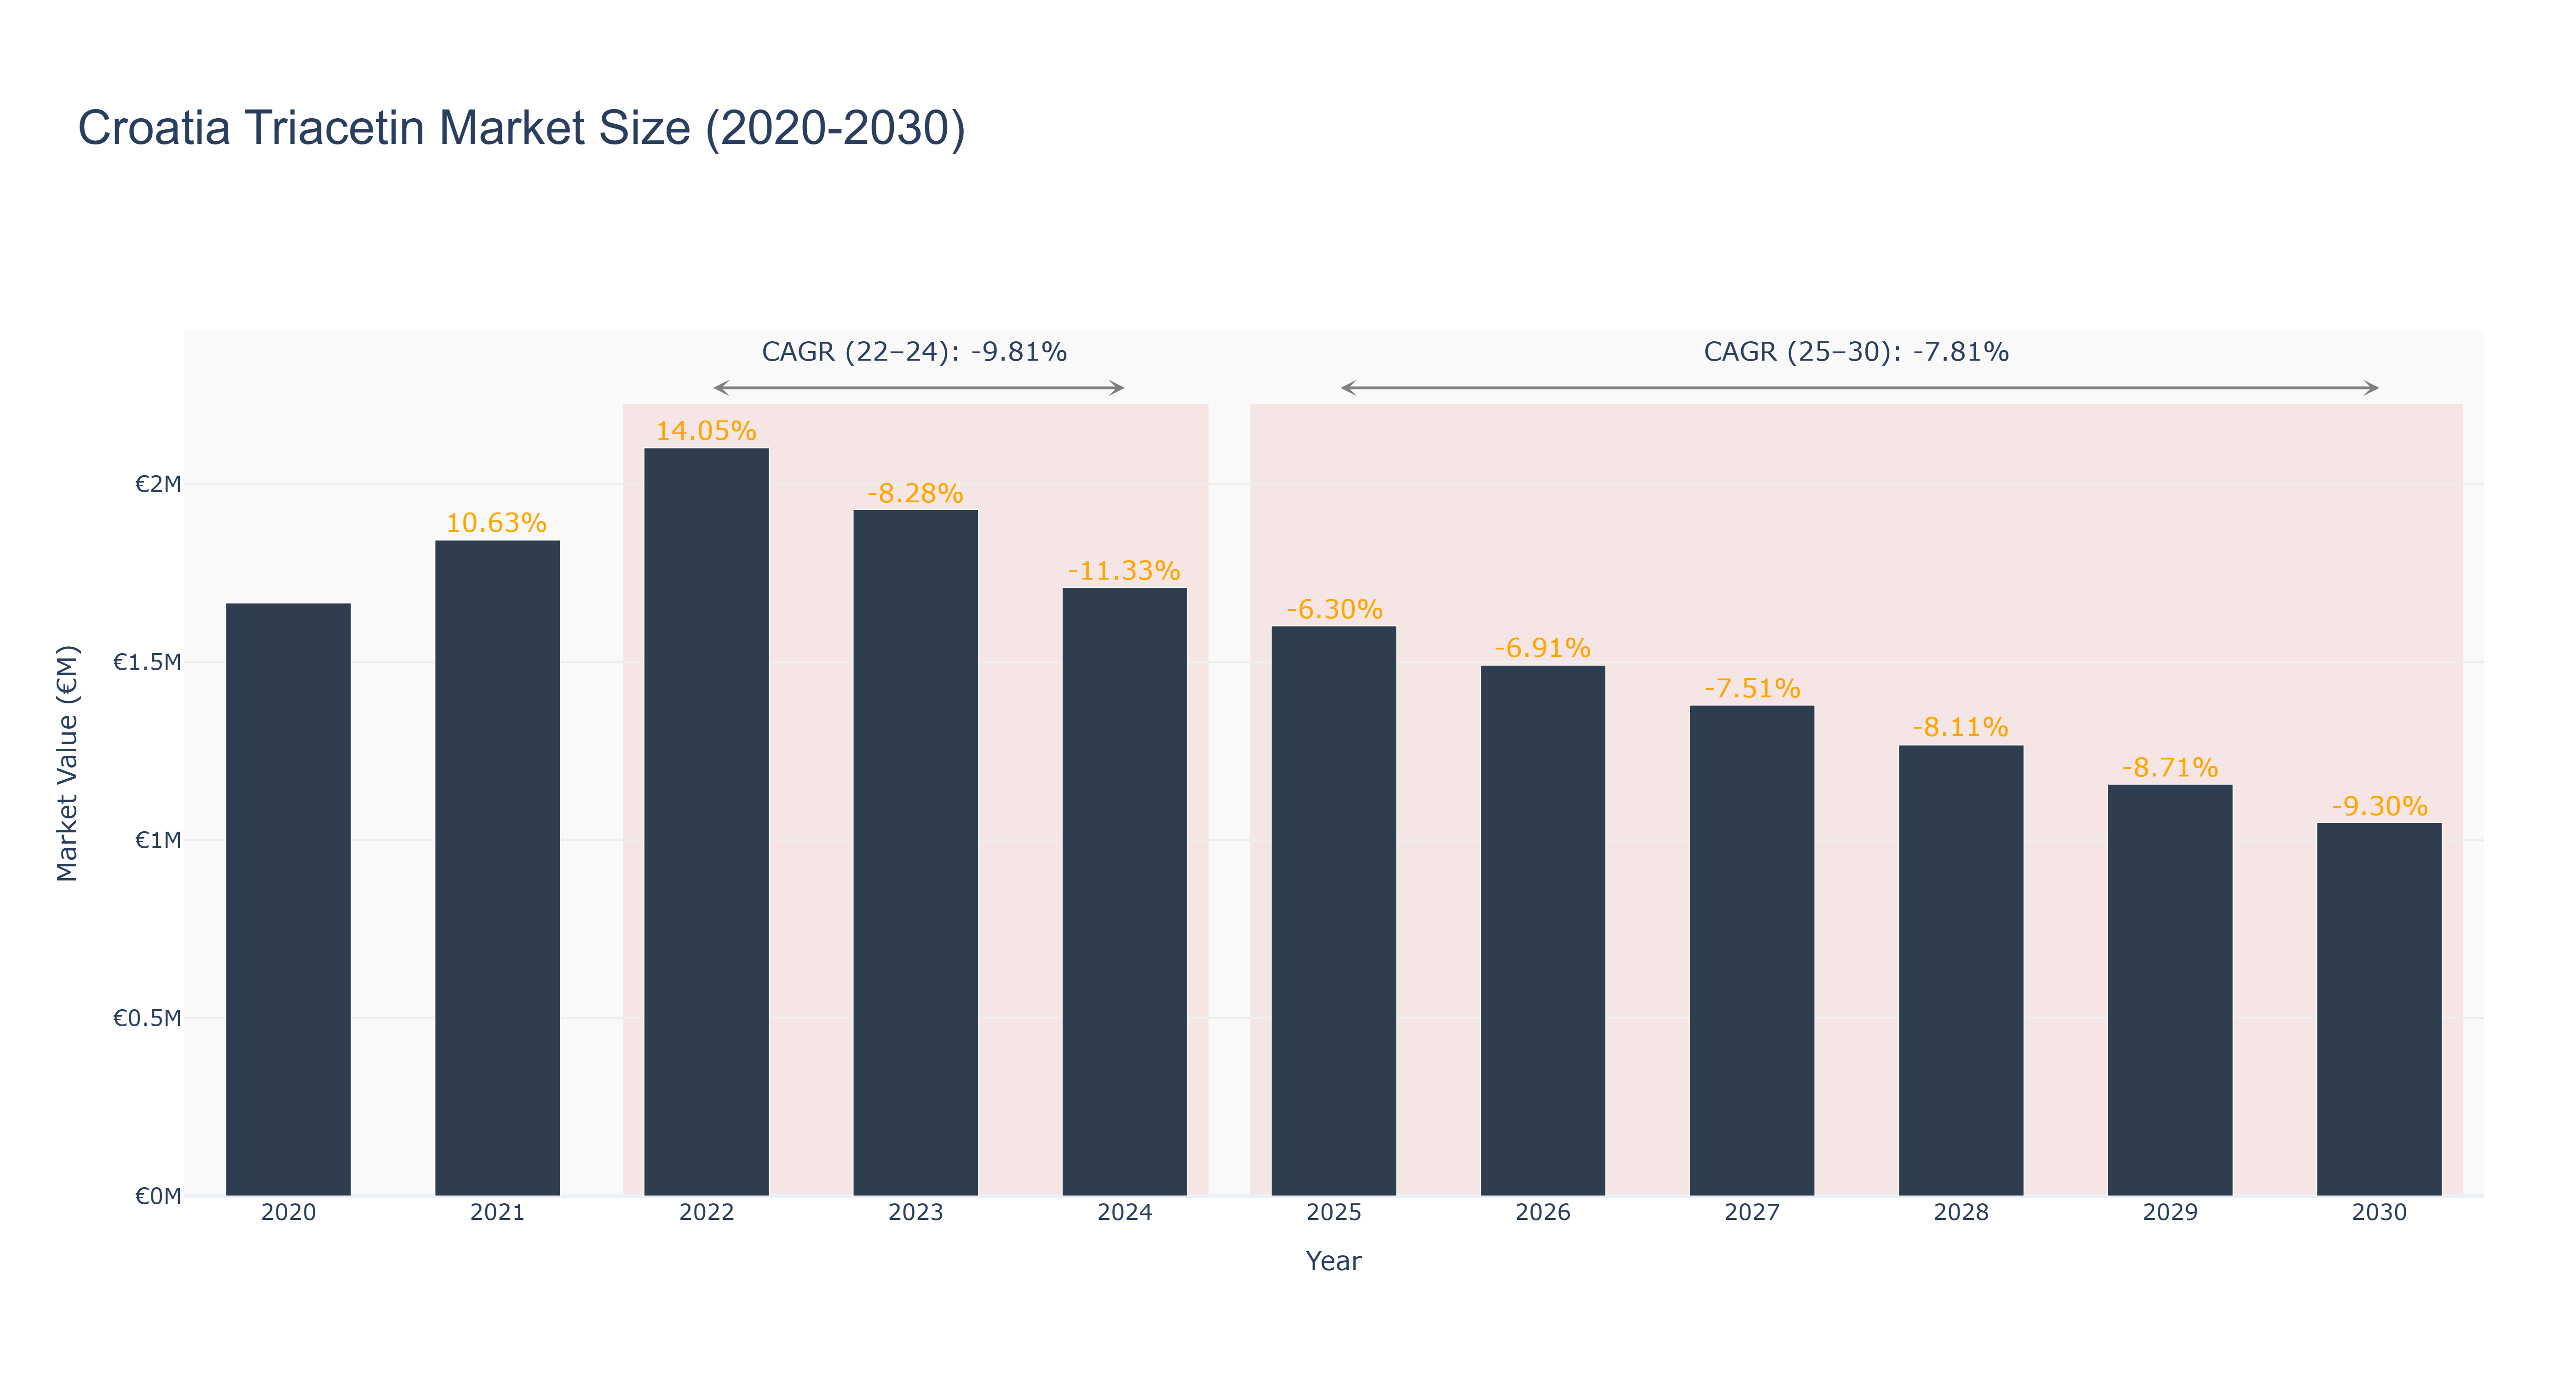
The Croatia Triacetin Market witnessed a peak market size of €2.10 million in 2022, followed by a decline to €1.60 million in 2025. The market is projected to continue shrinking, with a forecasted size of €1.05 million in 2030. The CAGR for the period 2022-24 was -9.81%, reflecting a significant downturn, while the CAGR for 2025-30 is projected at -7.81%. The market's decline can be attributed to factors such as changing consumer preferences, regulatory challenges, and increasing competition. Despite the current challenges, upcoming developments in the biotechnology sector are expected to drive innovation and potentially revitalize the market in the near future. As industry drivers evolve, strategic partnerships and product diversification will play a crucial role in shaping the market landscape for Croatia's Triacetin industry.
Croatia Triacetin Market: Production & Trade Performance (2019-2025)
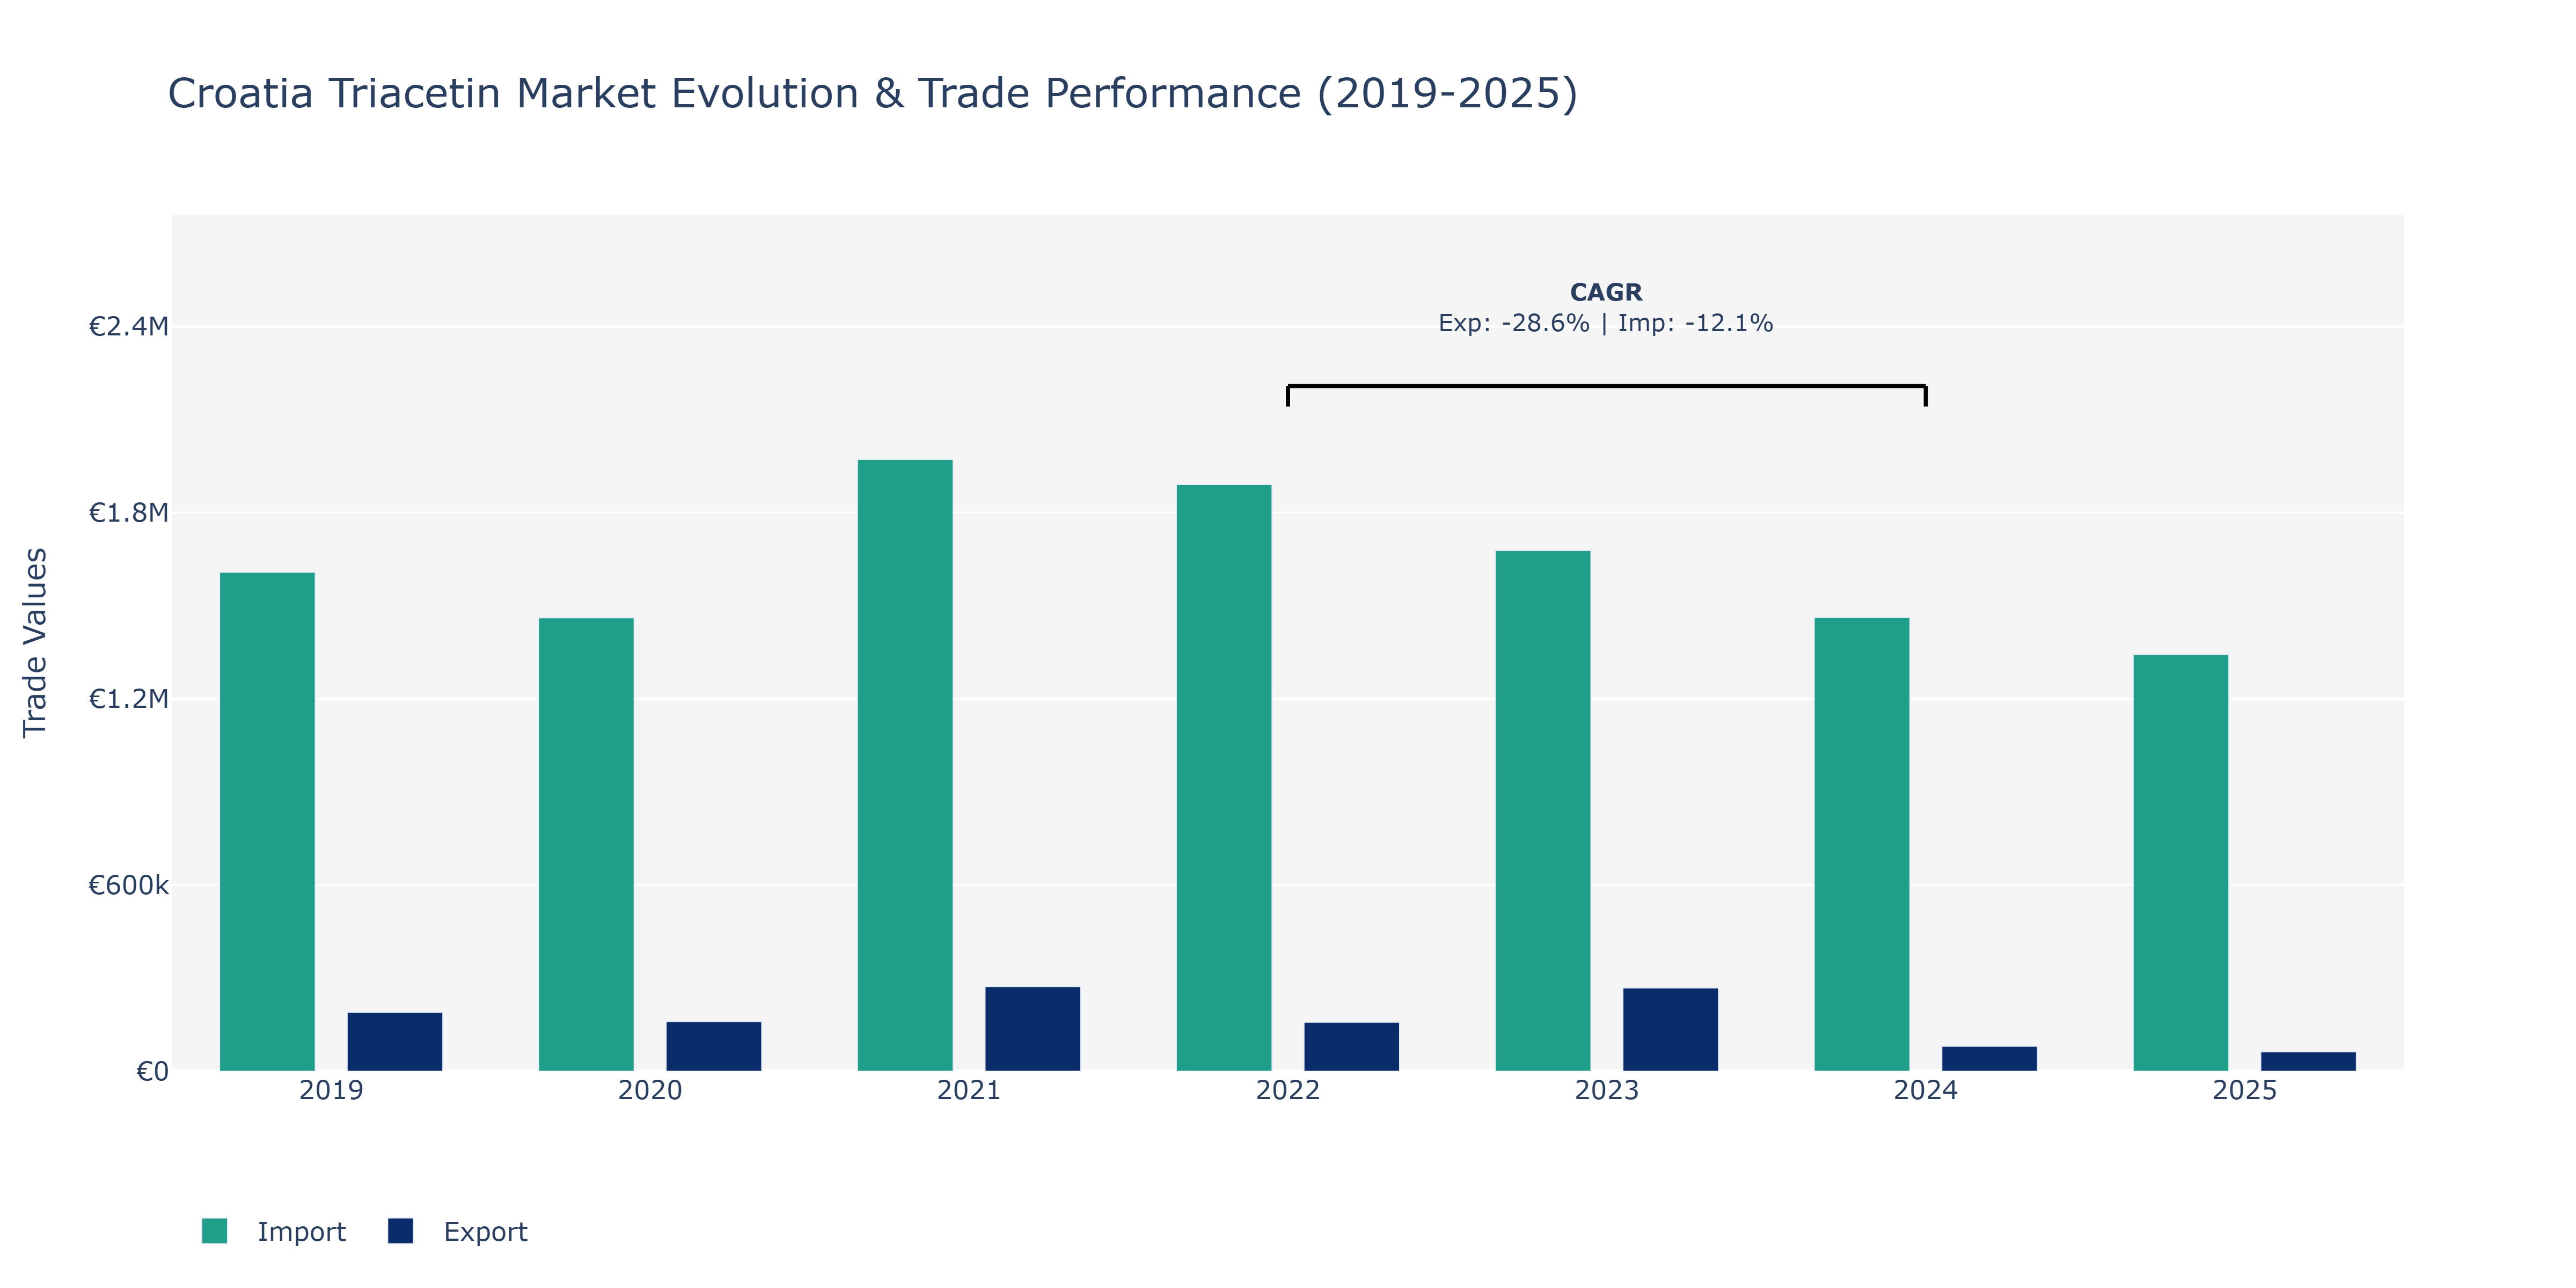
In the Croatia Triacetin Market, exports exhibited notable fluctuations over the years, with a peak in 2021 at €272.93 thousand followed by a substantial decline to €80.5 thousand in 2024. This drastic drop could be attributed to various factors such as shifts in demand, regulatory changes, or competitive pressures affecting production and distribution. Similarly, imports fluctuated, reaching a high of €1.97 million in 2021 before decreasing to €1.34 million in 2025. The decline in imports from 2021 to 2025 might be influenced by changing global trade dynamics, evolving cost structures, or alterations in sourcing strategies within the industry. Despite these fluctuations, the market still shows resilience, and stakeholders may consider diversifying markets or optimizing production processes to navigate future challenges efficiently.
Key Highlights of the Report:
- Croatia Triacetin Market Outlook
- Market Size of Croatia Triacetin Market, 2025
- Forecast of Croatia Triacetin Market, 2032
- Historical Data and Forecast of Croatia Triacetin Revenues & Volume for the Period 2022 - 2032F
- Croatia Triacetin Market Trend Evolution
- Croatia Triacetin Market Drivers and Challenges
- Croatia Triacetin Price Trends
- Croatia Triacetin Porter`s Five Forces
- Croatia Triacetin Industry Life Cycle
- Historical Data and Forecast of Croatia Triacetin Market Revenues & Volume By Grade for the Period 2022 - 2032F
- Historical Data and Forecast of Croatia Triacetin Market Revenues & Volume By Tobacco for the Period 2022 - 2032F
- Historical Data and Forecast of Croatia Triacetin Market Revenues & Volume By Food for the Period 2022 - 2032F
- Historical Data and Forecast of Croatia Triacetin Market Revenues & Volume By Industrial for the Period 2022 - 2032F
- Historical Data and Forecast of Croatia Triacetin Market Revenues & Volume By Product Type for the Period 2022 - 2032F
- Historical Data and Forecast of Croatia Triacetin Market Revenues & Volume By Plasticizer for the Period 2022 - 2032F
- Historical Data and Forecast of Croatia Triacetin Market Revenues & Volume By Solvent for the Period 2022 - 2032F
- Historical Data and Forecast of Croatia Triacetin Market Revenues & Volume By Humectant for the Period 2022 - 2032F
- Historical Data and Forecast of Croatia Triacetin Market Revenues & Volume By End Use Industry for the Period 2022 - 2032F
- Historical Data and Forecast of Croatia Triacetin Market Revenues & Volume By Tobacco for the Period 2022 - 2032F
- Historical Data and Forecast of Croatia Triacetin Market Revenues & Volume By Food & Beverage for the Period 2022 - 2032F
- Historical Data and Forecast of Croatia Triacetin Market Revenues & Volume By Pharmaceutical for the Period 2022 - 2032F
- Historical Data and Forecast of Croatia Triacetin Market Revenues & Volume By Cosmetic for the Period 2022 - 2032F
- Historical Data and Forecast of Croatia Triacetin Market Revenues & Volume By Chemical for the Period 2022 - 2032F
- Croatia Triacetin Import Export Trade Statistics
- Market Opportunity Assessment By Grade
- Market Opportunity Assessment By Product Type
- Market Opportunity Assessment By End Use Industry
- Croatia Triacetin Top Companies Market Share
- Croatia Triacetin Competitive Benchmarking By Technical and Operational Parameters
- Croatia Triacetin Company Profiles
- Croatia Triacetin Key Strategic Recommendations
Frequently Asked Questions About the Market Study (FAQs):
6Wresearch actively monitors the Croatia Triacetin Market and publishes its comprehensive annual report, highlighting emerging trends, growth drivers, revenue analysis, and forecast outlook. Our insights help businesses to make data-backed strategic decisions with ongoing market dynamics. Our analysts track relevent industries related to the Croatia Triacetin Market, allowing our clients with actionable intelligence and reliable forecasts tailored to emerging regional needs.
Yes, we provide customisation as per your requirements. To learn more, feel free to contact us on sales@6wresearch.com
1 Executive Summary |
2 Introduction |
2.1 Key Highlights of the Report |
2.2 Report Description |
2.3 Market Scope & Segmentation |
2.4 Research Methodology |
2.5 Assumptions |
3 Croatia Triacetin Market Overview |
3.1 Croatia Country Macro Economic Indicators |
3.2 Croatia Triacetin Market Revenues & Volume, 2022 & 2032F |
3.3 Croatia Triacetin Market - Industry Life Cycle |
3.4 Croatia Triacetin Market - Porter's Five Forces |
3.5 Croatia Triacetin Market Revenues & Volume Share, By Grade, 2022 & 2032F |
3.6 Croatia Triacetin Market Revenues & Volume Share, By Product Type, 2022 & 2032F |
3.7 Croatia Triacetin Market Revenues & Volume Share, By End Use Industry, 2022 & 2032F |
4 Croatia Triacetin Market Dynamics |
4.1 Impact Analysis |
4.2 Market Drivers |
4.2.1 Growing demand for food additives and flavorings |
4.2.2 Increasing use of triacetin in pharmaceuticals and cosmetics |
4.2.3 Favorable regulatory environment supporting the use of triacetin in various industries |
4.3 Market Restraints |
4.3.1 Fluctuating prices of raw materials |
4.3.2 Competition from alternative products |
4.3.3 Environmental concerns related to the production and use of triacetin |
5 Croatia Triacetin Market Trends |
6 Croatia Triacetin Market Segmentations |
6.1 Croatia Triacetin Market, By Grade |
6.1.1 Overview and Analysis |
6.1.2 Croatia Triacetin Market Revenues & Volume, By Tobacco, 2022 - 2032F |
6.1.3 Croatia Triacetin Market Revenues & Volume, By Food, 2022 - 2032F |
6.1.4 Croatia Triacetin Market Revenues & Volume, By Industrial, 2022 - 2032F |
6.2 Croatia Triacetin Market, By Product Type |
6.2.1 Overview and Analysis |
6.2.2 Croatia Triacetin Market Revenues & Volume, By Plasticizer, 2022 - 2032F |
6.2.3 Croatia Triacetin Market Revenues & Volume, By Solvent, 2022 - 2032F |
6.2.4 Croatia Triacetin Market Revenues & Volume, By Humectant, 2022 - 2032F |
6.3 Croatia Triacetin Market, By End Use Industry |
6.3.1 Overview and Analysis |
6.3.2 Croatia Triacetin Market Revenues & Volume, By Tobacco, 2022 - 2032F |
6.3.3 Croatia Triacetin Market Revenues & Volume, By Food & Beverage, 2022 - 2032F |
6.3.4 Croatia Triacetin Market Revenues & Volume, By Pharmaceutical, 2022 - 2032F |
6.3.5 Croatia Triacetin Market Revenues & Volume, By Cosmetic, 2022 - 2032F |
6.3.6 Croatia Triacetin Market Revenues & Volume, By Chemical, 2022 - 2032F |
7 Croatia Triacetin Market Import-Export Trade Statistics |
7.1 Croatia Triacetin Market Export to Major Countries |
7.2 Croatia Triacetin Market Imports from Major Countries |
8 Croatia Triacetin Market Key Performance Indicators |
8.1 Research and development investment in new applications of triacetin |
8.2 Number of patents filed for triacetin-related technologies |
8.3 Adoption rate of triacetin in new industries |
8.4 Innovation in triacetin manufacturing processes |
8.5 Regulatory approvals for triacetin use in different applications |
9 Croatia Triacetin Market - Opportunity Assessment |
9.1 Croatia Triacetin Market Opportunity Assessment, By Grade, 2022 & 2032F |
9.2 Croatia Triacetin Market Opportunity Assessment, By Product Type, 2022 & 2032F |
9.3 Croatia Triacetin Market Opportunity Assessment, By End Use Industry, 2022 & 2032F |
10 Croatia Triacetin Market - Competitive Landscape |
10.1 Croatia Triacetin Market Revenue Share, By Companies, 2025 |
10.2 Croatia Triacetin Market Competitive Benchmarking, By Operating and Technical Parameters |
11 Company Profiles |
12 Recommendations | 13 Disclaimer |
Export potential assessment - trade Analytics for 2030
Export potential enables firms to identify high-growth global markets with greater confidence by combining advanced trade intelligence with a structured quantitative methodology. The framework analyzes emerging demand trends and country-level import patterns while integrating macroeconomic and trade datasets such as GDP and population forecasts, bilateral import–export flows, tariff structures, elasticity differentials between developed and developing economies, geographic distance, and import demand projections. Using weighted trade values from 2020–2024 as the base period to project country-to-country export potential for 2030, these inputs are operationalized through calculated drivers such as gravity model parameters, tariff impact factors, and projected GDP per-capita growth. Through an analysis of hidden potentials, demand hotspots, and market conditions that are most favorable to success, this method enables firms to focus on target countries, maximize returns, and global expansion with data, backed by accuracy.
By factoring in the projected importer demand gap that is currently unmet and could be potential opportunity, it identifies the potential for the Exporter (Country) among 190 countries, against the general trade analysis, which identifies the biggest importer or exporter.
To discover high-growth global markets and optimize your business strategy:
Click Here
Pricing
- Single User License$ 1,995
- Department License$ 2,400
- Site License$ 3,120
- Global License$ 3,795

Search
Thought Leadership and Analyst Meet


Our Clients
Latest Reports
- Canada Cloud CFD Market (2026-2032) | Size & Revenue, Industry, Growth, Competitive Landscape, Forecast, Segmentation, Value, Outlook, Trends, Share, Analysis, Companies
- Taiwan Food Delivery Platform Market (2026-2032) | Companies, Outlook, Analysis, Trends, Value, Revenue, Segmentation, Share, Forecast, Competitive Landscape, Growth, Size & Forecast
- United Kingdom (UK) Long-term Care Insurance Market (2026-2032) | Growth, Share, Consumer Insights, Drivers, Opportunities, Competition, Pricing Analysis, Segments, Restraints, Companies, Competitive, Value, Outlook, Size, Demand, Analysis, Challenges, Strategic Insights, Investment Trends, Revenue, Trends, Supply, Forecast
- United Kingdom (UK) Long Term Care Market (2026-2032) | Companies, Outlook, Analysis, Trends, Value, Revenue, Segmentation, Share, Forecast, Competitive Landscape, Growth, Size & Forecast
- Iraq Insulation and Waterproofing Market (2026-2032) | Outlook, Drivers, Growth, Size, Share, Industry, Revenue, Trends, Demand, Competitive, Strategic Insights, Opportunities, Segments, Companies, Challenges, Strategy, Consumer Insights, Analysis, Investment Trends, Value, Segmentation, Forecast, Restraints
- India Switchgear Market Outlook (2026-2032) | Size, Share, Trends, Growth, Revenue, Forecast, Analysis, Value, Outlook
- Pakistan Contraceptive Implants Market (2025-2031) | Demand, Growth, Size, Share, Industry, Pricing Analysis, Competitive, Strategic Insights, Strategy, Consumer Insights, Analysis, Investment Trends, Opportunities, Revenue, Segments, Value, Segmentation, Supply, Forecast, Restraints, Outlook, Competition, Drivers, Trends, Companies, Challenges
- Sri Lanka Packaging Market (2026-2032) | Outlook, Competition, Drivers, Trends, Demand, Pricing Analysis, Competitive, Strategic Insights, Companies, Challenges, Strategy, Consumer Insights, Analysis, Investment Trends, Opportunities, Growth, Size, Share, Industry, Revenue, Segments, Value, Segmentation, Supply, Forecast, Restraints
- India Kids Watches Market (2026-2032) | Strategy, Consumer Insights, Analysis, Investment Trends, Opportunities, Growth, Size, Share, Industry, Revenue, Segments, Value, Segmentation, Supply, Forecast, Restraints, Outlook, Competition, Drivers, Trends, Demand, Pricing Analysis, Competitive, Strategic Insights, Companies, Challenges
- Saudi Arabia Core Assurance Service Market (2025-2031) | Strategy, Consumer Insights, Analysis, Investment Trends, Opportunities, Growth, Size, Share, Industry, Revenue, Segments, Value, Segmentation, Supply, Forecast, Restraints, Outlook, Competition, Drivers, Trends, Demand, Pricing Analysis, Competitive, Strategic Insights, Companies, Challenges
Industry Events and Analyst Meet

India EV Show 2026

EV tech India Expo 2026

Auto Tech Asia 2026

Battery Tech India 2026

Smart Production Solutions Guangzhou 2026
Whitepaper
- Middle East & Africa Commercial Security Market Click here to view more.
- Middle East & Africa Fire Safety Systems & Equipment Market Click here to view more.
- GCC Drone Market Click here to view more.
- Middle East Lighting Fixture Market Click here to view more.
- GCC Physical & Perimeter Security Market Click here to view more.
6WResearch In News
- Doha a strategic location for EV manufacturing hub: IPA Qatar
- Demand for luxury TVs surging in the GCC, says Samsung
- Empowering Growth: The Thriving Journey of Bangladesh’s Cable Industry
- Demand for luxury TVs surging in the GCC, says Samsung
- Video call with a traditional healer? Once unthinkable, it’s now common in South Africa
- Intelligent Buildings To Smooth GCC’s Path To Net Zero