Croatia Wiring Duct Market (2026-2032) | Share, Segments, Strategic Insights, Demand, Pricing Analysis, Consumer Insights, Forecast, Industry, Supply, Size, Strategy, Investment Trends, Growth, Companies, Drivers, Analysis, Segmentation, Outlook, Revenue, Trends, Competition, Restraints, Challenges, Value, Competitive, Opportunities
Market Forecast By Type (Slotted, Solid, Flexible, Others), By Application (Control Panels, Distribution Panels, Switchgear, Others), By End User (Industrial, Commercial, Residential, Others) And Competitive Landscape
| Product Code: ETC10463573 | Publication Date: Apr 2025 | Updated Date: Apr 2026 | Product Type: Market Research Report | |
| Publisher: 6Wresearch | Author: Bhawna Singh | No. of Pages: 65 | No. of Figures: 34 | No. of Tables: 19 |
Croatia Wiring Duct Market Size (2020-2030)
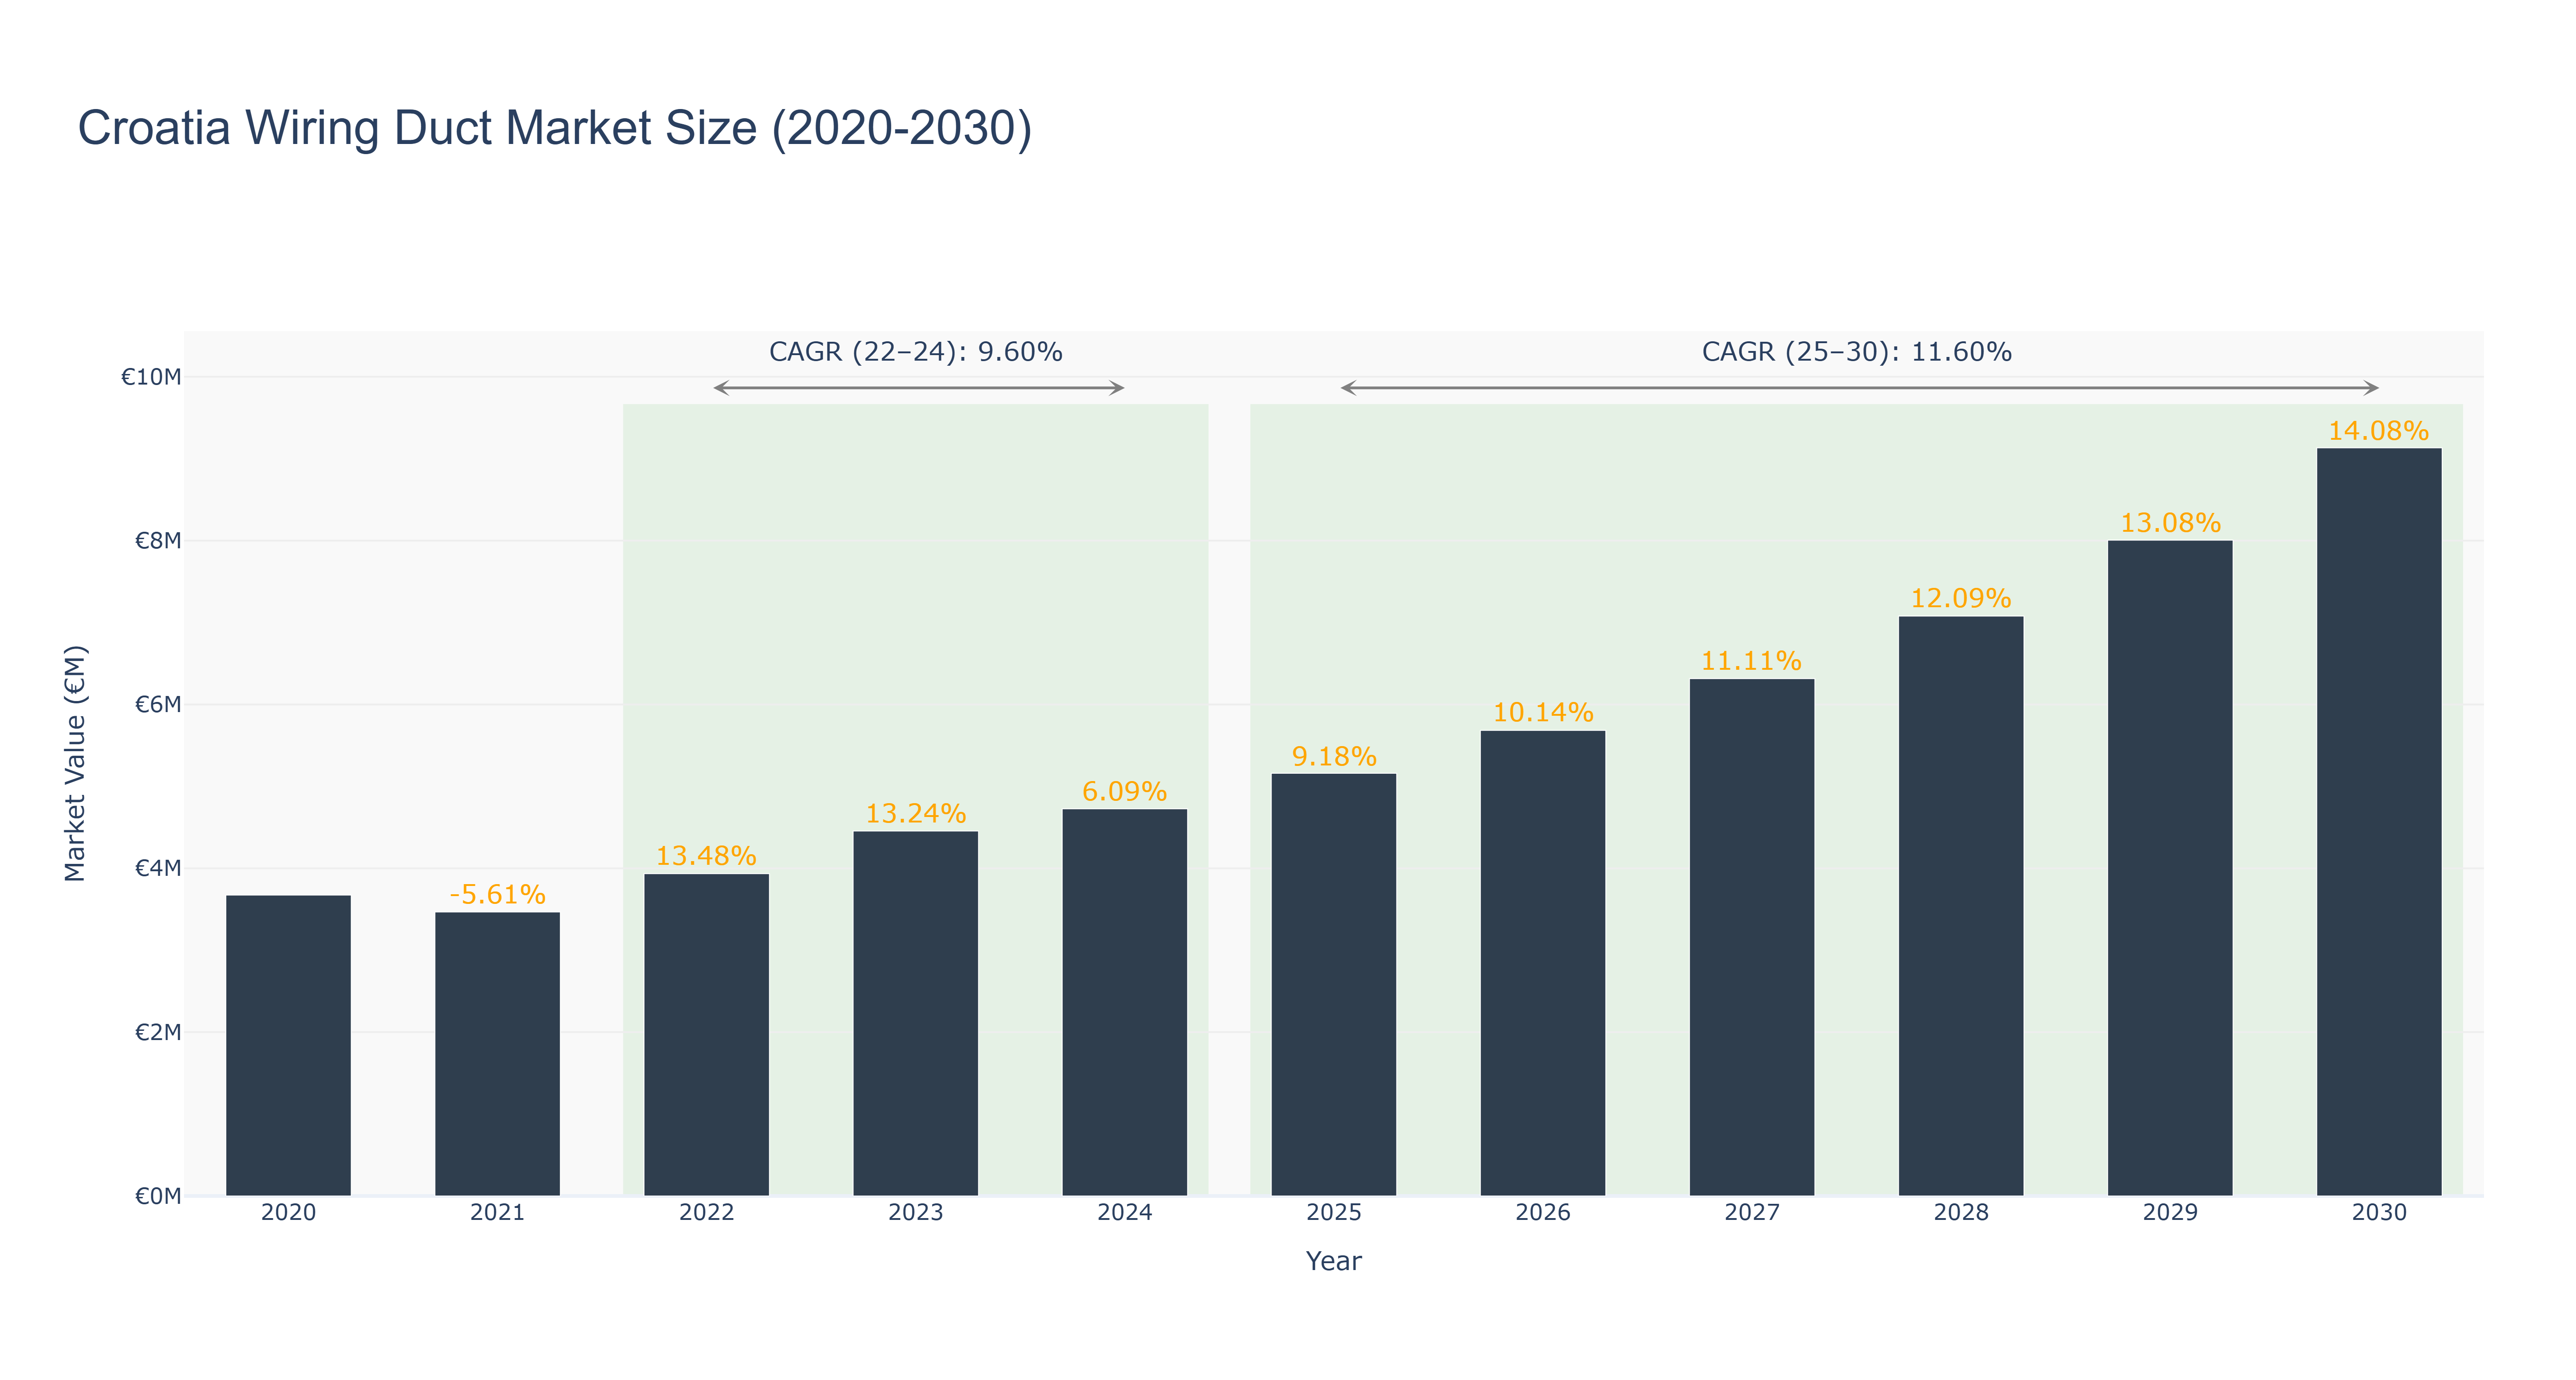
Croatia Wiring Duct Market has shown a steady growth trajectory over the years. The peak market size of €9.13 million is forecasted for 2030 with a strong CAGR of 14.08% from 2025 to 2030. The market experienced a slight decline in 2021 with a size of €3.47 million, attributed to external economic factors. However, from 2022 to 2030, the market has consistently expanded, driven by increasing demand for wiring solutions in various industries. The CAGR of 9.60% from 2022 to 2024 and 11.60% from 2025 to 2030 indicates a robust growth potential. Looking ahead, Croatia is planning to implement smart city projects that will boost the demand for advanced wiring infrastructure, further fueling the market growth.
Croatia Wiring Duct Market: Production & Trade Performance (2019-2025)
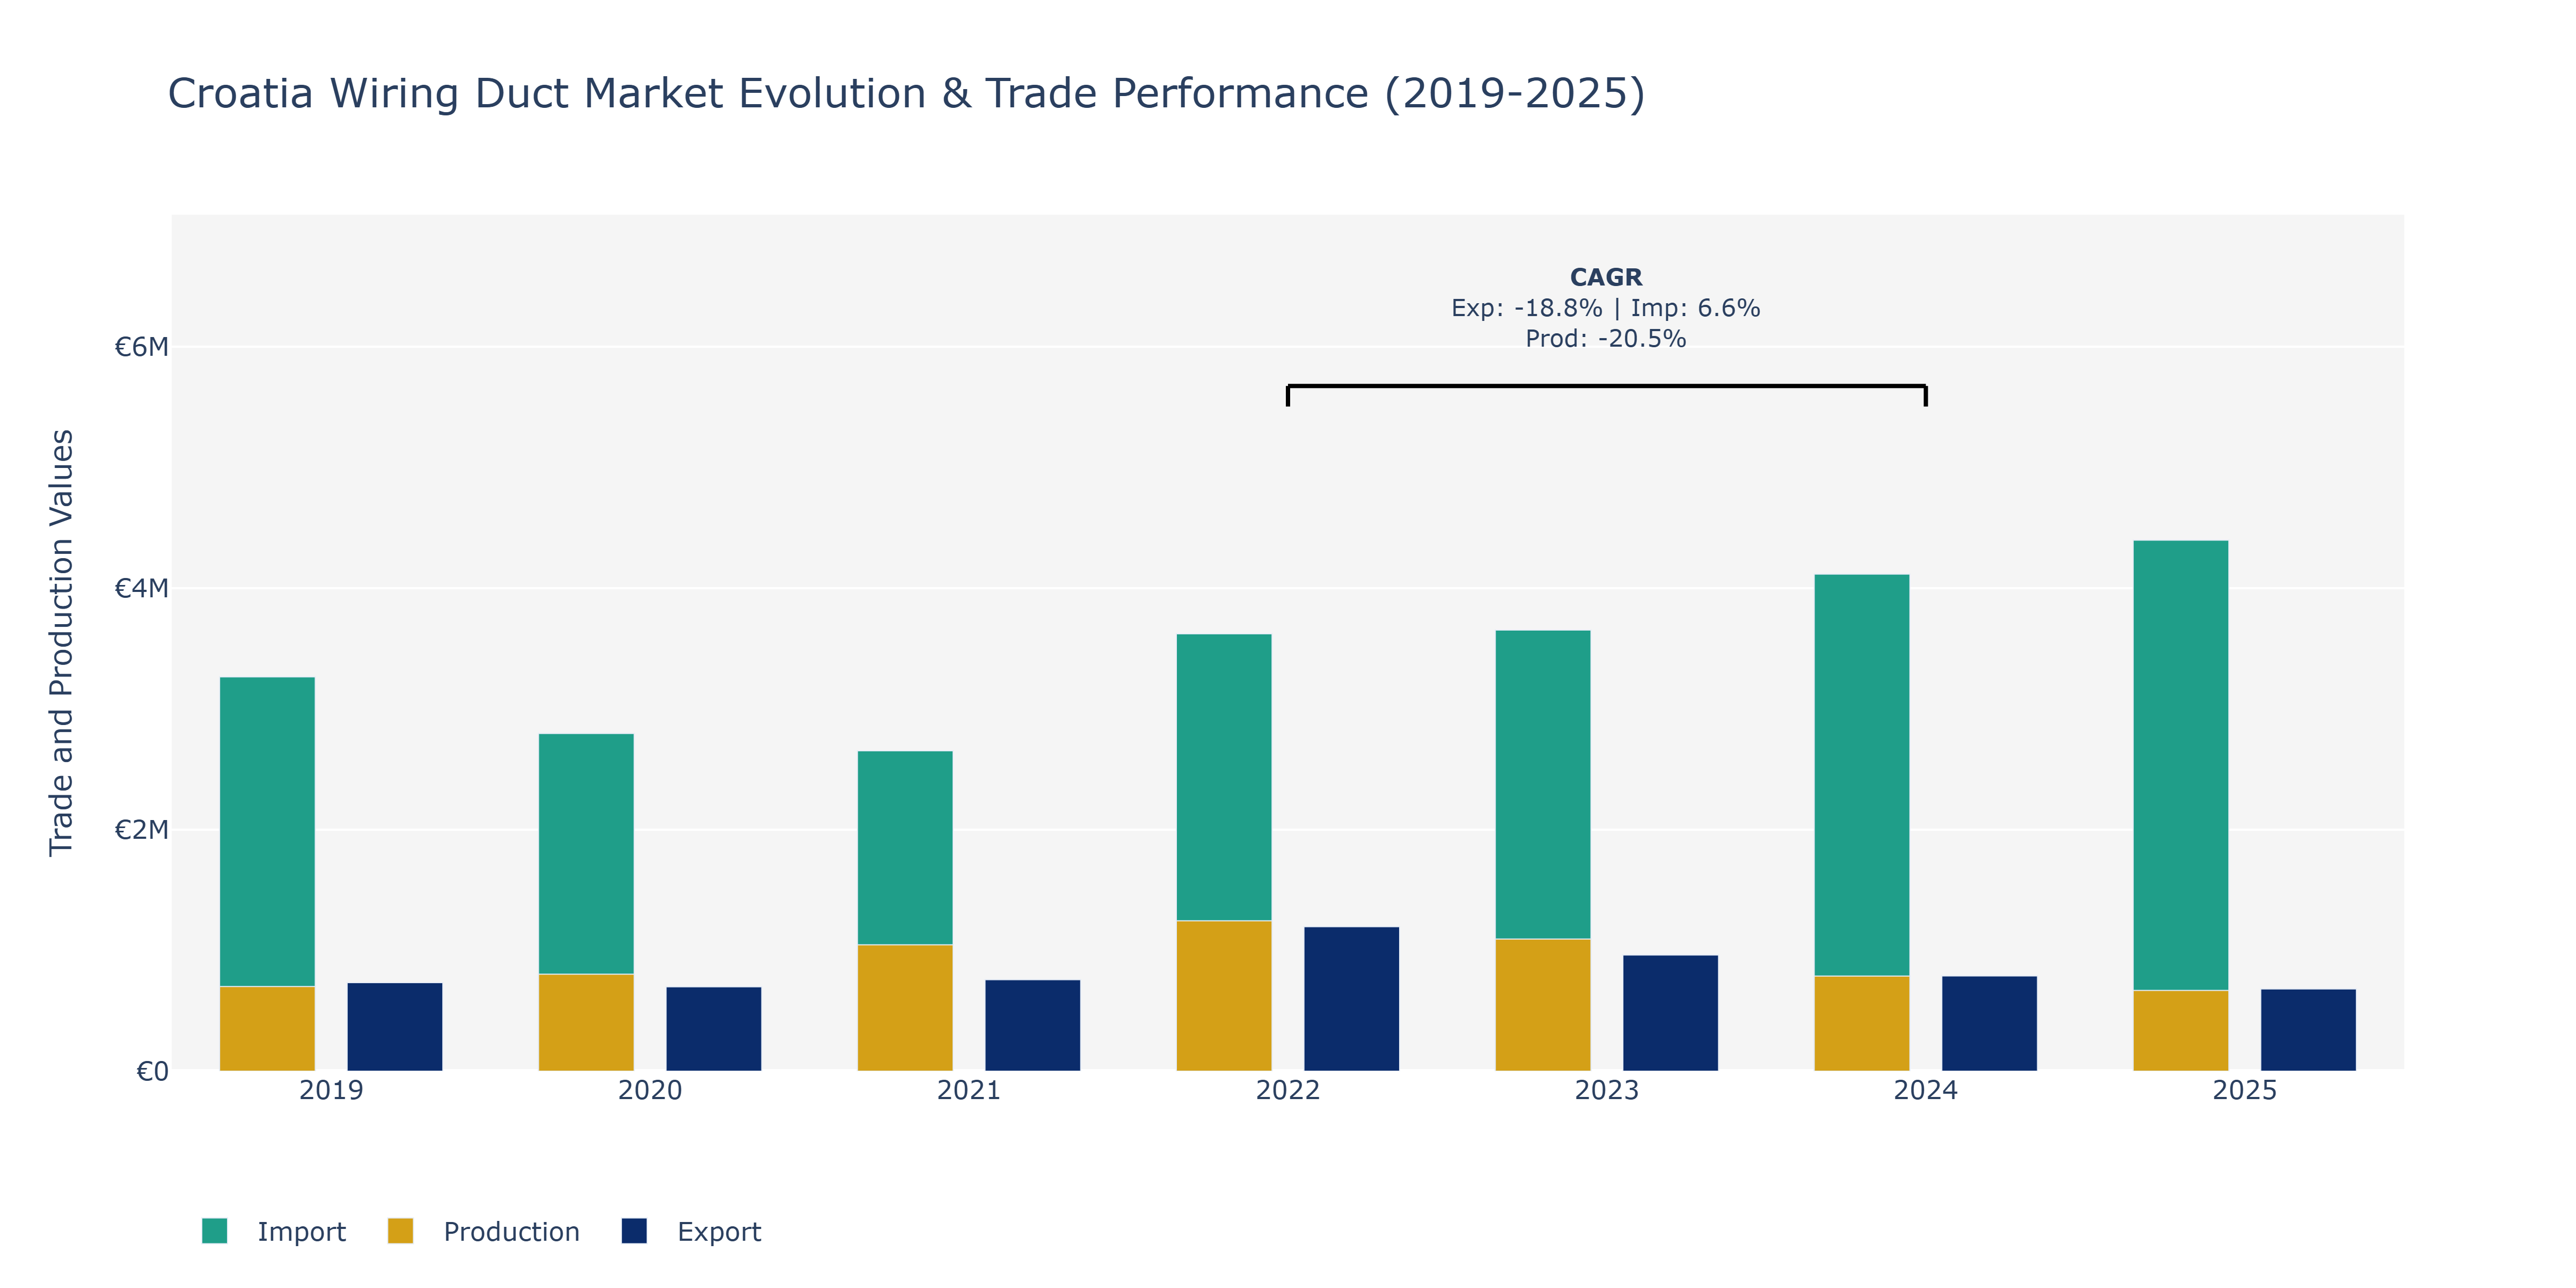
In the Croatia Wiring Duct Market, from 2019 to 2025, Exports experienced fluctuations. Starting at €733.15 thousand in 2019, they decreased to €681.23 thousand in 2025, with a peak of €1.2 million in 2022. This decline could be attributed to global economic uncertainties affecting demand. Imports, on the other hand, showed a steady increase from €3.27 million in 2019 to €4.4 million in 2025, with a notable peak in 2024 at €4.12 million. This upward trend may be linked to increased infrastructure projects in Croatia, leading to higher demand for wiring duct materials. Production value fluctuated, reaching a peak of €1.25 million in 2022 and then decreasing to €669.21 thousand in 2025. The decline in production could be associated with shifts in manufacturing technologies or changes in local supply chains impacting output levels. These movements highlight the market's sensitivity to both local and global economic conditions, necessitating adaptable strategies for stakeholders to navigate changing landscapes effectively.
Key Highlights of the Report:
- Croatia Wiring Duct Market Outlook
- Market Size of Croatia Wiring Duct Market, 2025
- Forecast of Croatia Wiring Duct Market, 2032
- Historical Data and Forecast of Croatia Wiring Duct Revenues & Volume for the Period 2022 - 2032F
- Croatia Wiring Duct Market Trend Evolution
- Croatia Wiring Duct Market Drivers and Challenges
- Croatia Wiring Duct Price Trends
- Croatia Wiring Duct Porter's Five Forces
- Croatia Wiring Duct Industry Life Cycle
- Historical Data and Forecast of Croatia Wiring Duct Market Revenues & Volume By Type for the Period 2022 - 2032F
- Historical Data and Forecast of Croatia Wiring Duct Market Revenues & Volume By Slotted for the Period 2022 - 2032F
- Historical Data and Forecast of Croatia Wiring Duct Market Revenues & Volume By Solid for the Period 2022 - 2032F
- Historical Data and Forecast of Croatia Wiring Duct Market Revenues & Volume By Flexible for the Period 2022 - 2032F
- Historical Data and Forecast of Croatia Wiring Duct Market Revenues & Volume By Others for the Period 2022 - 2032F
- Historical Data and Forecast of Croatia Wiring Duct Market Revenues & Volume By Application for the Period 2022 - 2032F
- Historical Data and Forecast of Croatia Wiring Duct Market Revenues & Volume By Control Panels for the Period 2022 - 2032F
- Historical Data and Forecast of Croatia Wiring Duct Market Revenues & Volume By Distribution Panels for the Period 2022 - 2032F
- Historical Data and Forecast of Croatia Wiring Duct Market Revenues & Volume By Switchgear for the Period 2022 - 2032F
- Historical Data and Forecast of Croatia Wiring Duct Market Revenues & Volume By Others for the Period 2022 - 2032F
- Historical Data and Forecast of Croatia Wiring Duct Market Revenues & Volume By End User for the Period 2022 - 2032F
- Historical Data and Forecast of Croatia Wiring Duct Market Revenues & Volume By Industrial for the Period 2022 - 2032F
- Historical Data and Forecast of Croatia Wiring Duct Market Revenues & Volume By Commercial for the Period 2022 - 2032F
- Historical Data and Forecast of Croatia Wiring Duct Market Revenues & Volume By Residential for the Period 2022 - 2032F
- Historical Data and Forecast of Croatia Wiring Duct Market Revenues & Volume By Others for the Period 2022 - 2032F
- Croatia Wiring Duct Import Export Trade Statistics
- Market Opportunity Assessment By Type
- Market Opportunity Assessment By Application
- Market Opportunity Assessment By End User
- Croatia Wiring Duct Top Companies Market Share
- Croatia Wiring Duct Competitive Benchmarking By Technical and Operational Parameters
- Croatia Wiring Duct Company Profiles
- Croatia Wiring Duct Key Strategic Recommendations
Frequently Asked Questions About the Market Study (FAQs):
6Wresearch actively monitors the Croatia Wiring Duct Market and publishes its comprehensive annual report, highlighting emerging trends, growth drivers, revenue analysis, and forecast outlook. Our insights help businesses to make data-backed strategic decisions with ongoing market dynamics. Our analysts track relevent industries related to the Croatia Wiring Duct Market, allowing our clients with actionable intelligence and reliable forecasts tailored to emerging regional needs.
Yes, we provide customisation as per your requirements. To learn more, feel free to contact us on sales@6wresearch.com
1 Executive Summary |
2 Introduction |
2.1 Key Highlights of the Report |
2.2 Report Description |
2.3 Market Scope & Segmentation |
2.4 Research Methodology |
2.5 Assumptions |
3 Croatia Wiring Duct Market Overview |
3.1 Croatia Country Macro Economic Indicators |
3.2 Croatia Wiring Duct Market Revenues & Volume, 2022 & 2032F |
3.3 Croatia Wiring Duct Market - Industry Life Cycle |
3.4 Croatia Wiring Duct Market - Porter's Five Forces |
3.5 Croatia Wiring Duct Market Revenues & Volume Share, By Type, 2022 & 2032F |
3.6 Croatia Wiring Duct Market Revenues & Volume Share, By Application, 2022 & 2032F |
3.7 Croatia Wiring Duct Market Revenues & Volume Share, By End User, 2022 & 2032F |
4 Croatia Wiring Duct Market Dynamics |
4.1 Impact Analysis |
4.2 Market Drivers |
4.2.1 Increasing demand for energy-efficient solutions in buildings and infrastructure projects |
4.2.2 Growing investments in industrial automation and control systems |
4.2.3 Rise in construction activities and smart building projects in Croatia |
4.3 Market Restraints |
4.3.1 Availability of alternative cable management solutions impacting the demand for wiring ducts |
4.3.2 Fluctuating raw material prices affecting the production costs |
4.3.3 Stringent regulations and standards for electrical installations impacting market growth |
5 Croatia Wiring Duct Market Trends |
6 Croatia Wiring Duct Market, By Types |
6.1 Croatia Wiring Duct Market, By Type |
6.1.1 Overview and Analysis |
6.1.2 Croatia Wiring Duct Market Revenues & Volume, By Type, 2022 - 2032F |
6.1.3 Croatia Wiring Duct Market Revenues & Volume, By Slotted, 2022 - 2032F |
6.1.4 Croatia Wiring Duct Market Revenues & Volume, By Solid, 2022 - 2032F |
6.1.5 Croatia Wiring Duct Market Revenues & Volume, By Flexible, 2022 - 2032F |
6.1.6 Croatia Wiring Duct Market Revenues & Volume, By Others, 2022 - 2032F |
6.2 Croatia Wiring Duct Market, By Application |
6.2.1 Overview and Analysis |
6.2.2 Croatia Wiring Duct Market Revenues & Volume, By Control Panels, 2022 - 2032F |
6.2.3 Croatia Wiring Duct Market Revenues & Volume, By Distribution Panels, 2022 - 2032F |
6.2.4 Croatia Wiring Duct Market Revenues & Volume, By Switchgear, 2022 - 2032F |
6.2.5 Croatia Wiring Duct Market Revenues & Volume, By Others, 2022 - 2032F |
6.3 Croatia Wiring Duct Market, By End User |
6.3.1 Overview and Analysis |
6.3.2 Croatia Wiring Duct Market Revenues & Volume, By Industrial, 2022 - 2032F |
6.3.3 Croatia Wiring Duct Market Revenues & Volume, By Commercial, 2022 - 2032F |
6.3.4 Croatia Wiring Duct Market Revenues & Volume, By Residential, 2022 - 2032F |
6.3.5 Croatia Wiring Duct Market Revenues & Volume, By Others, 2022 - 2032F |
7 Croatia Wiring Duct Market Import-Export Trade Statistics |
7.1 Croatia Wiring Duct Market Export to Major Countries |
7.2 Croatia Wiring Duct Market Imports from Major Countries |
8 Croatia Wiring Duct Market Key Performance Indicators |
8.1 Adoption rate of smart building technologies in Croatia |
8.2 Number of industrial automation projects in the country |
8.3 Growth in the number of construction permits issued for residential and commercial buildings in Croatia |
9 Croatia Wiring Duct Market - Opportunity Assessment |
9.1 Croatia Wiring Duct Market Opportunity Assessment, By Type, 2022 & 2032F |
9.2 Croatia Wiring Duct Market Opportunity Assessment, By Application, 2022 & 2032F |
9.3 Croatia Wiring Duct Market Opportunity Assessment, By End User, 2022 & 2032F |
10 Croatia Wiring Duct Market - Competitive Landscape |
10.1 Croatia Wiring Duct Market Revenue Share, By Companies, 2025 |
10.2 Croatia Wiring Duct Market Competitive Benchmarking, By Operating and Technical Parameters |
11 Company Profiles |
12 Recommendations |
13 Disclaimer |
Export potential assessment - trade Analytics for 2030
Export potential enables firms to identify high-growth global markets with greater confidence by combining advanced trade intelligence with a structured quantitative methodology. The framework analyzes emerging demand trends and country-level import patterns while integrating macroeconomic and trade datasets such as GDP and population forecasts, bilateral import–export flows, tariff structures, elasticity differentials between developed and developing economies, geographic distance, and import demand projections. Using weighted trade values from 2020–2024 as the base period to project country-to-country export potential for 2030, these inputs are operationalized through calculated drivers such as gravity model parameters, tariff impact factors, and projected GDP per-capita growth. Through an analysis of hidden potentials, demand hotspots, and market conditions that are most favorable to success, this method enables firms to focus on target countries, maximize returns, and global expansion with data, backed by accuracy.
By factoring in the projected importer demand gap that is currently unmet and could be potential opportunity, it identifies the potential for the Exporter (Country) among 190 countries, against the general trade analysis, which identifies the biggest importer or exporter.
To discover high-growth global markets and optimize your business strategy:
Click Here
Pricing
- Single User License$ 1,995
- Department License$ 2,400
- Site License$ 3,120
- Global License$ 3,795

Search
Thought Leadership and Analyst Meet


Our Clients
Latest Reports
- China Electric Appliance Rental Market (2026-2032) | Trends, Revenue, Growth, Challenges, Size, Value, Outlook, Pricing, Strategy, Insights, Restraints, segmentation, Companies, Investment Opportunities, Analysis, Demand, Drivers, Competition, Forecast, Share
- Chile Electric Appliance Rental Market (2026-2032) | Outlook, Competition, Drivers, Strategy, Revenue, Analysis, Value, Pricing, Restraints, Size, Demand, Share, Growth, Forecast, Challenges, Insights, Investment Opportunities, Companies, Trends, segmentation
- Cambodia Electric Appliance Rental Market (2026-2032) | Companies, Analysis, Restraints, Pricing, Insights, Challenges, Outlook, Strategy, Forecast, Trends, Competition, Value, Revenue, Investment Opportunities, segmentation, Drivers, Size, Demand, Growth, Share
- Brazil Electric Appliance Rental Market (2026-2032) | Revenue, Strategy, Forecast, Companies, segmentation, Competition, Size, Investment Opportunities, Pricing, Restraints, Outlook, Challenges, Analysis, Drivers, Value, Demand, Insights, Trends, Growth, Share
- Bangladesh Electric Appliance Rental Market (2026-2032) | Drivers, Forecast, Investment Opportunities, Strategy, Insights, Demand, Challenges, Outlook, Trends, Competition, Value, Revenue, Size, Pricing, Analysis, Companies, Restraints, segmentation, Share, Growth
- Bahrain Electric Appliance Rental Market (2026-2032) | Outlook, Size, Competition, Restraints, Drivers, Value, Trends, Investment Opportunities, Insights, Forecast, Revenue, Strategy, Growth, Share, Demand, Analysis, Challenges, Companies, segmentation, Pricing
- Azerbaijan Electric Appliance Rental Market (2026-2032) | Trends, Investment Opportunities, Restraints, Insights, Strategy, Competition, Value, Growth, Demand, Drivers, Analysis, Forecast, Size, Share, Outlook, segmentation, Pricing, Challenges, Revenue, Companies
- Australia Electric Appliance Rental Market (2026-2032) | Challenges, Restraints, Forecast, Demand, Size, Competition, Pricing, Investment Opportunities, Revenue, Trends, Drivers, Growth, Outlook, Analysis, Strategy, Value, segmentation, Insights, Companies, Share
- Argentina Electric Appliance Rental Market (2026-2032) | Growth, Trends, Insights, Outlook, Forecast, Size, Drivers, Analysis, Restraints, Challenges, Share, Revenue, Investment Opportunities, Strategy, Demand, Value, Companies, segmentation, Competition, Pricing
- Algeria Electric Appliance Rental Market (2026-2032) | Share, Size, Value, Strategy, Competition, Outlook, Challenges, Companies, Trends, Pricing, Insights, Forecast, Investment Opportunities, Revenue, Growth, Restraints, segmentation, Analysis, Demand, Drivers
Industry Events and Analyst Meet

HIMTEX 2026

India Refining Summit 2026

India EV Show 2026

EV tech India Expo 2026

Auto Tech Asia 2026
Whitepaper
- Middle East & Africa Commercial Security Market Click here to view more.
- Middle East & Africa Fire Safety Systems & Equipment Market Click here to view more.
- GCC Drone Market Click here to view more.
- Middle East Lighting Fixture Market Click here to view more.
- GCC Physical & Perimeter Security Market Click here to view more.
6WResearch In News
- Doha a strategic location for EV manufacturing hub: IPA Qatar
- Demand for luxury TVs surging in the GCC, says Samsung
- Empowering Growth: The Thriving Journey of Bangladesh’s Cable Industry
- Demand for luxury TVs surging in the GCC, says Samsung
- Video call with a traditional healer? Once unthinkable, it’s now common in South Africa
- Intelligent Buildings To Smooth GCC’s Path To Net Zero