Cyprus Direct Reduced Iron (DRI) Market (2025-2031) | Forecast, Analysis, Growth, Segmentation, Outlook, Share, Companies, Industry, Size & Revenue, Value, Competitive Landscape, Trends
Market Forecast By Form (Pellets, Lumps), By Production Process (Gas-based, Coal-based), By Grade (Grade A (FeM 81% Min), Grade B (FeM 78 To 80 %), Grade C (FeM < 78%)) And Competitive Landscape
| Product Code: ETC6892871 | Publication Date: Sep 2024 | Updated Date: Apr 2026 | Product Type: Market Research Report | |
| Publisher: 6Wresearch | Author: Sumit Sagar | No. of Pages: 75 | No. of Figures: 35 | No. of Tables: 20 |
Cyprus Direct Reduced Iron (Dri) Market Size (2020-2030)
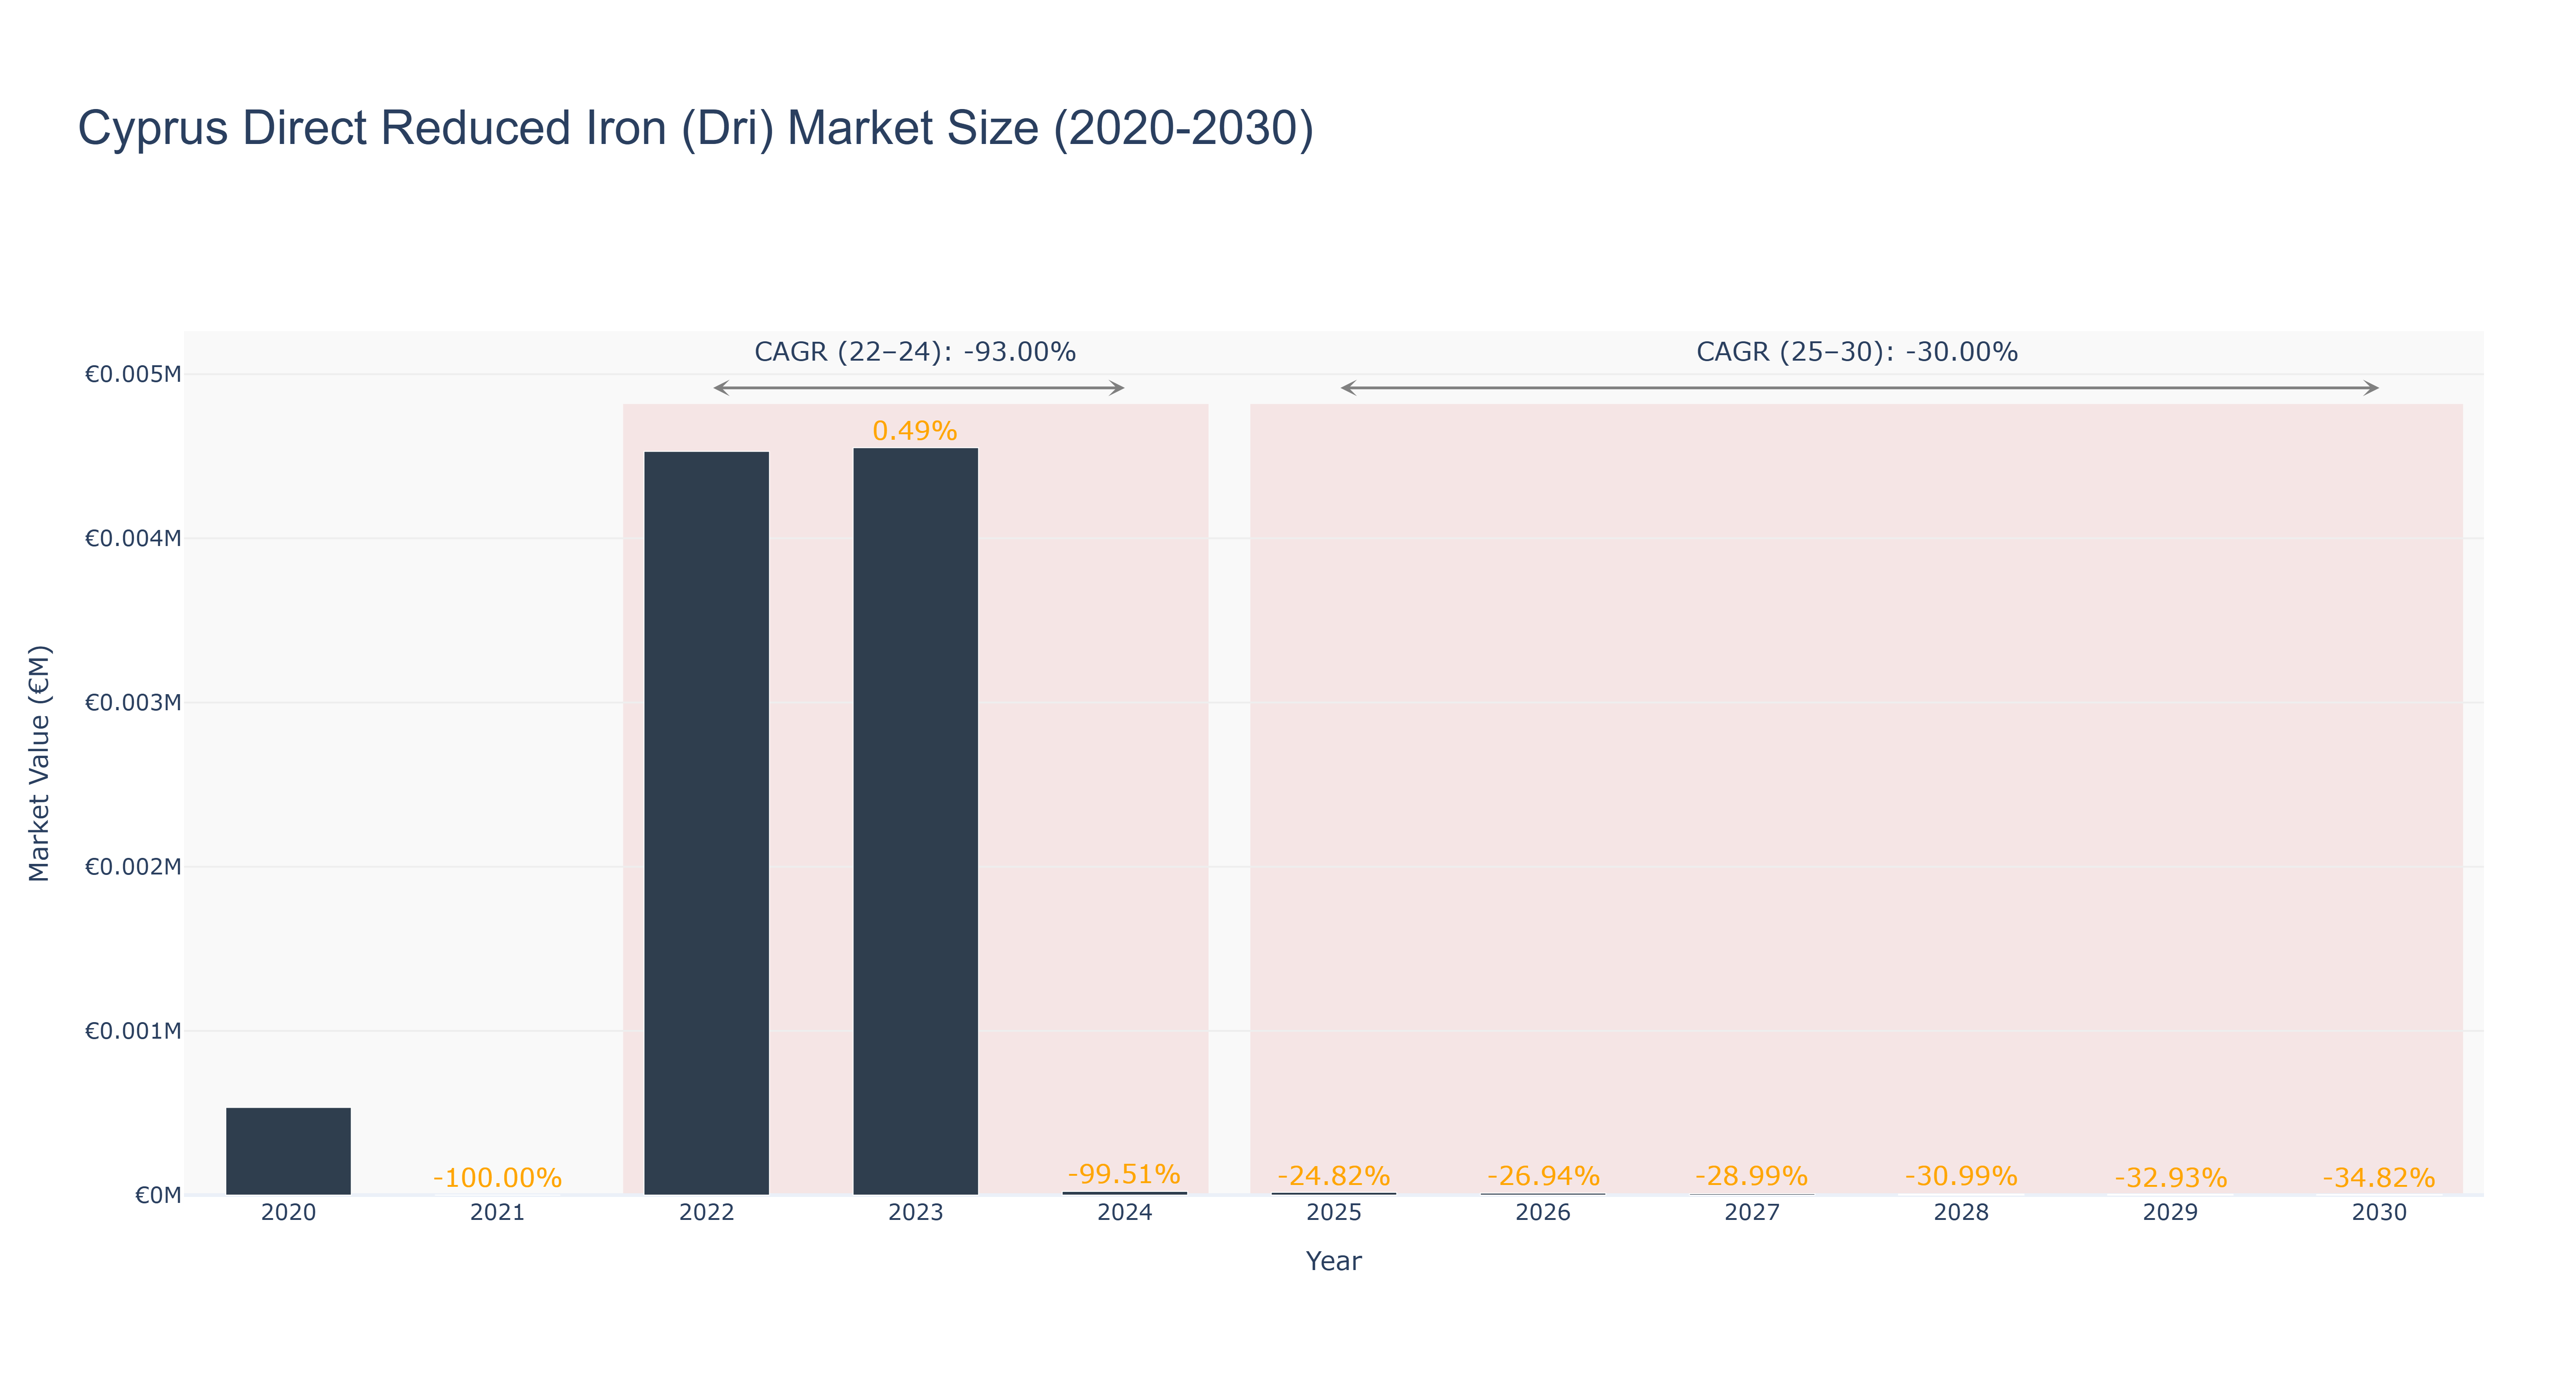
The Cyprus Direct Reduced Iron (DRI) market has experienced a significant decline, with an overall trajectory marked by volatility and contraction. The market peaked in 2020 at €534.00, followed by a sharp drop in 2021, where growth plummeted by 100%. By 2022, the market size had decreased to €4.53 thousand, with a slight increase to €4.55 thousand in 2023. The actual CAGR from 2022 to 2024 stands at a staggering -93.00%, reflecting the challenges faced by the industry. Looking ahead, the forecasted period from 2025 to 2030 indicates a continued decline, with projected market sizes shrinking from €16.69 in 2025 to €2.61 in 2030, resulting in a CAGR of -30.00%. Factors contributing to this downturn include reduced demand for DRI in steel production and competitive pressures from alternative iron sources. Without significant investments or projects to revitalize the sector, the outlook remains bleak.
Cyprus Direct Reduced Iron (Dri) Market: Production & Trade Performance (2019-2025)
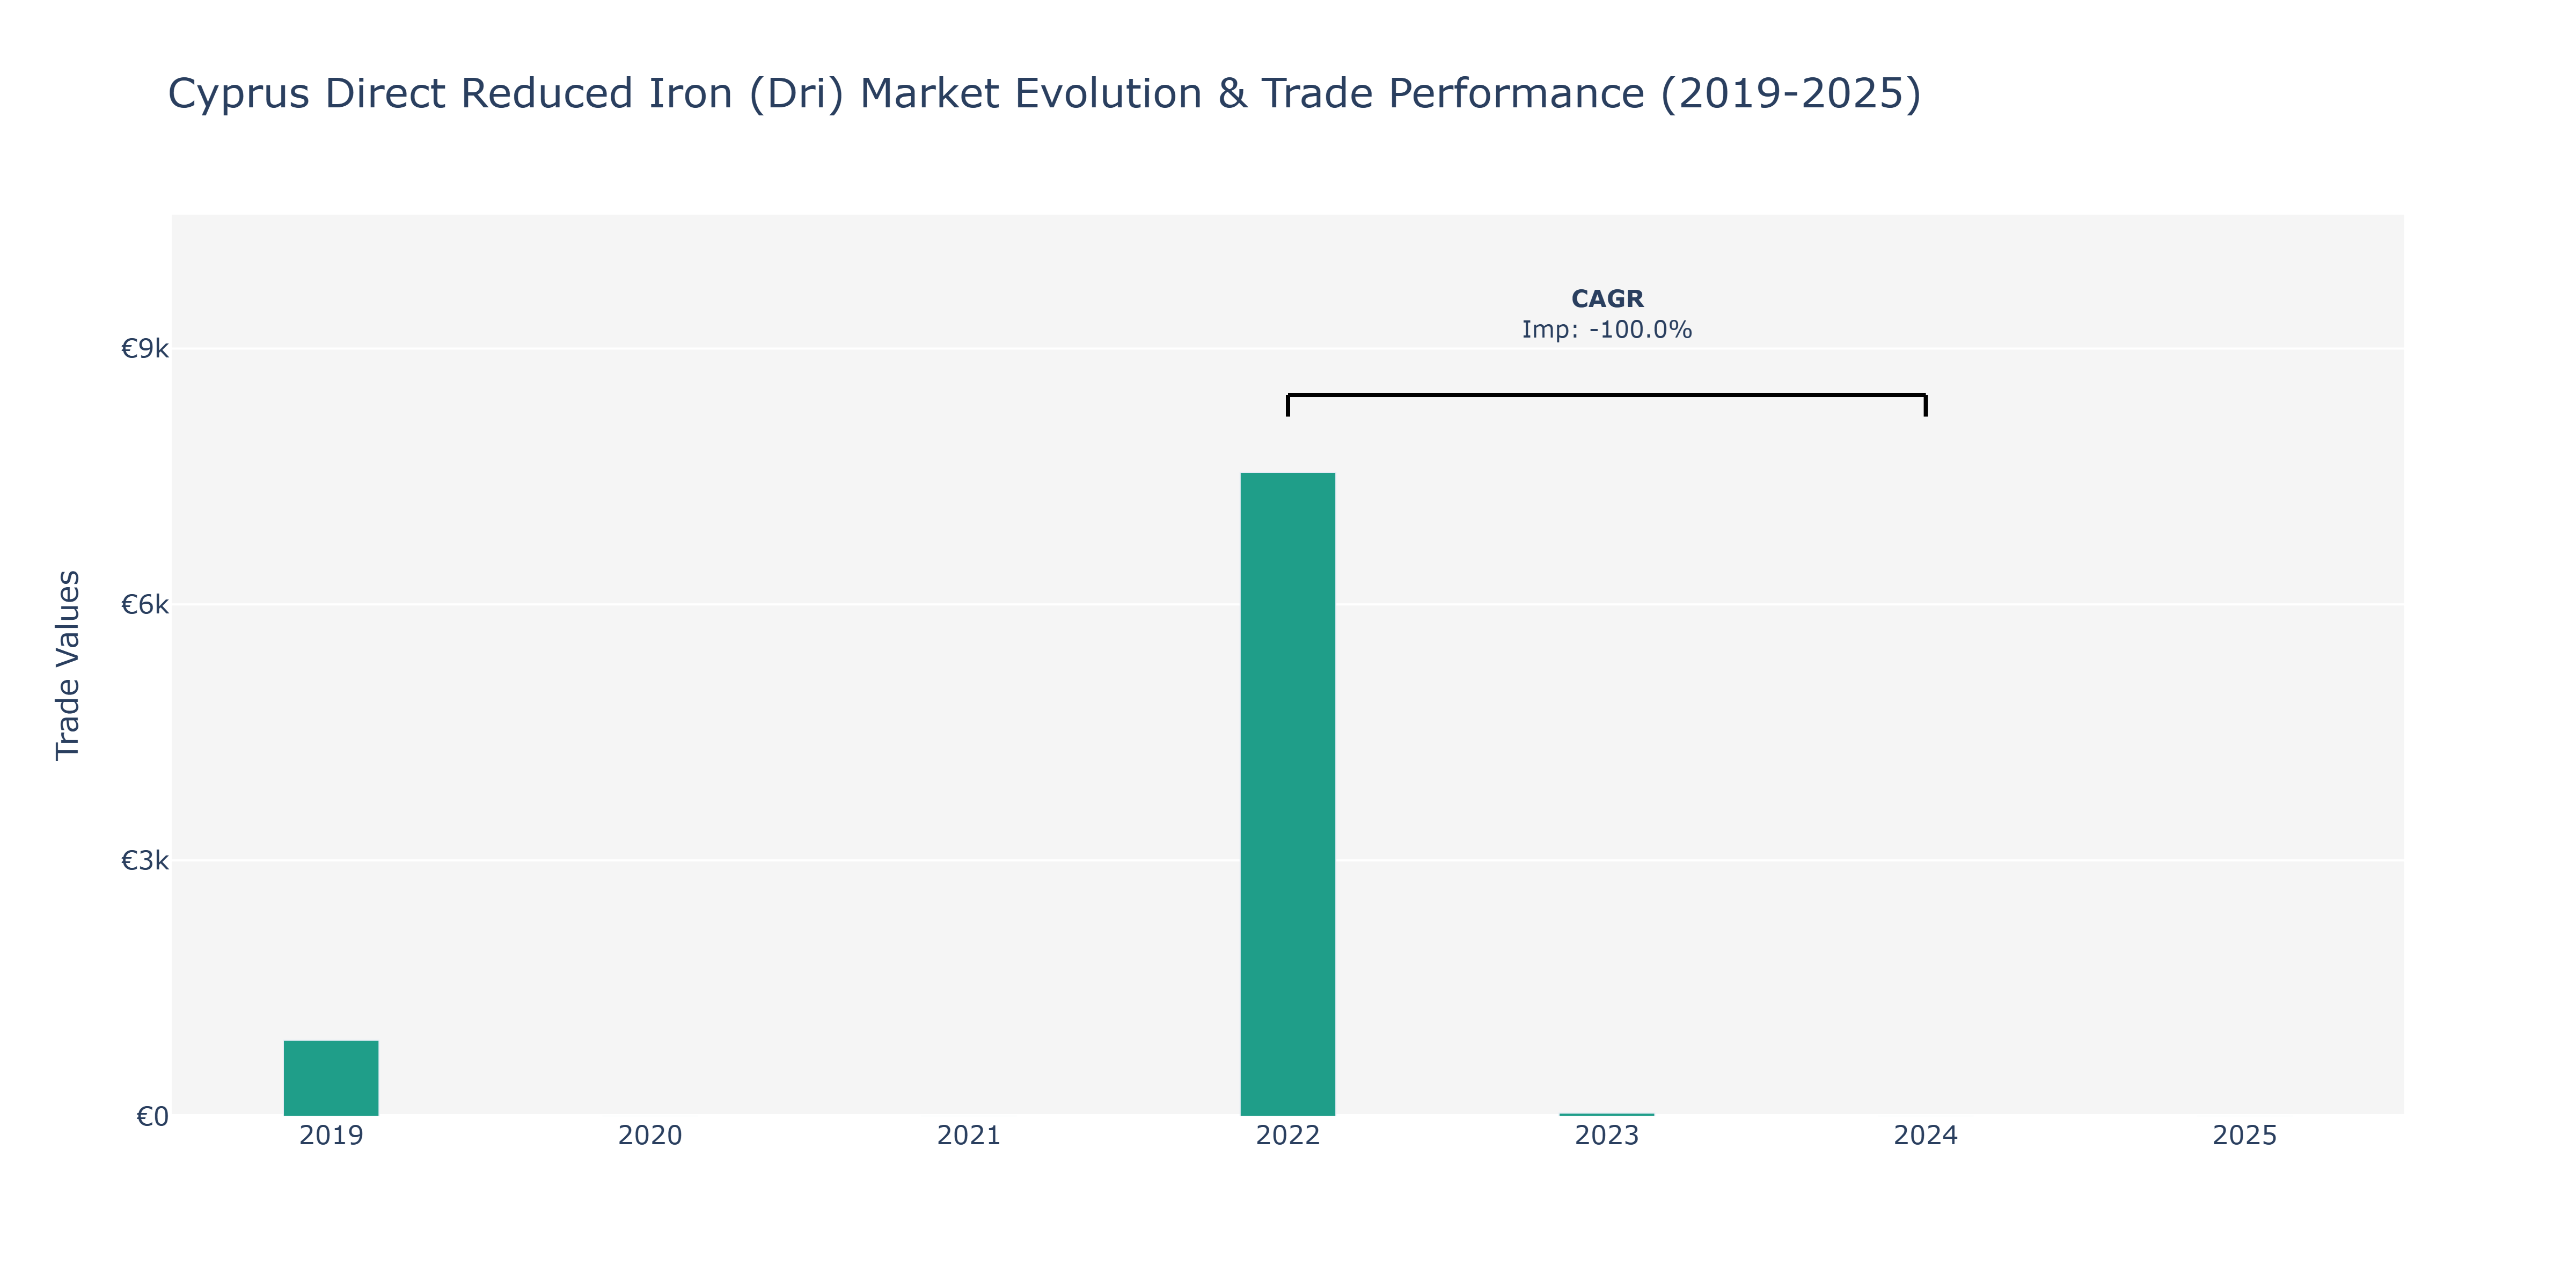
In 2019, Cyprus imported Direct Reduced Iron (DRI) amounting to €890 million. By 2022, imports surged to €7.55 billion, marking a substantial increase. However, a sharp decline was observed in 2023, with imports plummeting to €37 million. This drastic drop can be attributed to various factors such as shifts in global market dynamics impacting demand for DRI, changes in pricing strategies by suppliers, or alterations in domestic production capabilities affecting import requirements. The notable fluctuations in imports reflect the sensitivity of the Cyprus DRI market to external influences, necessitating adaptability in procurement strategies by industry players. To mitigate risks associated with such volatility, market participants may consider diversifying sourcing locations or exploring long-term contractual agreements with suppliers to ensure supply stability amidst market uncertainties.
Key Highlights of the Report:
- Cyprus Direct Reduced Iron (DRI) Market Outlook
- Market Size of Cyprus Direct Reduced Iron (DRI) Market, 2024
- Forecast of Cyprus Direct Reduced Iron (DRI) Market, 2031
- Historical Data and Forecast of Cyprus Direct Reduced Iron (DRI) Revenues & Volume for the Period 2021- 2031
- Cyprus Direct Reduced Iron (DRI) Market Trend Evolution
- Cyprus Direct Reduced Iron (DRI) Market Drivers and Challenges
- Cyprus Direct Reduced Iron (DRI) Price Trends
- Cyprus Direct Reduced Iron (DRI) Porter's Five Forces
- Cyprus Direct Reduced Iron (DRI) Industry Life Cycle
- Historical Data and Forecast of Cyprus Direct Reduced Iron (DRI) Market Revenues & Volume By Form for the Period 2021- 2031
- Historical Data and Forecast of Cyprus Direct Reduced Iron (DRI) Market Revenues & Volume By Pellets for the Period 2021- 2031
- Historical Data and Forecast of Cyprus Direct Reduced Iron (DRI) Market Revenues & Volume By Lumps for the Period 2021- 2031
- Historical Data and Forecast of Cyprus Direct Reduced Iron (DRI) Market Revenues & Volume By Production Process for the Period 2021- 2031
- Historical Data and Forecast of Cyprus Direct Reduced Iron (DRI) Market Revenues & Volume By Gas-based for the Period 2021- 2031
- Historical Data and Forecast of Cyprus Direct Reduced Iron (DRI) Market Revenues & Volume By Coal-based for the Period 2021- 2031
- Historical Data and Forecast of Cyprus Direct Reduced Iron (DRI) Market Revenues & Volume By Grade for the Period 2021- 2031
- Historical Data and Forecast of Cyprus Direct Reduced Iron (DRI) Market Revenues & Volume By Grade A (FeM 81% Min) for the Period 2021- 2031
- Historical Data and Forecast of Cyprus Direct Reduced Iron (DRI) Market Revenues & Volume By Grade B (FeM 78 To 80 %) for the Period 2021- 2031
- Historical Data and Forecast of Cyprus Direct Reduced Iron (DRI) Market Revenues & Volume By Grade C (FeM < 78%) for the Period 2021- 2031
- Cyprus Direct Reduced Iron (DRI) Import Export Trade Statistics
- Market Opportunity Assessment By Form
- Market Opportunity Assessment By Production Process
- Market Opportunity Assessment By Grade
- Cyprus Direct Reduced Iron (DRI) Top Companies Market Share
- Cyprus Direct Reduced Iron (DRI) Competitive Benchmarking By Technical and Operational Parameters
- Cyprus Direct Reduced Iron (DRI) Company Profiles
- Cyprus Direct Reduced Iron (DRI) Key Strategic Recommendations
Frequently Asked Questions About the Market Study (FAQs):
6Wresearch actively monitors the Cyprus Direct Reduced Iron (DRI) Market and publishes its comprehensive annual report, highlighting emerging trends, growth drivers, revenue analysis, and forecast outlook. Our insights help businesses to make data-backed strategic decisions with ongoing market dynamics. Our analysts track relevent industries related to the Cyprus Direct Reduced Iron (DRI) Market, allowing our clients with actionable intelligence and reliable forecasts tailored to emerging regional needs.
Yes, we provide customisation as per your requirements. To learn more, feel free to contact us on sales@6wresearch.com
1 Executive Summary |
2 Introduction |
2.1 Key Highlights of the Report |
2.2 Report Description |
2.3 Market Scope & Segmentation |
2.4 Research Methodology |
2.5 Assumptions |
3 Cyprus Direct Reduced Iron (DRI) Market Overview |
3.1 Cyprus Country Macro Economic Indicators |
3.2 Cyprus Direct Reduced Iron (DRI) Market Revenues & Volume, 2021 & 2031F |
3.3 Cyprus Direct Reduced Iron (DRI) Market - Industry Life Cycle |
3.4 Cyprus Direct Reduced Iron (DRI) Market - Porter's Five Forces |
3.5 Cyprus Direct Reduced Iron (DRI) Market Revenues & Volume Share, By Form, 2021 & 2031F |
3.6 Cyprus Direct Reduced Iron (DRI) Market Revenues & Volume Share, By Production Process, 2021 & 2031F |
3.7 Cyprus Direct Reduced Iron (DRI) Market Revenues & Volume Share, By Grade, 2021 & 2031F |
4 Cyprus Direct Reduced Iron (DRI) Market Dynamics |
4.1 Impact Analysis |
4.2 Market Drivers |
4.2.1 Growing demand for steel production globally |
4.2.2 Increasing focus on sustainable steel production methods |
4.2.3 Favorable government policies supporting the steel industry in Cyprus |
4.3 Market Restraints |
4.3.1 Volatility in raw material prices |
4.3.2 Competition from alternative iron production methods |
4.3.3 Regulatory challenges related to environmental compliance |
5 Cyprus Direct Reduced Iron (DRI) Market Trends |
6 Cyprus Direct Reduced Iron (DRI) Market, By Types |
6.1 Cyprus Direct Reduced Iron (DRI) Market, By Form |
6.1.1 Overview and Analysis |
6.1.2 Cyprus Direct Reduced Iron (DRI) Market Revenues & Volume, By Form, 2021- 2031F |
6.1.3 Cyprus Direct Reduced Iron (DRI) Market Revenues & Volume, By Pellets, 2021- 2031F |
6.1.4 Cyprus Direct Reduced Iron (DRI) Market Revenues & Volume, By Lumps, 2021- 2031F |
6.2 Cyprus Direct Reduced Iron (DRI) Market, By Production Process |
6.2.1 Overview and Analysis |
6.2.2 Cyprus Direct Reduced Iron (DRI) Market Revenues & Volume, By Gas-based, 2021- 2031F |
6.2.3 Cyprus Direct Reduced Iron (DRI) Market Revenues & Volume, By Coal-based, 2021- 2031F |
6.3 Cyprus Direct Reduced Iron (DRI) Market, By Grade |
6.3.1 Overview and Analysis |
6.3.2 Cyprus Direct Reduced Iron (DRI) Market Revenues & Volume, By Grade A (FeM 81% Min), 2021- 2031F |
6.3.3 Cyprus Direct Reduced Iron (DRI) Market Revenues & Volume, By Grade B (FeM 78 To 80 %), 2021- 2031F |
6.3.4 Cyprus Direct Reduced Iron (DRI) Market Revenues & Volume, By Grade C (FeM |
7 Cyprus Direct Reduced Iron (DRI) Market Import-Export Trade Statistics |
7.1 Cyprus Direct Reduced Iron (DRI) Market Export to Major Countries |
7.2 Cyprus Direct Reduced Iron (DRI) Market Imports from Major Countries |
8 Cyprus Direct Reduced Iron (DRI) Market Key Performance Indicators |
8.1 Average selling price of direct reduced iron (DRI) |
8.2 Capacity utilization rate of DRI production facilities |
8.3 Energy efficiency of DRI production processes |
9 Cyprus Direct Reduced Iron (DRI) Market - Opportunity Assessment |
9.1 Cyprus Direct Reduced Iron (DRI) Market Opportunity Assessment, By Form, 2021 & 2031F |
9.2 Cyprus Direct Reduced Iron (DRI) Market Opportunity Assessment, By Production Process, 2021 & 2031F |
9.3 Cyprus Direct Reduced Iron (DRI) Market Opportunity Assessment, By Grade, 2021 & 2031F |
10 Cyprus Direct Reduced Iron (DRI) Market - Competitive Landscape |
10.1 Cyprus Direct Reduced Iron (DRI) Market Revenue Share, By Companies, 2024 |
10.2 Cyprus Direct Reduced Iron (DRI) Market Competitive Benchmarking, By Operating and Technical Parameters |
11 Company Profiles |
12 Recommendations |
13 Disclaimer |
Global Go To Market Strategy - 2030
Export potential enables firms to identify high-growth global markets with greater confidence by combining advanced trade intelligence with a structured quantitative methodology. The framework analyzes emerging demand trends and country-level import patterns while integrating macroeconomic and trade datasets such as GDP and population forecasts, bilateral import–export flows, tariff structures, elasticity differentials between developed and developing economies, geographic distance, and import demand projections. Using weighted trade values from 2020–2024 as the base period to project country-to-country export potential for 2030, these inputs are operationalized through calculated drivers such as gravity model parameters, tariff impact factors, and projected GDP per-capita growth. Through an analysis of hidden potentials, demand hotspots, and market conditions that are most favorable to success, this method enables firms to focus on target countries, maximize returns, and global expansion with data, backed by accuracy.
By factoring in the projected importer demand gap that is currently unmet and could be potential opportunity, it identifies the potential for the Exporter (Country) among 190 countries, against the general trade analysis, which identifies the biggest importer or exporter.
To discover high-growth global markets and optimize your business strategy:
Click Here
Pricing
- Single User License$ 1,995
- Department License$ 2,400
- Site License$ 3,120
- Global License$ 3,795

Leadership Perspectives from Industry Events
Search
Thought Leadership and Analyst Meet


Our Clients
6WResearch In News
- Doha a strategic location for EV manufacturing hub: IPA Qatar
- Demand for luxury TVs surging in the GCC, says Samsung
- Empowering Growth: The Thriving Journey of Bangladesh’s Cable Industry
- Demand for luxury TVs surging in the GCC, says Samsung
- Video call with a traditional healer? Once unthinkable, it’s now common in South Africa
- Intelligent Buildings To Smooth GCC’s Path To Net Zero
Latest Reports
- Taiwan Airport Wireless Infrastructure Market (2026-2032)
- Vietnam Airport Wireless Infrastructure Market (2026-2032)
- Thailand Airport Wireless Infrastructure Market (2026-2032)
- South Korea Airport Wireless Infrastructure Market (2026-2032)
- Romania Airport Wireless Infrastructure Market (2026-2032)
- Qatar Airport Wireless Infrastructure Market (2026-2032)
- Philippines Airport Wireless Infrastructure Market (2026-2032)
- Japan Airport Wireless Infrastructure Market (2026-2032)
- Taiwan Airport Winter Services Market (2026-2032)
- Vietnam Airport Winter Services Market (2026-2032)
Industry Events and Analyst Meet

HIMTEX 2026

India Refining Summit 2026

India EV Show 2026

EV tech India Expo 2026

Auto Tech Asia 2026
Whitepaper
- Middle East & Africa Commercial Security Market Click here to view more.
- Middle East & Africa Fire Safety Systems & Equipment Market Click here to view more.
- GCC Drone Market Click here to view more.
- Middle East Lighting Fixture Market Click here to view more.
- GCC Physical & Perimeter Security Market Click here to view more.