Cyprus Fault and Classification (FDC) Market (2025-2031) | Share, Competitive Landscape, Value, Growth, Trends, Outlook, Industry, Segmentation, Forecast, Size & Revenue, Companies, Analysis
Market Forecast By Offering Type (Software, Hardware, Services), By Application (Manufacturing, Packaging), By End Use (Automotive, Electronics & Semiconductor, Metal & Machinery) And Competitive Landscape
| Product Code: ETC6894266 | Publication Date: Sep 2024 | Updated Date: Oct 2025 | Product Type: Market Research Report | |
| Publisher: 6Wresearch | Author: Vasudha | No. of Pages: 75 | No. of Figures: 35 | No. of Tables: 20 |
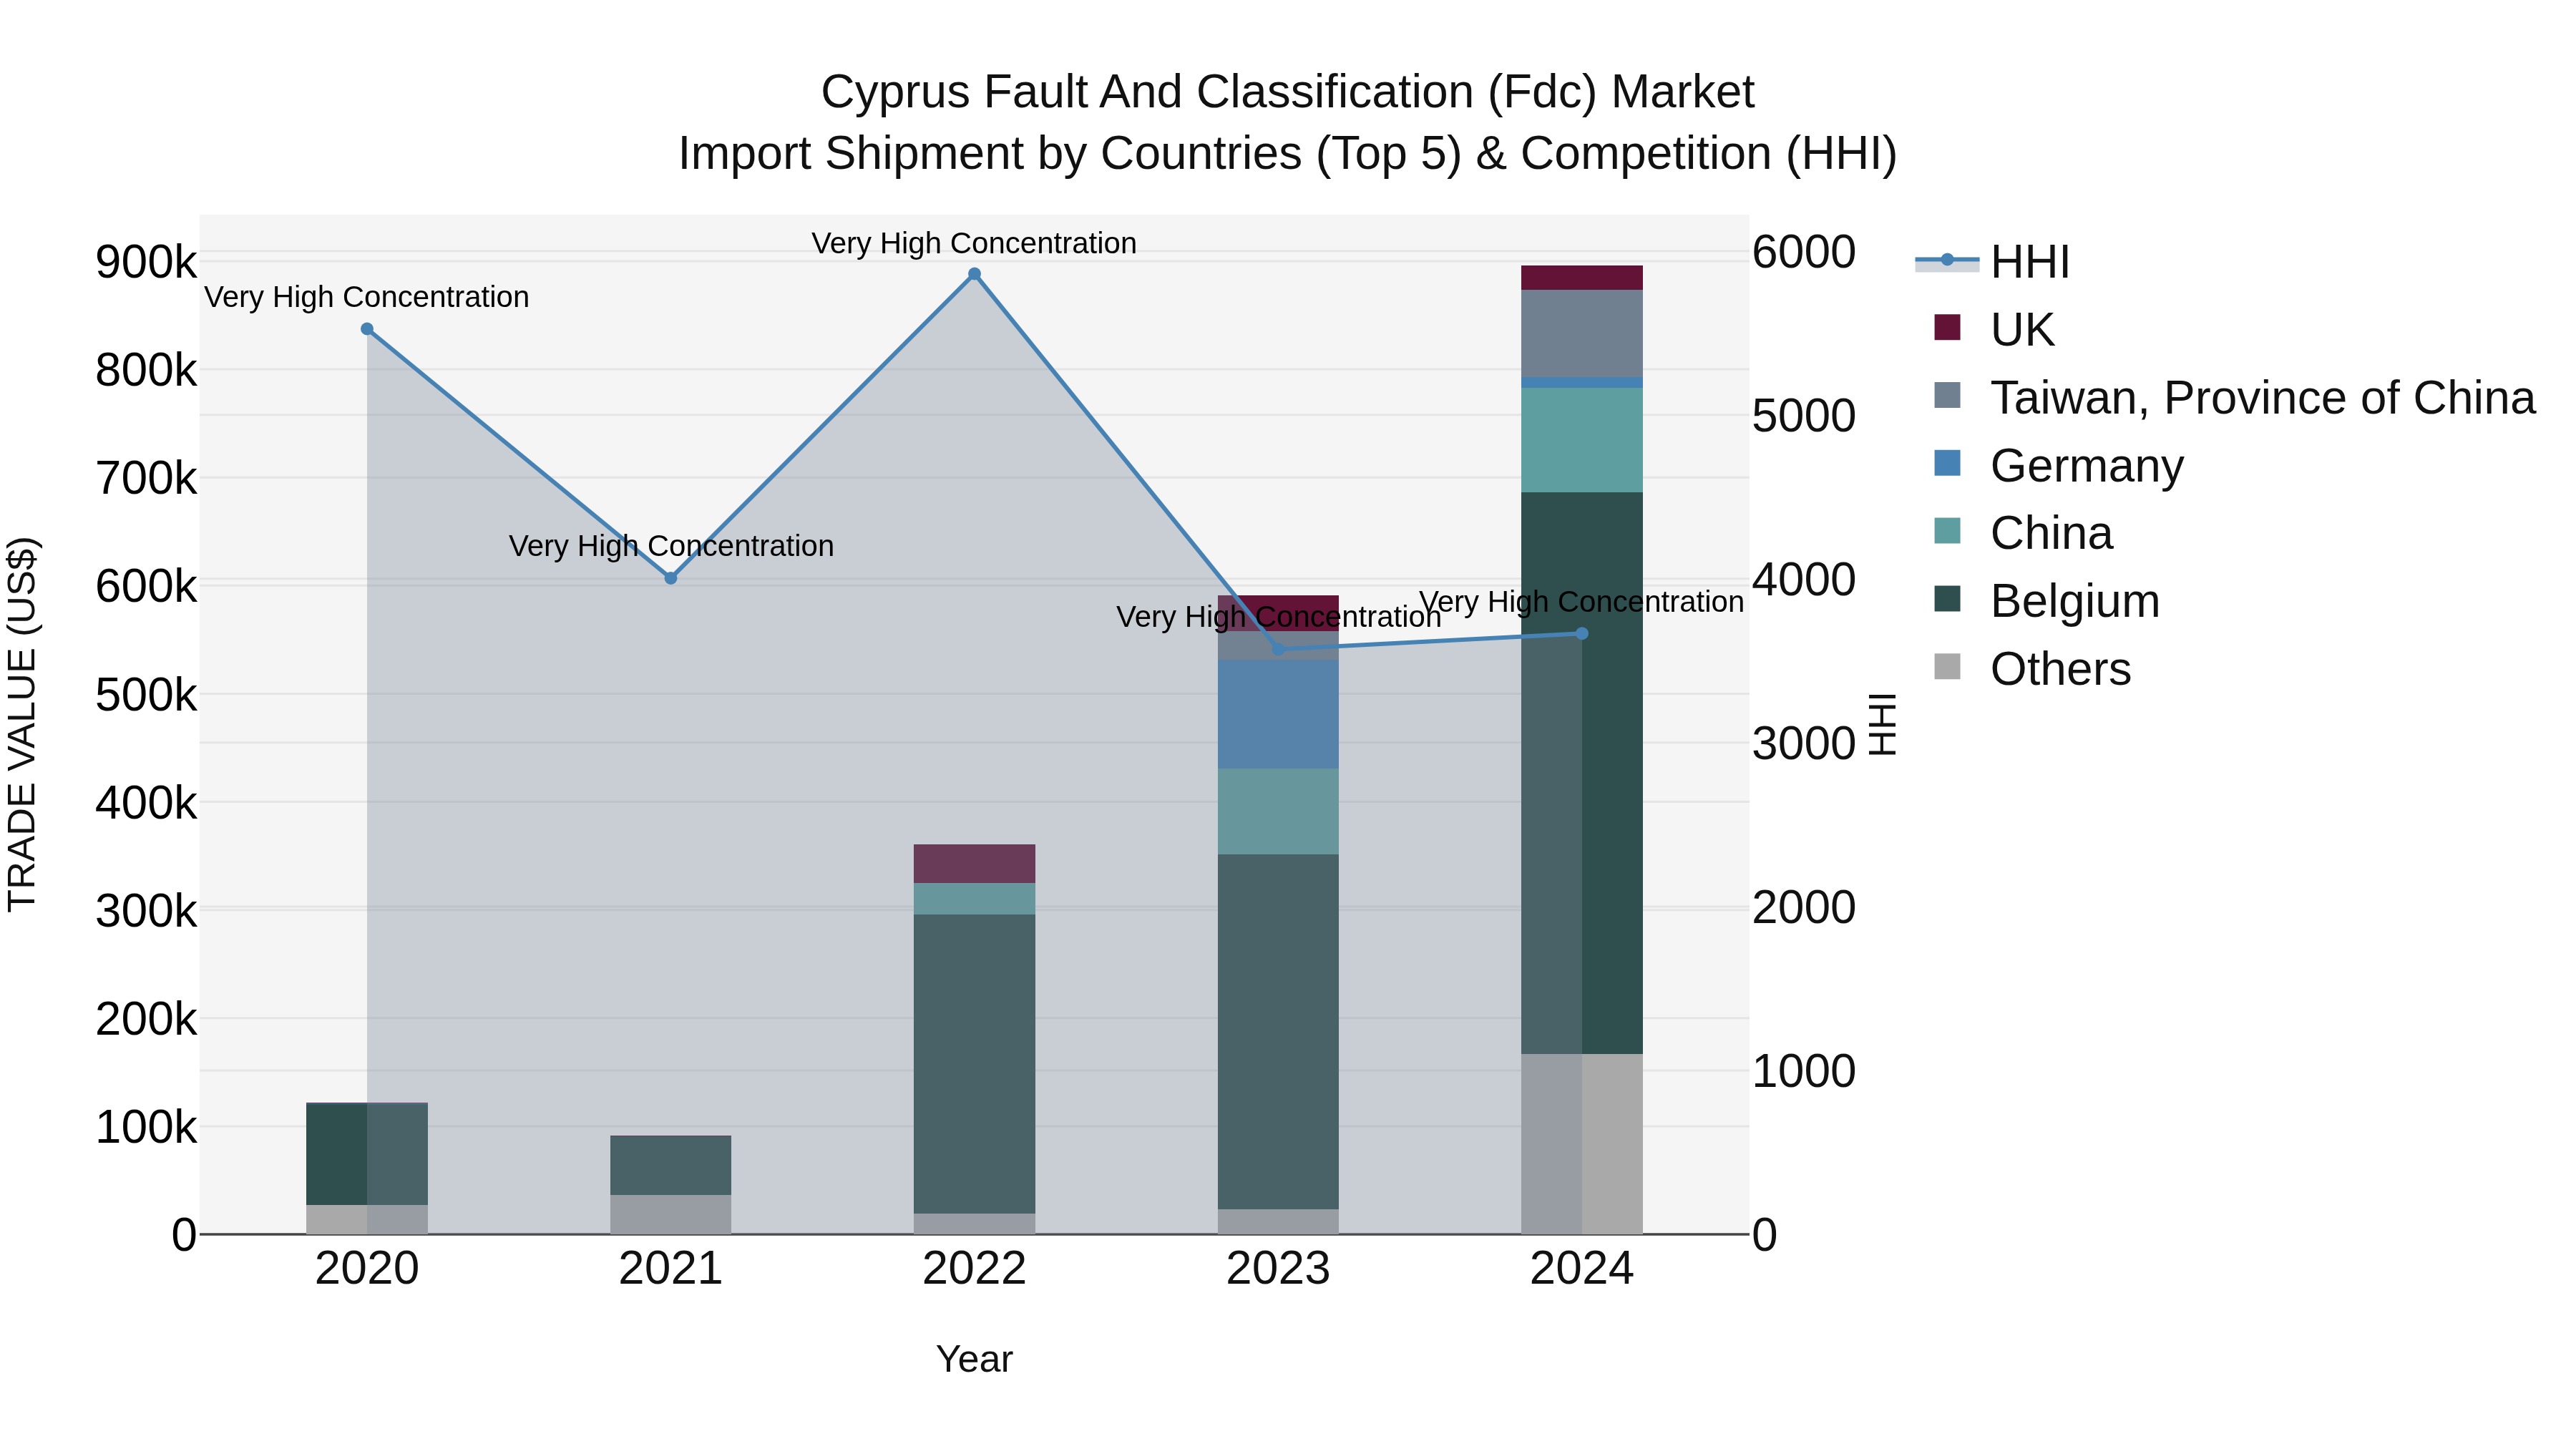
Cyprus Fault And Classification (fdc) Market Import Shipment by Countries (Top 5) & Competition (HHI)
The Cyprus Fault and Classification (FDC) import shipments in 2024 show a significant level of concentration, with the top exporting countries being Belgium, China, Netherlands, Taiwan, and Greece. The Herfindahl-Hirschman Index (HHI) remained at a very high level, indicating market concentration. The impressive Compound Annual Growth Rate (CAGR) of 64.66% from 2020 to 2024 underscores the robust growth in this sector. Furthermore, the notable growth rate of 51.56% from 2023 to 2024 suggests continued momentum and potential opportunities for market expansion in the near future.
Key Highlights of the Report:
- Cyprus Fault and Classification (FDC) Market Outlook
- Market Size of Cyprus Fault and Classification (FDC) Market, 2024
- Forecast of Cyprus Fault and Classification (FDC) Market, 2031
- Historical Data and Forecast of Cyprus Fault and Classification (FDC) Revenues & Volume for the Period 2021- 2031
- Cyprus Fault and Classification (FDC) Market Trend Evolution
- Cyprus Fault and Classification (FDC) Market Drivers and Challenges
- Cyprus Fault and Classification (FDC) Price Trends
- Cyprus Fault and Classification (FDC) Porter's Five Forces
- Cyprus Fault and Classification (FDC) Industry Life Cycle
- Historical Data and Forecast of Cyprus Fault and Classification (FDC) Market Revenues & Volume By Offering Type for the Period 2021- 2031
- Historical Data and Forecast of Cyprus Fault and Classification (FDC) Market Revenues & Volume By Software for the Period 2021- 2031
- Historical Data and Forecast of Cyprus Fault and Classification (FDC) Market Revenues & Volume By Hardware for the Period 2021- 2031
- Historical Data and Forecast of Cyprus Fault and Classification (FDC) Market Revenues & Volume By Services for the Period 2021- 2031
- Historical Data and Forecast of Cyprus Fault and Classification (FDC) Market Revenues & Volume By Application for the Period 2021- 2031
- Historical Data and Forecast of Cyprus Fault and Classification (FDC) Market Revenues & Volume By Manufacturing for the Period 2021- 2031
- Historical Data and Forecast of Cyprus Fault and Classification (FDC) Market Revenues & Volume By Packaging for the Period 2021- 2031
- Historical Data and Forecast of Cyprus Fault and Classification (FDC) Market Revenues & Volume By End Use for the Period 2021- 2031
- Historical Data and Forecast of Cyprus Fault and Classification (FDC) Market Revenues & Volume By Automotive for the Period 2021- 2031
- Historical Data and Forecast of Cyprus Fault and Classification (FDC) Market Revenues & Volume By Electronics & Semiconductor for the Period 2021- 2031
- Historical Data and Forecast of Cyprus Fault and Classification (FDC) Market Revenues & Volume By Metal & Machinery for the Period 2021- 2031
- Cyprus Fault and Classification (FDC) Import Export Trade Statistics
- Market Opportunity Assessment By Offering Type
- Market Opportunity Assessment By Application
- Market Opportunity Assessment By End Use
- Cyprus Fault and Classification (FDC) Top Companies Market Share
- Cyprus Fault and Classification (FDC) Competitive Benchmarking By Technical and Operational Parameters
- Cyprus Fault and Classification (FDC) Company Profiles
- Cyprus Fault and Classification (FDC) Key Strategic Recommendations
Frequently Asked Questions About the Market Study (FAQs):
6Wresearch actively monitors the Cyprus Fault and Classification (FDC) Market and publishes its comprehensive annual report, highlighting emerging trends, growth drivers, revenue analysis, and forecast outlook. Our insights help businesses to make data-backed strategic decisions with ongoing market dynamics. Our analysts track relevent industries related to the Cyprus Fault and Classification (FDC) Market, allowing our clients with actionable intelligence and reliable forecasts tailored to emerging regional needs.
Yes, we provide customisation as per your requirements. To learn more, feel free to contact us on sales@6wresearch.com
1 Executive Summary |
2 Introduction |
2.1 Key Highlights of the Report |
2.2 Report Description |
2.3 Market Scope & Segmentation |
2.4 Research Methodology |
2.5 Assumptions |
3 Cyprus Fault and Classification (FDC) Market Overview |
3.1 Cyprus Country Macro Economic Indicators |
3.2 Cyprus Fault and Classification (FDC) Market Revenues & Volume, 2021 & 2031F |
3.3 Cyprus Fault and Classification (FDC) Market - Industry Life Cycle |
3.4 Cyprus Fault and Classification (FDC) Market - Porter's Five Forces |
3.5 Cyprus Fault and Classification (FDC) Market Revenues & Volume Share, By Offering Type, 2021 & 2031F |
3.6 Cyprus Fault and Classification (FDC) Market Revenues & Volume Share, By Application, 2021 & 2031F |
3.7 Cyprus Fault and Classification (FDC) Market Revenues & Volume Share, By End Use, 2021 & 2031F |
4 Cyprus Fault and Classification (FDC) Market Dynamics |
4.1 Impact Analysis |
4.2 Market Drivers |
4.2.1 Increasing demand for fault detection and classification (FDC) solutions in the semiconductor industry to improve manufacturing efficiency and yield. |
4.2.2 Technological advancements in FDC systems leading to higher accuracy and faster detection of faults. |
4.2.3 Growing emphasis on reducing production downtime and enhancing product quality in manufacturing processes. |
4.3 Market Restraints |
4.3.1 High initial investment required for implementing advanced FDC systems may deter small and medium-sized enterprises from adoption. |
4.3.2 Complexity in integrating FDC solutions with existing manufacturing systems and processes. |
4.3.3 Lack of skilled professionals to operate and maintain FDC systems effectively. |
5 Cyprus Fault and Classification (FDC) Market Trends |
6 Cyprus Fault and Classification (FDC) Market, By Types |
6.1 Cyprus Fault and Classification (FDC) Market, By Offering Type |
6.1.1 Overview and Analysis |
6.1.2 Cyprus Fault and Classification (FDC) Market Revenues & Volume, By Offering Type, 2021- 2031F |
6.1.3 Cyprus Fault and Classification (FDC) Market Revenues & Volume, By Software, 2021- 2031F |
6.1.4 Cyprus Fault and Classification (FDC) Market Revenues & Volume, By Hardware, 2021- 2031F |
6.1.5 Cyprus Fault and Classification (FDC) Market Revenues & Volume, By Services, 2021- 2031F |
6.2 Cyprus Fault and Classification (FDC) Market, By Application |
6.2.1 Overview and Analysis |
6.2.2 Cyprus Fault and Classification (FDC) Market Revenues & Volume, By Manufacturing, 2021- 2031F |
6.2.3 Cyprus Fault and Classification (FDC) Market Revenues & Volume, By Packaging, 2021- 2031F |
6.3 Cyprus Fault and Classification (FDC) Market, By End Use |
6.3.1 Overview and Analysis |
6.3.2 Cyprus Fault and Classification (FDC) Market Revenues & Volume, By Automotive, 2021- 2031F |
6.3.3 Cyprus Fault and Classification (FDC) Market Revenues & Volume, By Electronics & Semiconductor, 2021- 2031F |
6.3.4 Cyprus Fault and Classification (FDC) Market Revenues & Volume, By Metal & Machinery, 2021- 2031F |
7 Cyprus Fault and Classification (FDC) Market Import-Export Trade Statistics |
7.1 Cyprus Fault and Classification (FDC) Market Export to Major Countries |
7.2 Cyprus Fault and Classification (FDC) Market Imports from Major Countries |
8 Cyprus Fault and Classification (FDC) Market Key Performance Indicators |
8.1 Mean Time to Repair (MTTR): Measures the average time taken to recover from faults, indicating the efficiency of fault detection and resolution processes. |
8.2 Overall Equipment Effectiveness (OEE): Reflects the productivity and performance of manufacturing equipment, showing the impact of FDC systems on operational efficiency. |
8.3 Fault Detection Rate: Tracks the percentage of faults accurately detected by FDC systems, indicating their effectiveness in identifying issues in real-time. |
8.4 Equipment Downtime: Measures the duration of equipment downtime due to faults, providing insights into the reliability and maintenance needs of manufacturing processes. |
8.5 Process Yield: Indicates the percentage of defect-free products manufactured, showing the effectiveness of FDC systems in improving product quality and reducing waste. |
9 Cyprus Fault and Classification (FDC) Market - Opportunity Assessment |
9.1 Cyprus Fault and Classification (FDC) Market Opportunity Assessment, By Offering Type, 2021 & 2031F |
9.2 Cyprus Fault and Classification (FDC) Market Opportunity Assessment, By Application, 2021 & 2031F |
9.3 Cyprus Fault and Classification (FDC) Market Opportunity Assessment, By End Use, 2021 & 2031F |
10 Cyprus Fault and Classification (FDC) Market - Competitive Landscape |
10.1 Cyprus Fault and Classification (FDC) Market Revenue Share, By Companies, 2024 |
10.2 Cyprus Fault and Classification (FDC) Market Competitive Benchmarking, By Operating and Technical Parameters |
11 Company Profiles |
12 Recommendations |
13 Disclaimer |
Global Go To Market Strategy - 2030
Export potential enables firms to identify high-growth global markets with greater confidence by combining advanced trade intelligence with a structured quantitative methodology. The framework analyzes emerging demand trends and country-level import patterns while integrating macroeconomic and trade datasets such as GDP and population forecasts, bilateral import–export flows, tariff structures, elasticity differentials between developed and developing economies, geographic distance, and import demand projections. Using weighted trade values from 2020–2024 as the base period to project country-to-country export potential for 2030, these inputs are operationalized through calculated drivers such as gravity model parameters, tariff impact factors, and projected GDP per-capita growth. Through an analysis of hidden potentials, demand hotspots, and market conditions that are most favorable to success, this method enables firms to focus on target countries, maximize returns, and global expansion with data, backed by accuracy.
By factoring in the projected importer demand gap that is currently unmet and could be potential opportunity, it identifies the potential for the Exporter (Country) among 190 countries, against the general trade analysis, which identifies the biggest importer or exporter.
To discover high-growth global markets and optimize your business strategy:
Click Here
Pricing
- Single User License$ 1,995
- Department License$ 2,400
- Site License$ 3,120
- Global License$ 3,795

Leadership Perspectives from Industry Events
Search
Thought Leadership and Analyst Meet


Our Clients
6WResearch In News
- India Export Attractiveness Tracker 2026
- India Air Conditioner Market Set for Strong Rebound in 2026 After Weather-Led Correction and GST-Driven Recovery: 6Wresearch
- ADAS in India: How Automatic Emergency Braking, Blind Spot Detection & Driver Monitoring are Transforming Road Safety
- Doha a strategic location for EV manufacturing hub: IPA Qatar
- Demand for luxury TVs surging in the GCC, says Samsung
- Empowering Growth: The Thriving Journey of Bangladesh’s Cable Industry
Latest Reports
- Nicaragua RPG Gaming Market (2026-2032)
- New Zealand RPG Gaming Market (2026-2032)
- Netherlands RPG Gaming Market (2026-2032)
- Nauru RPG Gaming Market (2026-2032)
- Namibia RPG Gaming Market (2026-2032)
- Mozambique RPG Gaming Market (2026-2032)
- Montenegro RPG Gaming Market (2026-2032)
- Mongolia RPG Gaming Market (2026-2032)
- Monaco RPG Gaming Market (2026-2032)
- Micronesia RPG Gaming Market (2026-2032)
Industry Events and Analyst Meet

EV India Expo 2026

HIMTEX 2026

India Refining Summit 2026

India EV Show 2026

EV tech India Expo 2026
Whitepaper
- Middle East & Africa Commercial Security Market Click here to view more.
- Middle East & Africa Fire Safety Systems & Equipment Market Click here to view more.
- GCC Drone Market Click here to view more.
- Middle East Lighting Fixture Market Click here to view more.
- GCC Physical & Perimeter Security Market Click here to view more.