Cyprus Galvanized Iron Wire Market (2025-2031) | Trends, Revenue, Forecast, Segmentation, Companies, Size, Outlook, Value, Growth, Share, Industry & Analysis
Market Forecast By Product (Hot Galvanized Iron Wire, Cold Galvanized Iron Wire), By Application (Building, Handicrafts, Weaving Screen, Wipe Wall Net, Highway Guardrail, Packaging, Daily Civilian Use, Others) And Competitive Landscape
| Product Code: ETC5390514 | Publication Date: Nov 2023 | Updated Date: Apr 2026 | Product Type: Market Research Report | |
| Publisher: 6Wresearch | Author: Ravi Bhandari | No. of Pages: 60 | No. of Figures: 30 | No. of Tables: 5 |
Cyprus Galvanized Iron Wire Market Size (2020-2030)
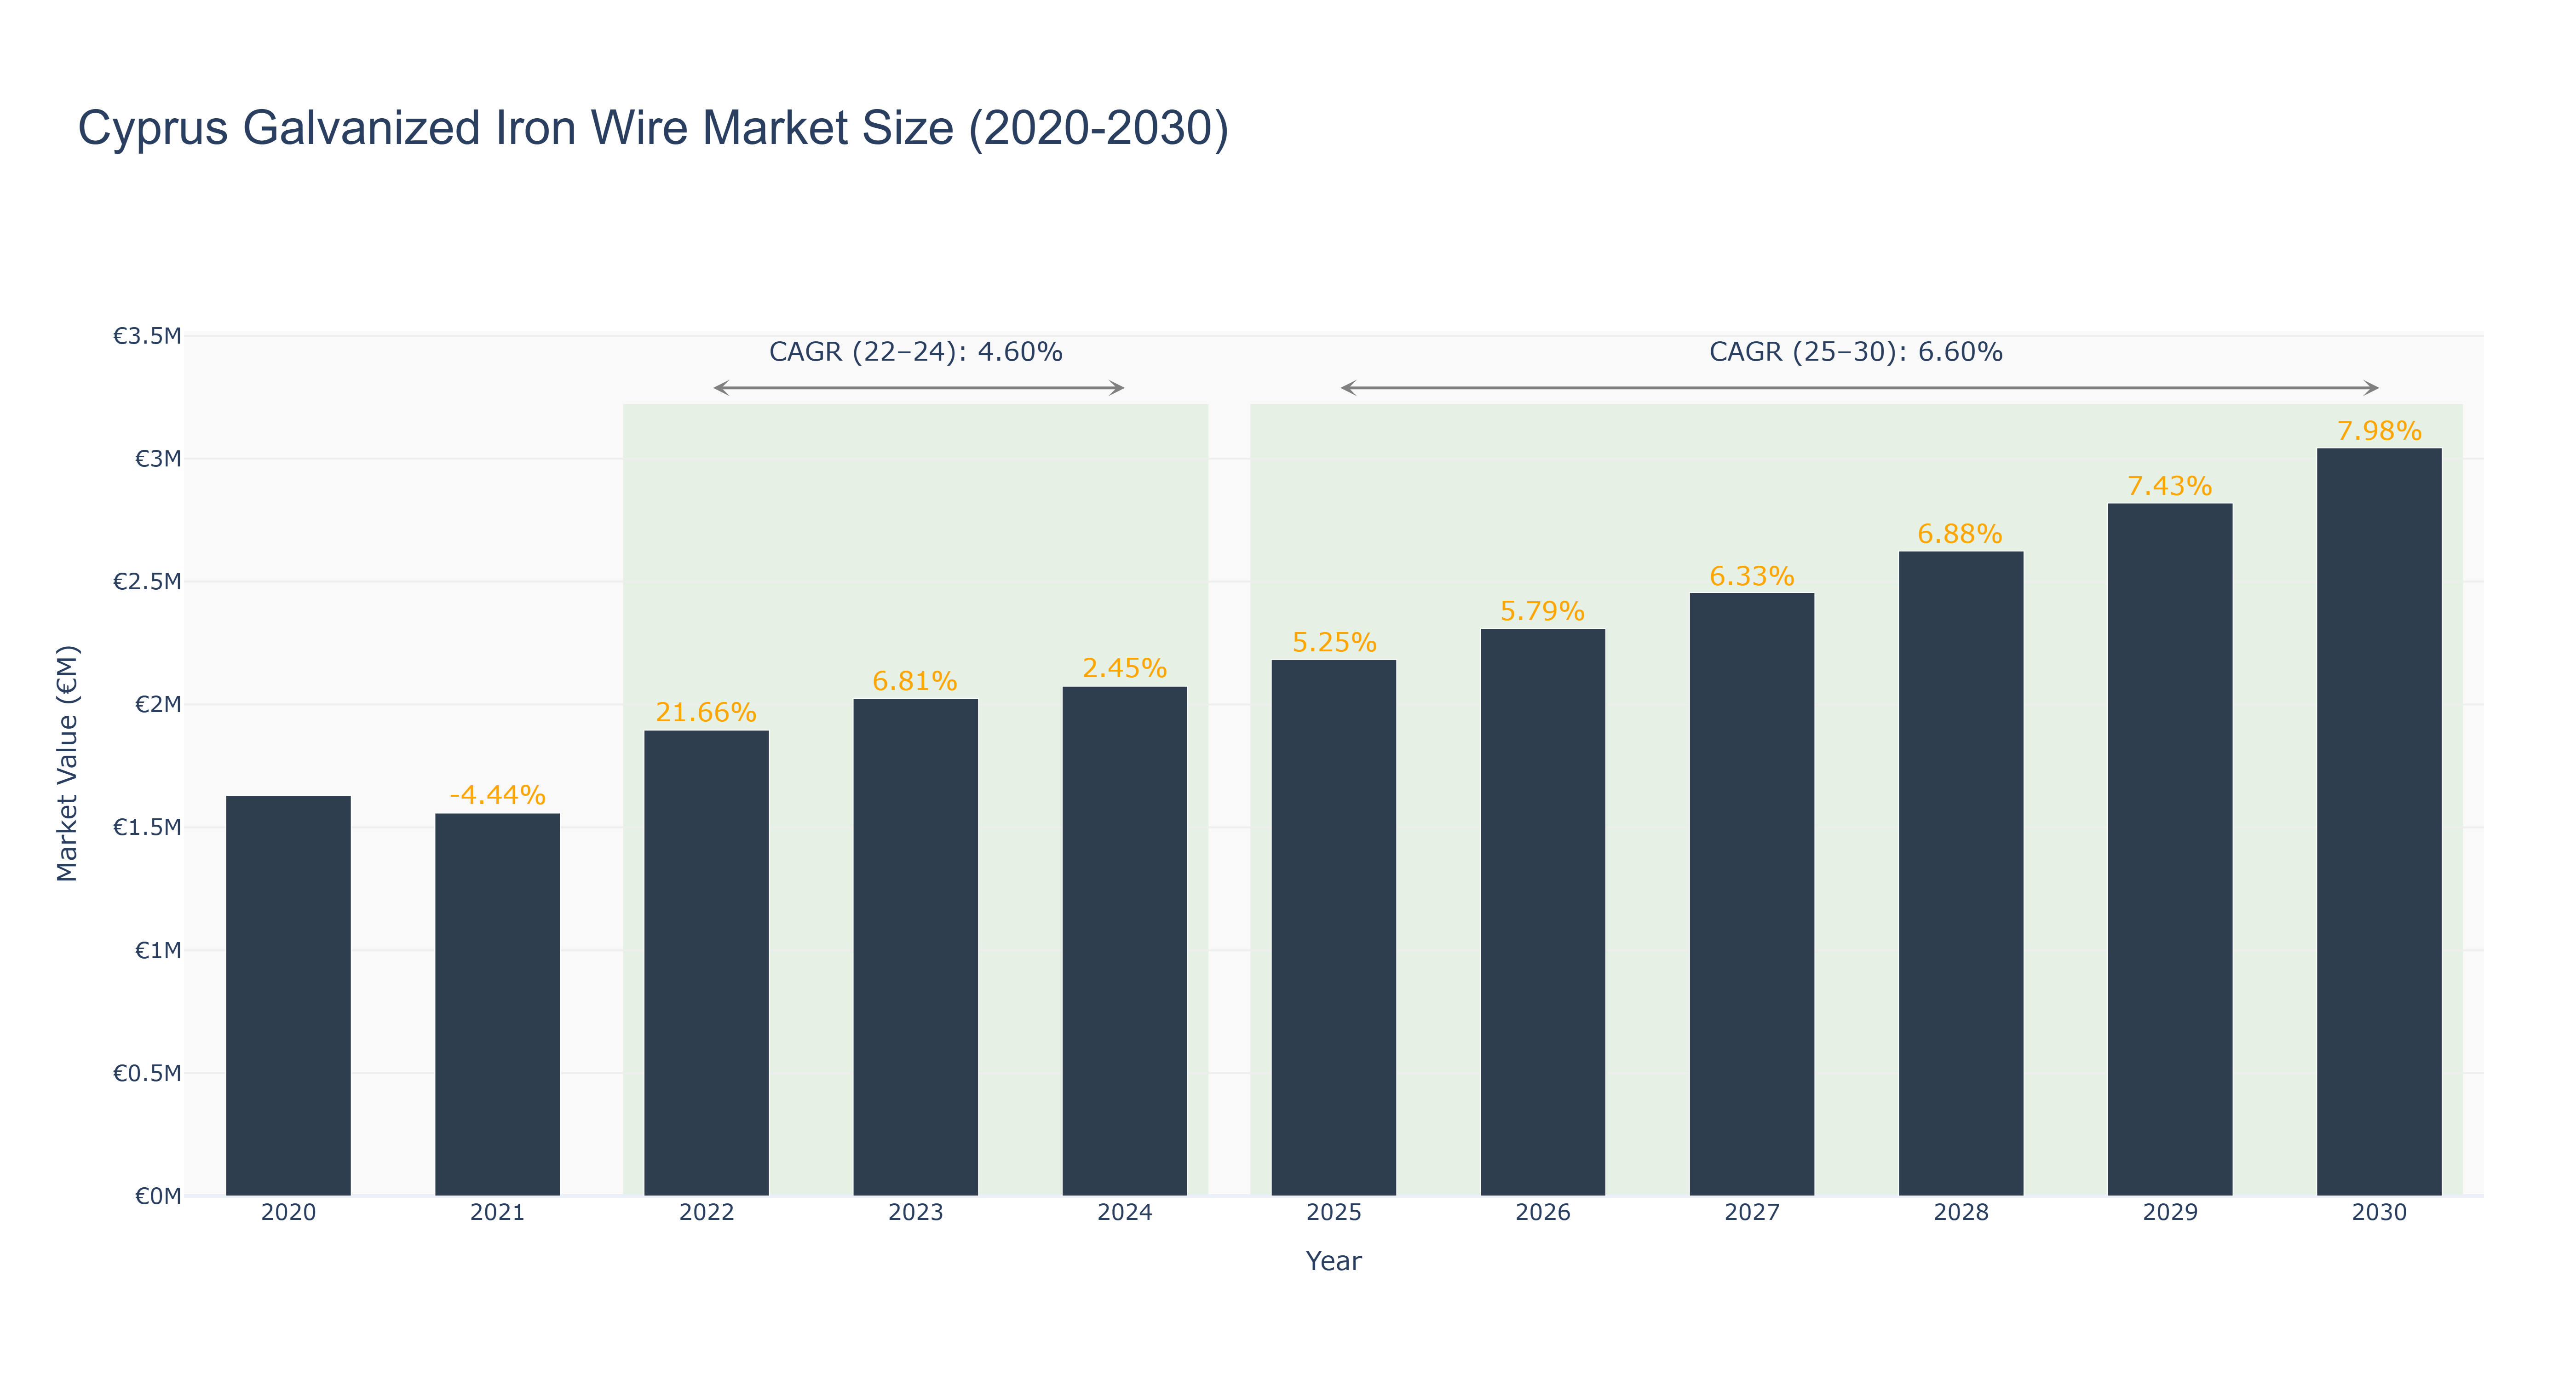
The Cyprus Galvanized Iron Wire Market has shown a steady growth trend over the years. The peak market size of €3.04 million is projected for 2030, with a consistent increase in market size from €1.63 million in 2020 to €2.07 million in 2024. The forecasted market size is expected to reach €3.04 million by 2030, with a CAGR of 4.60% from 2022 to 2024 and a higher CAGR of 6.60% from 2025 to 2030. The market's growth can be attributed to increasing construction activities and infrastructure development in Cyprus. Recent developments include collaborations with international wire manufacturers to enhance product quality and expand market reach. Future projects focus on implementing advanced technologies for wire production to meet growing demand in the construction sector.
Cyprus Galvanized Iron Wire Market: Production & Trade Performance (2019-2025)
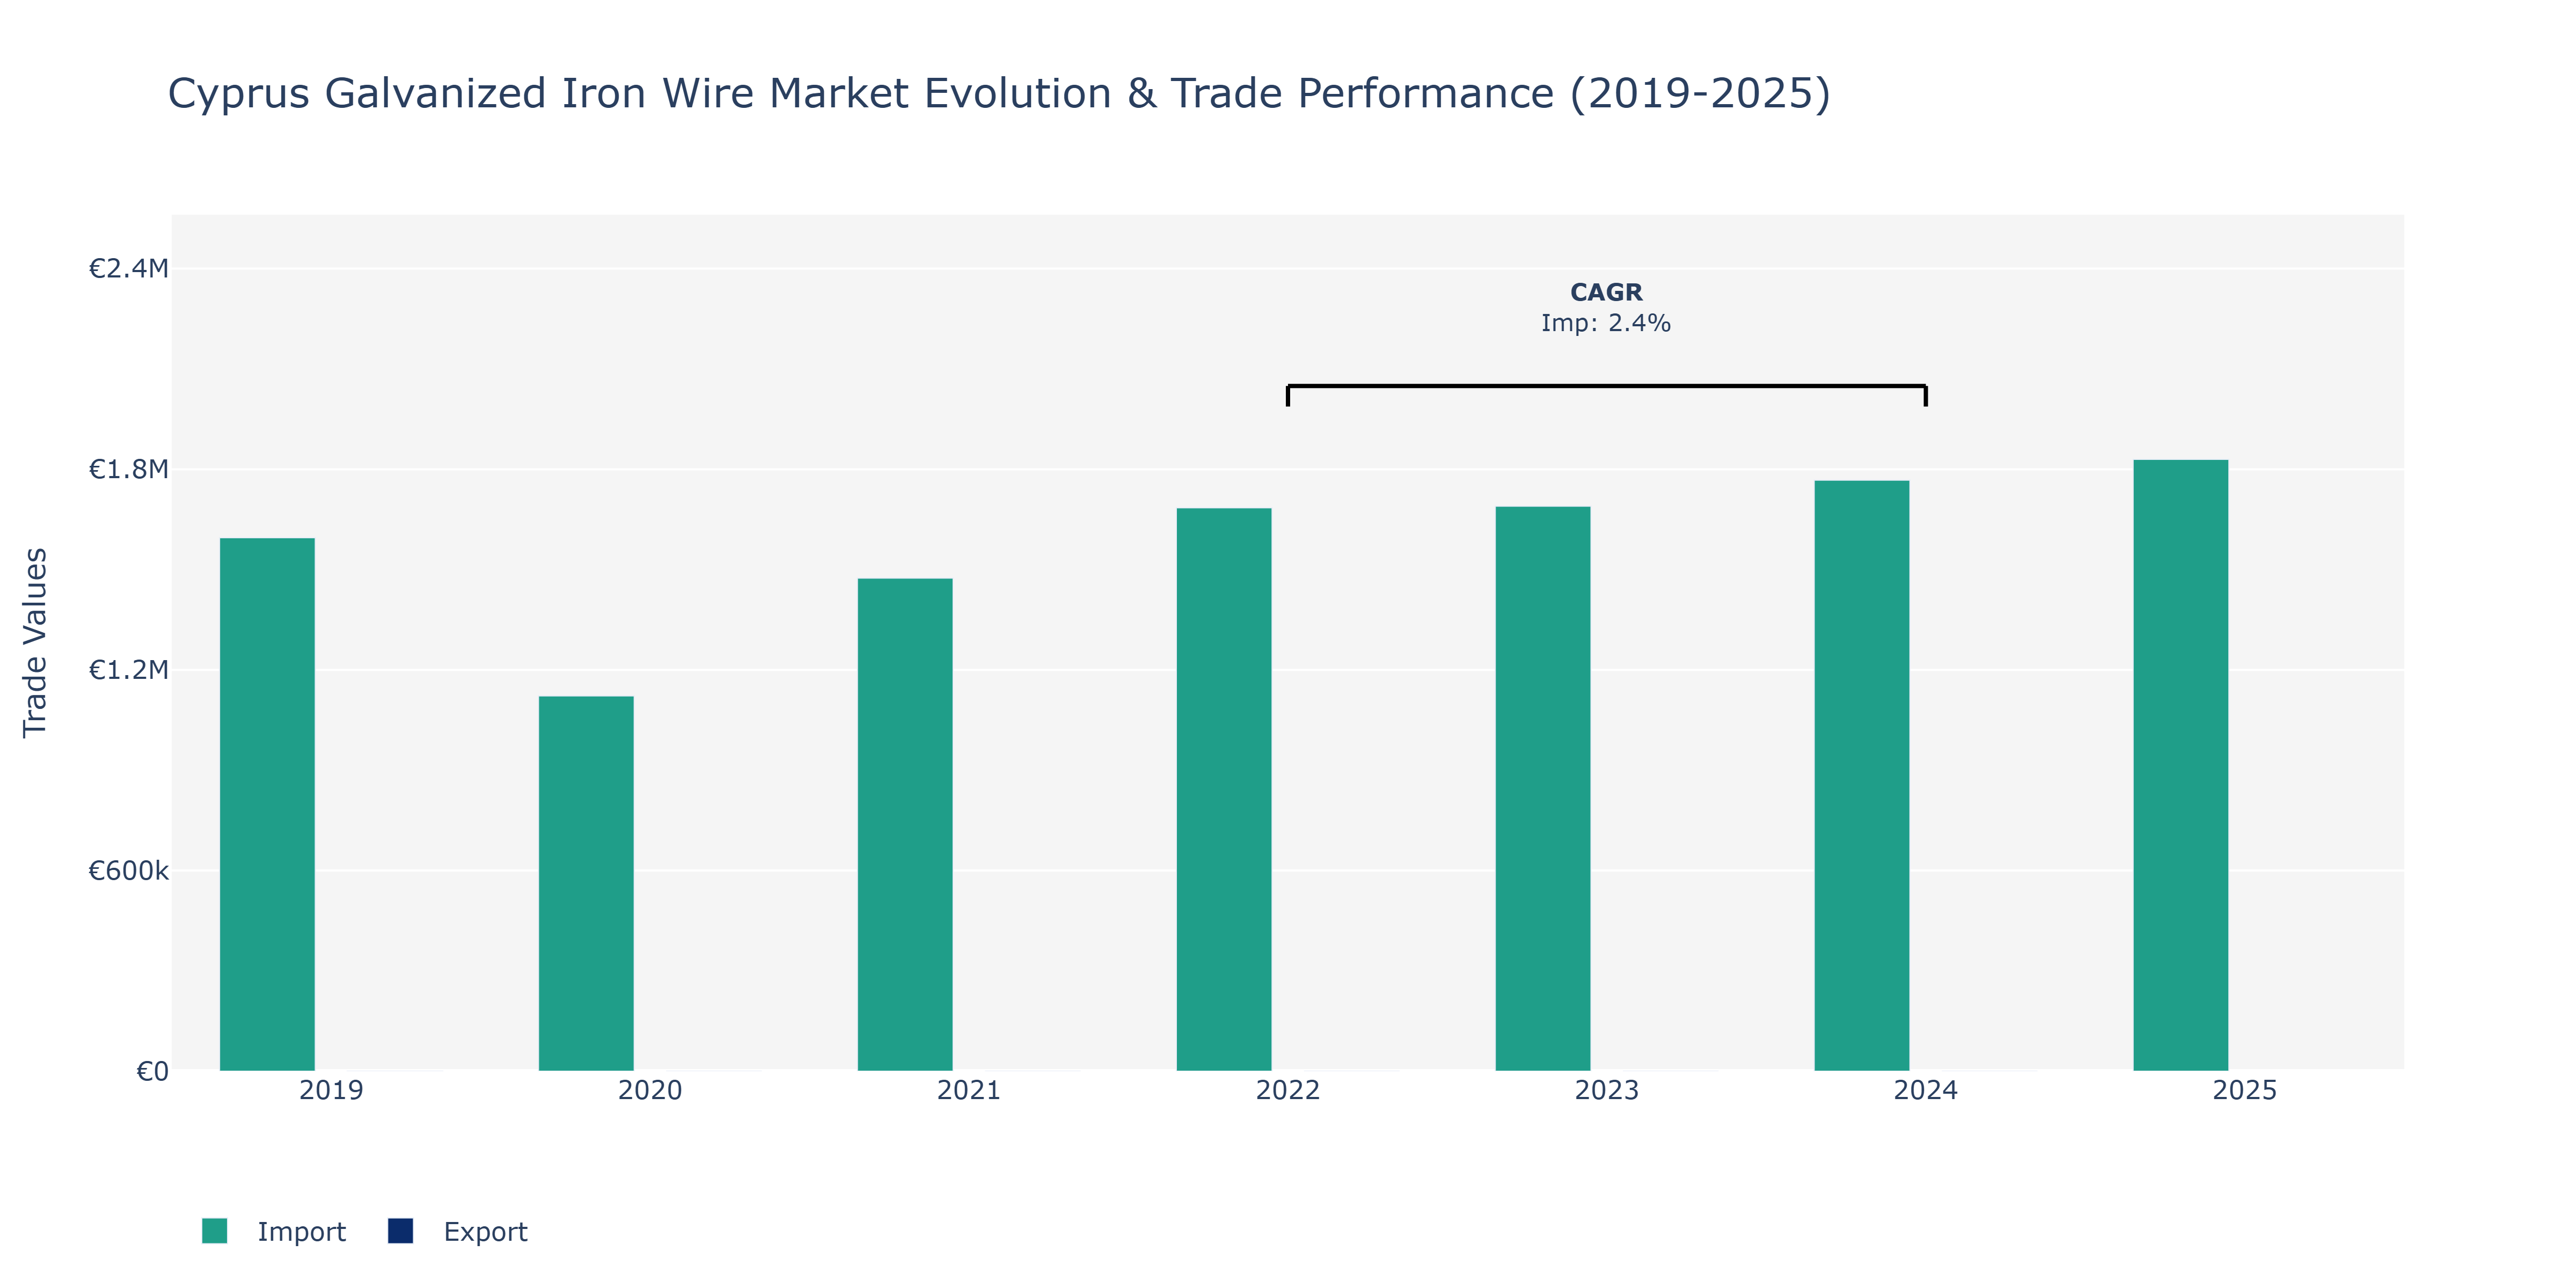
In the Cyprus Galvanized Iron Wire Market, the exports remained constant at €70.0 million throughout the reported years. Meanwhile, imports experienced a steady upward trajectory, starting at €1.6 million in 2019 and reaching €1.83 million by 2025. Notably, the year 2020 saw a significant increase in imports to €1.12 million, followed by consistent growth thereafter. The market's reliance on imports can be attributed to the country's limited domestic production capacity and the demand for galvanized iron wire in construction and manufacturing sectors. Factors such as infrastructure development projects and the expanding industrial activities in Cyprus likely fueled the continuous rise in imports. The market's stability in exports suggests a balance between domestic consumption and foreign trade dynamics, indicating a strategic positioning within the global iron wire market.
Key Highlights of the Report:
- Cyprus Galvanized Iron Wire Market Outlook
- Market Size of Cyprus Galvanized Iron Wire Market, 2024
- Forecast of Cyprus Galvanized Iron Wire Market, 2031
- Historical Data and Forecast of Cyprus Galvanized Iron Wire Revenues & Volume for the Period 2021-2031
- Cyprus Galvanized Iron Wire Market Trend Evolution
- Cyprus Galvanized Iron Wire Market Drivers and Challenges
- Cyprus Galvanized Iron Wire Price Trends
- Cyprus Galvanized Iron Wire Porter`s Five Forces
- Cyprus Galvanized Iron Wire Industry Life Cycle
- Historical Data and Forecast of Cyprus Galvanized Iron Wire Market Revenues & Volume By Product for the Period 2021-2031
- Historical Data and Forecast of Cyprus Galvanized Iron Wire Market Revenues & Volume By Hot Galvanized Iron Wire for the Period 2021-2031
- Historical Data and Forecast of Cyprus Galvanized Iron Wire Market Revenues & Volume By Cold Galvanized Iron Wire for the Period 2021-2031
- Historical Data and Forecast of Cyprus Galvanized Iron Wire Market Revenues & Volume By Application for the Period 2021-2031
- Historical Data and Forecast of Cyprus Galvanized Iron Wire Market Revenues & Volume By Building for the Period 2021-2031
- Historical Data and Forecast of Cyprus Galvanized Iron Wire Market Revenues & Volume By Handicrafts for the Period 2021-2031
- Historical Data and Forecast of Cyprus Galvanized Iron Wire Market Revenues & Volume By Weaving Screen for the Period 2021-2031
- Historical Data and Forecast of Cyprus Galvanized Iron Wire Market Revenues & Volume By Wipe Wall Net for the Period 2021-2031
- Historical Data and Forecast of Cyprus Galvanized Iron Wire Market Revenues & Volume By Highway Guardrail for the Period 2021-2031
- Historical Data and Forecast of Cyprus Galvanized Iron Wire Market Revenues & Volume By Packaging for the Period 2021-2031
- Historical Data and Forecast of Cyprus Galvanized Iron Wire Market Revenues & Volume By Daily Civilian Use for the Period 2021-2031
- Historical Data and Forecast of Cyprus Galvanized Iron Wire Market Revenues & Volume By Others for the Period 2021-2031
- Cyprus Galvanized Iron Wire Import Export Trade Statistics
- Market Opportunity Assessment By Product
- Market Opportunity Assessment By Application
- Cyprus Galvanized Iron Wire Top Companies Market Share
- Cyprus Galvanized Iron Wire Competitive Benchmarking By Technical and Operational Parameters
- Cyprus Galvanized Iron Wire Company Profiles
- Cyprus Galvanized Iron Wire Key Strategic Recommendations
Frequently Asked Questions About the Market Study (FAQs):
6Wresearch actively monitors the Cyprus Galvanized Iron Wire Market and publishes its comprehensive annual report, highlighting emerging trends, growth drivers, revenue analysis, and forecast outlook. Our insights help businesses to make data-backed strategic decisions with ongoing market dynamics. Our analysts track relevent industries related to the Cyprus Galvanized Iron Wire Market, allowing our clients with actionable intelligence and reliable forecasts tailored to emerging regional needs.
Yes, we provide customisation as per your requirements. To learn more, feel free to contact us on sales@6wresearch.com
1 Executive Summary |
2 Introduction |
2.1 Key Highlights of the Report |
2.2 Report Description |
2.3 Market Scope & Segmentation |
2.4 Research Methodology |
2.5 Assumptions |
3 Cyprus Galvanized Iron Wire Market Overview |
3.1 Cyprus Country Macro Economic Indicators |
3.2 Cyprus Galvanized Iron Wire Market Revenues & Volume, 2021 & 2031F |
3.3 Cyprus Galvanized Iron Wire Market - Industry Life Cycle |
3.4 Cyprus Galvanized Iron Wire Market - Porter's Five Forces |
3.5 Cyprus Galvanized Iron Wire Market Revenues & Volume Share, By Product, 2021 & 2031F |
3.6 Cyprus Galvanized Iron Wire Market Revenues & Volume Share, By Application, 2021 & 2031F |
4 Cyprus Galvanized Iron Wire Market Dynamics |
4.1 Impact Analysis |
4.2 Market Drivers |
4.3 Market Restraints |
5 Cyprus Galvanized Iron Wire Market Trends |
6 Cyprus Galvanized Iron Wire Market Segmentations |
6.1 Cyprus Galvanized Iron Wire Market, By Product |
6.1.1 Overview and Analysis |
6.1.2 Cyprus Galvanized Iron Wire Market Revenues & Volume, By Hot Galvanized Iron Wire, 2021-2031F |
6.1.3 Cyprus Galvanized Iron Wire Market Revenues & Volume, By Cold Galvanized Iron Wire, 2021-2031F |
6.2 Cyprus Galvanized Iron Wire Market, By Application |
6.2.1 Overview and Analysis |
6.2.2 Cyprus Galvanized Iron Wire Market Revenues & Volume, By Building, 2021-2031F |
6.2.3 Cyprus Galvanized Iron Wire Market Revenues & Volume, By Handicrafts, 2021-2031F |
6.2.4 Cyprus Galvanized Iron Wire Market Revenues & Volume, By Weaving Screen, 2021-2031F |
6.2.5 Cyprus Galvanized Iron Wire Market Revenues & Volume, By Wipe Wall Net, 2021-2031F |
6.2.6 Cyprus Galvanized Iron Wire Market Revenues & Volume, By Highway Guardrail, 2021-2031F |
6.2.7 Cyprus Galvanized Iron Wire Market Revenues & Volume, By Packaging, 2021-2031F |
6.2.8 Cyprus Galvanized Iron Wire Market Revenues & Volume, By Others, 2021-2031F |
6.2.9 Cyprus Galvanized Iron Wire Market Revenues & Volume, By Others, 2021-2031F |
7 Cyprus Galvanized Iron Wire Market Import-Export Trade Statistics |
7.1 Cyprus Galvanized Iron Wire Market Export to Major Countries |
7.2 Cyprus Galvanized Iron Wire Market Imports from Major Countries |
8 Cyprus Galvanized Iron Wire Market Key Performance Indicators |
9 Cyprus Galvanized Iron Wire Market - Opportunity Assessment |
9.1 Cyprus Galvanized Iron Wire Market Opportunity Assessment, By Product, 2021 & 2031F |
9.2 Cyprus Galvanized Iron Wire Market Opportunity Assessment, By Application, 2021 & 2031F |
10 Cyprus Galvanized Iron Wire Market - Competitive Landscape |
10.1 Cyprus Galvanized Iron Wire Market Revenue Share, By Companies, 2024 |
10.2 Cyprus Galvanized Iron Wire Market Competitive Benchmarking, By Operating and Technical Parameters |
11 Company Profiles |
12 Recommendations | 13 Disclaimer |
Global Go To Market Strategy - 2030
Export potential enables firms to identify high-growth global markets with greater confidence by combining advanced trade intelligence with a structured quantitative methodology. The framework analyzes emerging demand trends and country-level import patterns while integrating macroeconomic and trade datasets such as GDP and population forecasts, bilateral import–export flows, tariff structures, elasticity differentials between developed and developing economies, geographic distance, and import demand projections. Using weighted trade values from 2020–2024 as the base period to project country-to-country export potential for 2030, these inputs are operationalized through calculated drivers such as gravity model parameters, tariff impact factors, and projected GDP per-capita growth. Through an analysis of hidden potentials, demand hotspots, and market conditions that are most favorable to success, this method enables firms to focus on target countries, maximize returns, and global expansion with data, backed by accuracy.
By factoring in the projected importer demand gap that is currently unmet and could be potential opportunity, it identifies the potential for the Exporter (Country) among 190 countries, against the general trade analysis, which identifies the biggest importer or exporter.
To discover high-growth global markets and optimize your business strategy:
Click Here
Pricing
- Single User License$ 1,995
- Department License$ 2,400
- Site License$ 3,120
- Global License$ 3,795

Leadership Perspectives from Industry Events
Search
Thought Leadership and Analyst Meet


Our Clients
6WResearch In News
- Doha a strategic location for EV manufacturing hub: IPA Qatar
- Demand for luxury TVs surging in the GCC, says Samsung
- Empowering Growth: The Thriving Journey of Bangladesh’s Cable Industry
- Demand for luxury TVs surging in the GCC, says Samsung
- Video call with a traditional healer? Once unthinkable, it’s now common in South Africa
- Intelligent Buildings To Smooth GCC’s Path To Net Zero
Latest Reports
- Taiwan Airport Wireless Infrastructure Market (2026-2032)
- Vietnam Airport Wireless Infrastructure Market (2026-2032)
- Thailand Airport Wireless Infrastructure Market (2026-2032)
- South Korea Airport Wireless Infrastructure Market (2026-2032)
- Romania Airport Wireless Infrastructure Market (2026-2032)
- Qatar Airport Wireless Infrastructure Market (2026-2032)
- Philippines Airport Wireless Infrastructure Market (2026-2032)
- Japan Airport Wireless Infrastructure Market (2026-2032)
- Taiwan Airport Winter Services Market (2026-2032)
- Vietnam Airport Winter Services Market (2026-2032)
Industry Events and Analyst Meet

HIMTEX 2026

India Refining Summit 2026

India EV Show 2026

EV tech India Expo 2026

Auto Tech Asia 2026
Whitepaper
- Middle East & Africa Commercial Security Market Click here to view more.
- Middle East & Africa Fire Safety Systems & Equipment Market Click here to view more.
- GCC Drone Market Click here to view more.
- Middle East Lighting Fixture Market Click here to view more.
- GCC Physical & Perimeter Security Market Click here to view more.