Cyprus Sodium Silicate Market (2025-2031) | Share, Companies, Value, Outlook, Forecast, Trends, Analysis, Revenue, Size, Segmentation, Growth & Industry
Market Forecast By Form (Crystalline, Anhydrous), By Type (Liquid, Solid), By Grade (Neutral, Alkaline), By Application (Paints, Adhesives, Refractories, Tube Winding, Detergent, Catalyst, Others), By End Use (Pulp & Paper, Construction, Automotive, Others) And Competitive Landscape
| Product Code: ETC4681491 | Publication Date: Nov 2023 | Updated Date: Apr 2026 | Product Type: Market Research Report | |
| Publisher: 6Wresearch | Author: Shubham Padhi | No. of Pages: 60 | No. of Figures: 30 | No. of Tables: 5 |
Cyprus Sodium Silicate Market Size (2020-2030)
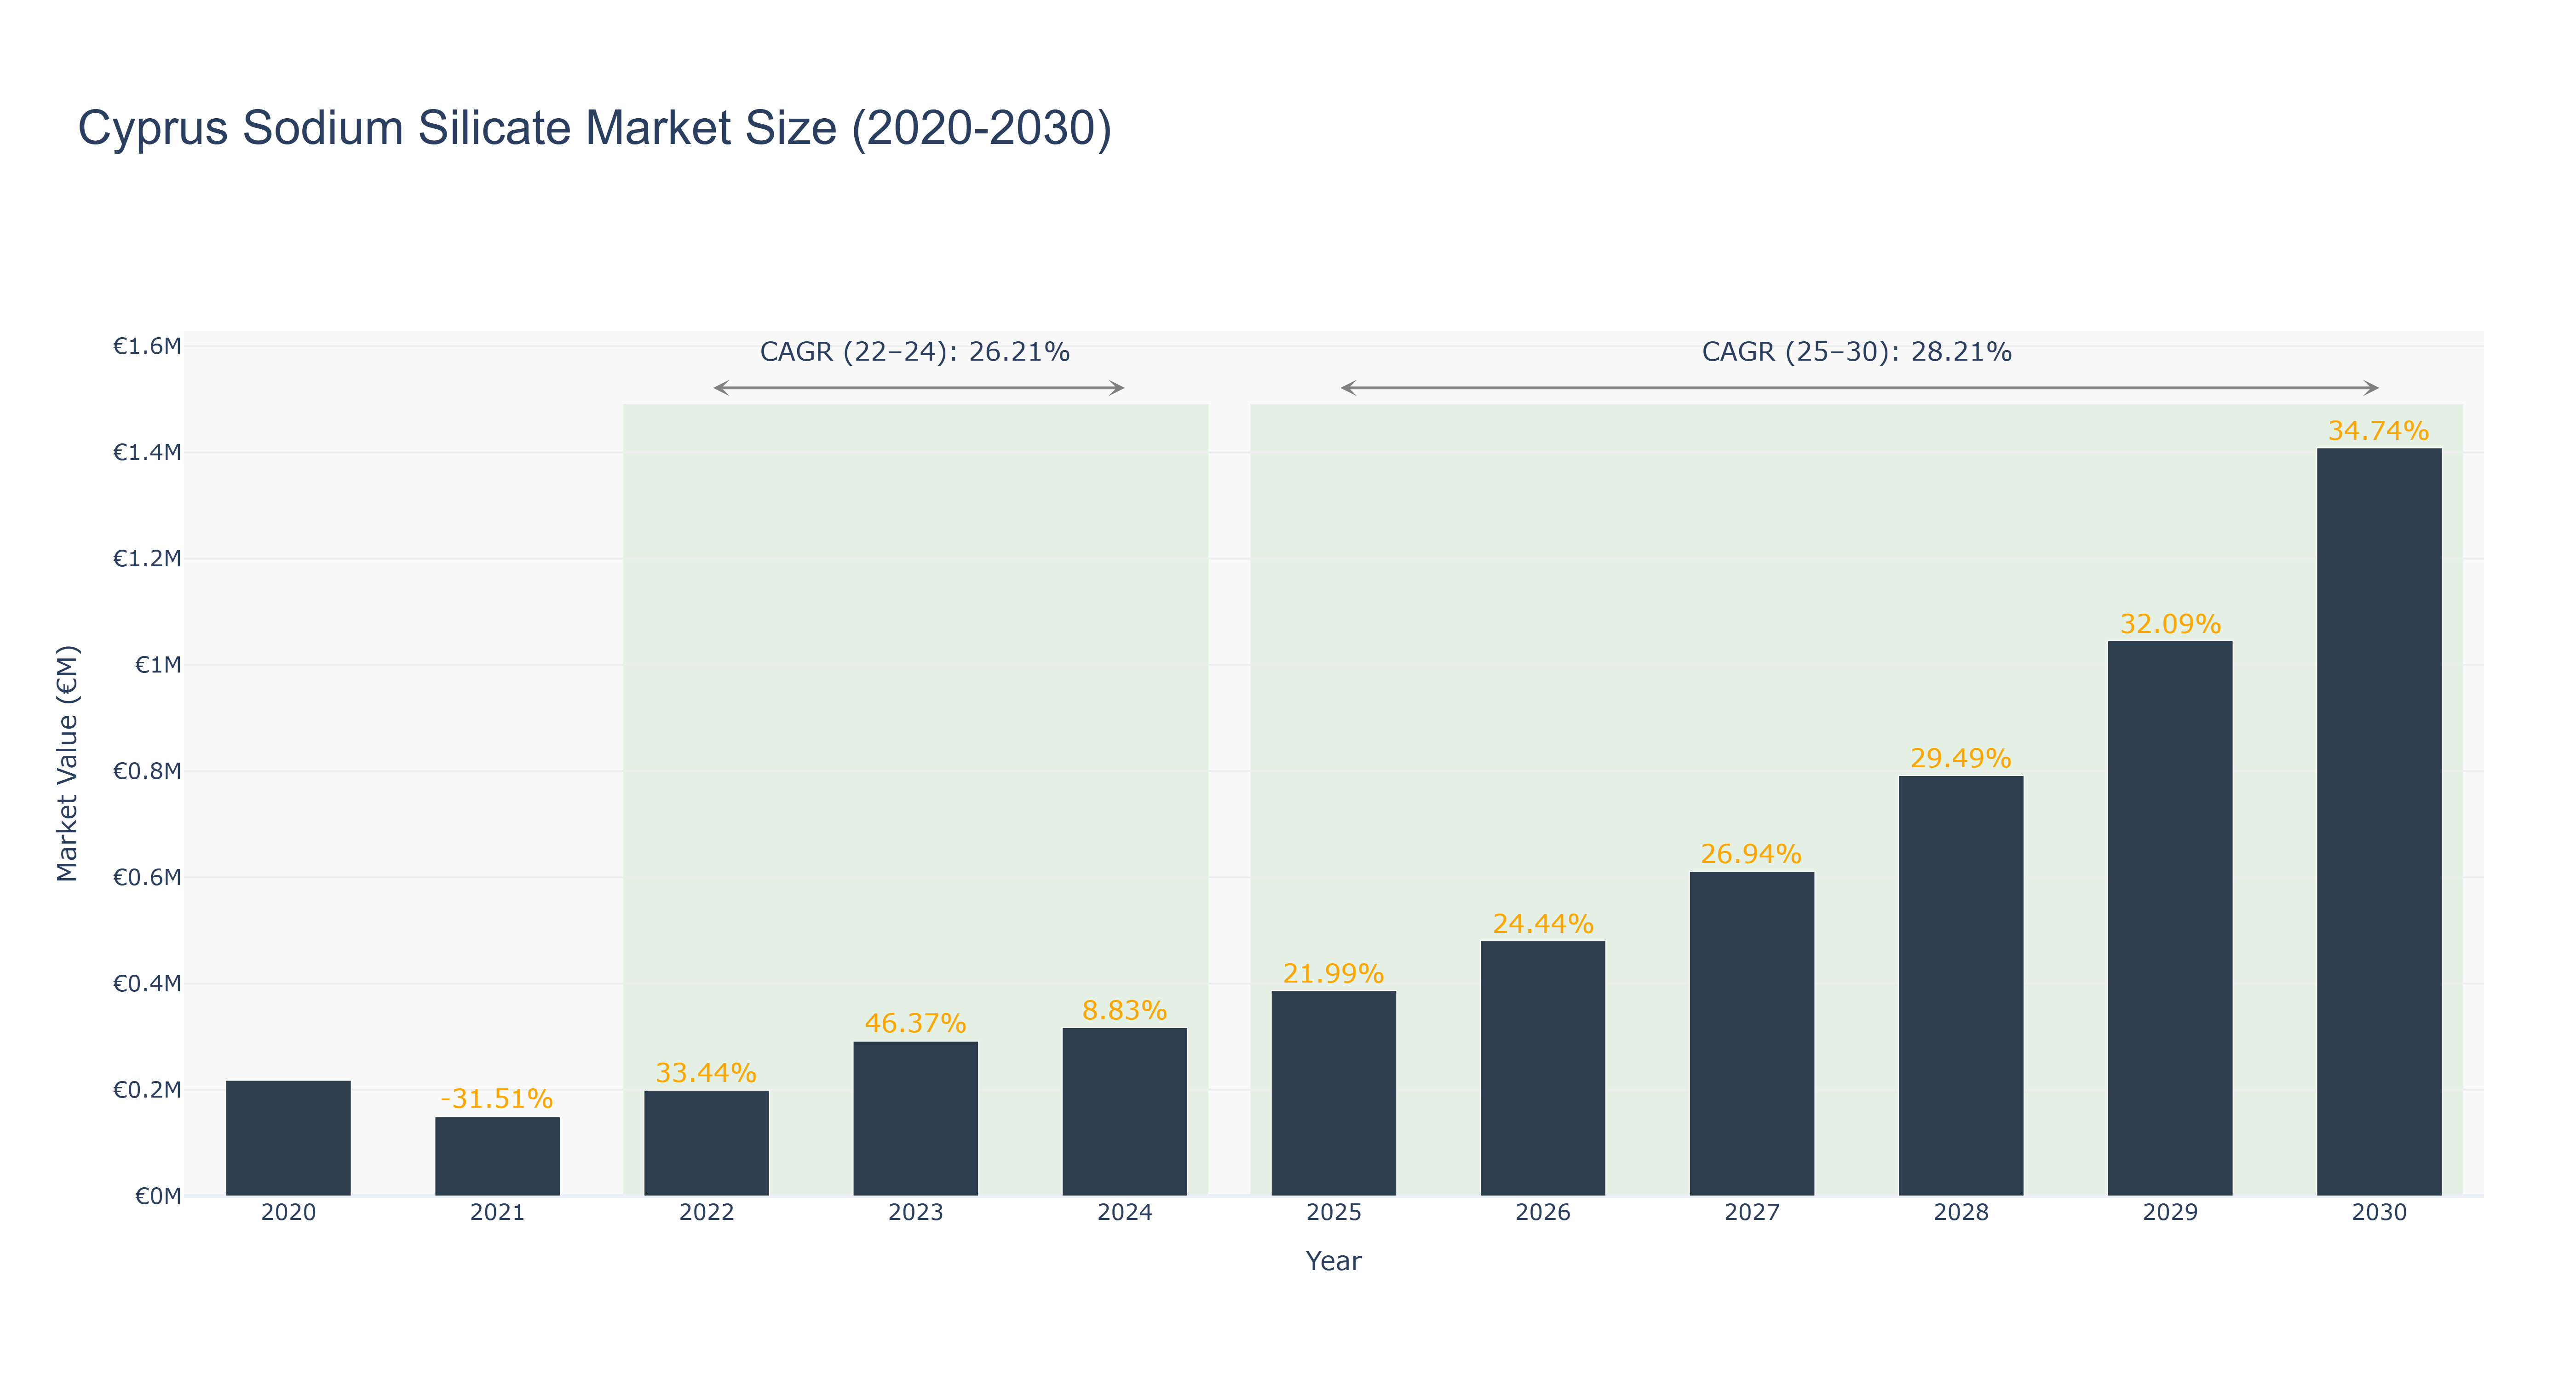
Cyprus Sodium Silicate Market has shown a notable growth trend over the past decade. The peak market size of €1.41 million is forecasted for 2030, with a steady increase from €0.22 million in 2020. The market experienced a decline in 2021 due to a -31.51% decrease, possibly influenced by economic factors. However, the market quickly rebounded, showing consistent growth with a CAGR of 26.21% from 2022 to 2024 and a higher CAGR of 28.21% from 2025 to 2030. Industry drivers such as increased demand for sodium silicate in various applications like detergents and construction have contributed to this positive trend. Looking ahead, upcoming projects in sustainable construction materials using sodium silicate are expected to drive further market expansion in Cyprus.
Cyprus Sodium Silicate Market: Production & Trade Performance (2019-2025)
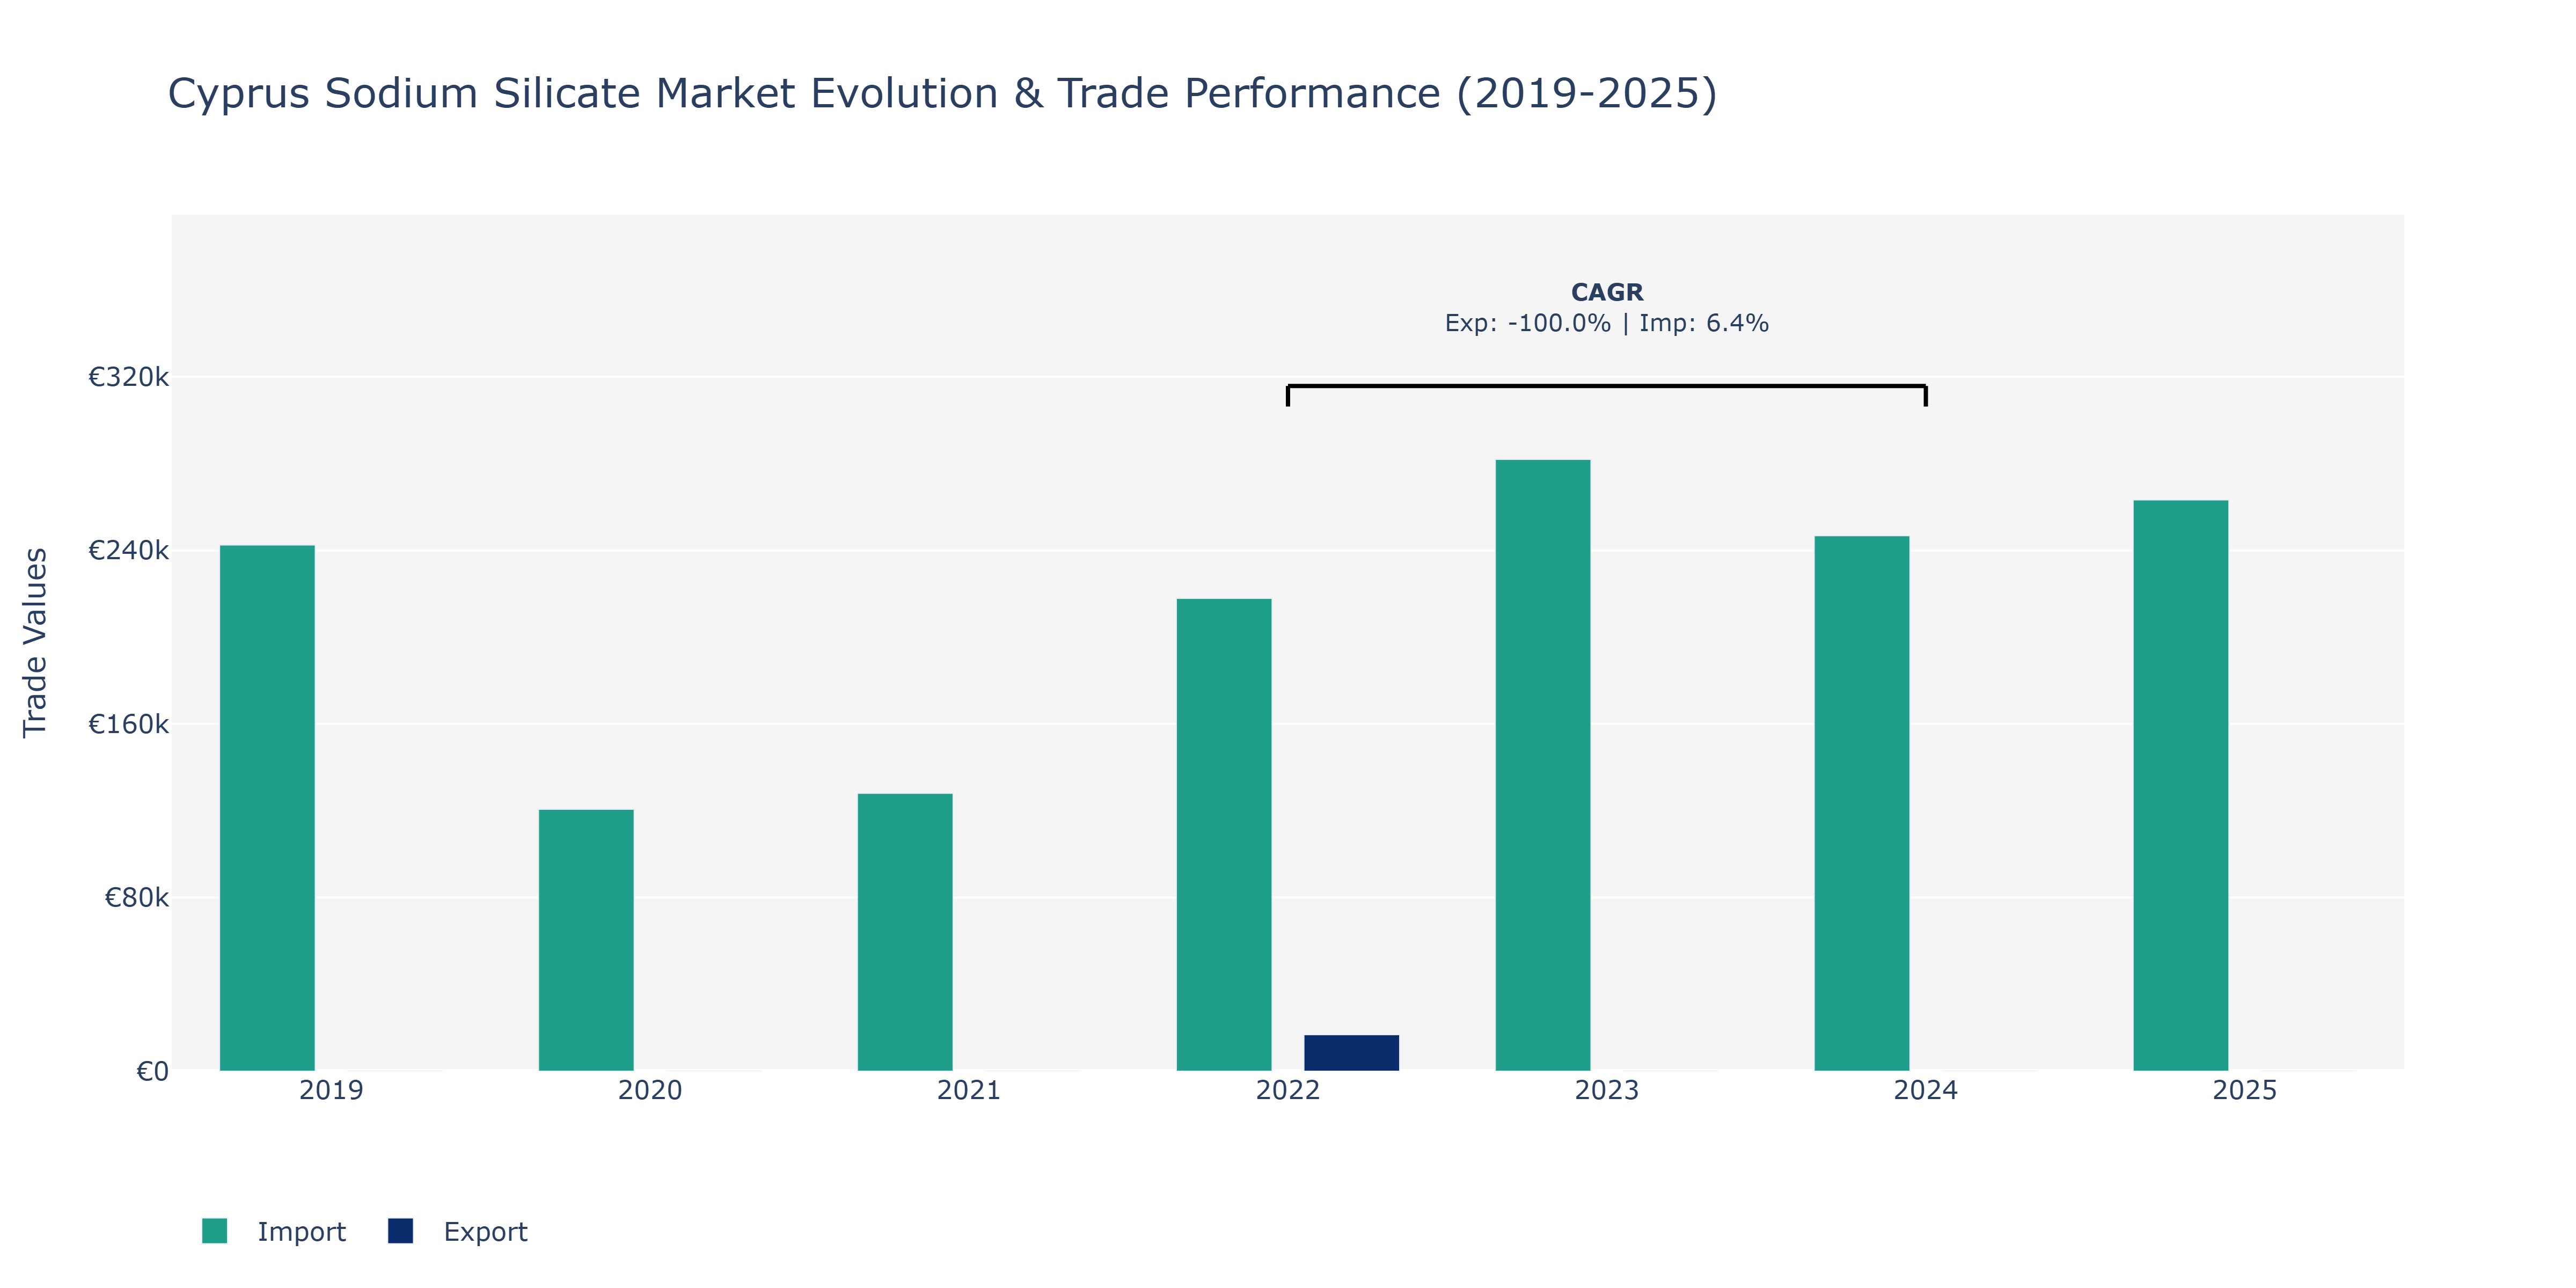
Between 2019 and 2025, the Cyprus Sodium Silicate Market displayed varied performance in both Exports and Imports. In 2019, Imports stood at €242.44 thousand, showing a noticeable decline in 2020 to €120.66 thousand before a slight recovery in 2021 to €128.03 thousand. The peak point for Imports was observed in 2023 at €281.91 thousand, followed by a decrease in the subsequent years. Exports, on the other hand, began at €16.8 thousand in 2022, indicating a significant increase in value from the previous year. This suggests a potential shift in market dynamics towards higher export activities. The growth in Imports can be attributed to increased demand for sodium silicate in various industries like construction, detergents, and water treatment, aligning with the global trend of rising consumption of specialty chemicals. The decline in Imports post-2023 could be a result of changing market conditions, such as shifts in consumer preferences or regulatory changes impacting trade flows.
Key Highlights of the Report:
- Cyprus Sodium Silicate Market Outlook
- Market Size of Cyprus Sodium Silicate Market, 2024
- Forecast of Cyprus Sodium Silicate Market, 2031
- Historical Data and Forecast of Cyprus Sodium Silicate Revenues & Volume for the Period 2021-2031
- Cyprus Sodium Silicate Market Trend Evolution
- Cyprus Sodium Silicate Market Drivers and Challenges
- Cyprus Sodium Silicate Price Trends
- Cyprus Sodium Silicate Porter`s Five Forces
- Cyprus Sodium Silicate Industry Life Cycle
- Historical Data and Forecast of Cyprus Sodium Silicate Market Revenues & Volume By Form for the Period 2021-2031
- Historical Data and Forecast of Cyprus Sodium Silicate Market Revenues & Volume By Crystalline for the Period 2021-2031
- Historical Data and Forecast of Cyprus Sodium Silicate Market Revenues & Volume By Anhydrous for the Period 2021-2031
- Historical Data and Forecast of Cyprus Sodium Silicate Market Revenues & Volume By Type for the Period 2021-2031
- Historical Data and Forecast of Cyprus Sodium Silicate Market Revenues & Volume By Liquid for the Period 2021-2031
- Historical Data and Forecast of Cyprus Sodium Silicate Market Revenues & Volume By Solid for the Period 2021-2031
- Historical Data and Forecast of Cyprus Sodium Silicate Market Revenues & Volume By Grade for the Period 2021-2031
- Historical Data and Forecast of Cyprus Sodium Silicate Market Revenues & Volume By Neutral for the Period 2021-2031
- Historical Data and Forecast of Cyprus Sodium Silicate Market Revenues & Volume By Alkaline for the Period 2021-2031
- Historical Data and Forecast of Cyprus Sodium Silicate Market Revenues & Volume By Application for the Period 2021-2031
- Historical Data and Forecast of Cyprus Sodium Silicate Market Revenues & Volume By Paints for the Period 2021-2031
- Historical Data and Forecast of Cyprus Sodium Silicate Market Revenues & Volume By Adhesives for the Period 2021-2031
- Historical Data and Forecast of Cyprus Sodium Silicate Market Revenues & Volume By Refractories for the Period 2021-2031
- Historical Data and Forecast of Cyprus Sodium Silicate Market Revenues & Volume By Tube Winding for the Period 2021-2031
- Historical Data and Forecast of Cyprus Sodium Silicate Market Revenues & Volume By Detergent for the Period 2021-2031
- Historical Data and Forecast of Cyprus Sodium Silicate Market Revenues & Volume By Catalyst for the Period 2021-2031
- Historical Data and Forecast of Cyprus Sodium Silicate Market Revenues & Volume By Others for the Period 2021-2031
- Historical Data and Forecast of Cyprus Sodium Silicate Market Revenues & Volume By End Use for the Period 2021-2031
- Historical Data and Forecast of Cyprus Sodium Silicate Market Revenues & Volume By Pulp & Paper for the Period 2021-2031
- Historical Data and Forecast of Cyprus Sodium Silicate Market Revenues & Volume By Construction for the Period 2021-2031
- Historical Data and Forecast of Cyprus Sodium Silicate Market Revenues & Volume By Automotive for the Period 2021-2031
- Historical Data and Forecast of Cyprus Sodium Silicate Market Revenues & Volume By Others for the Period 2021-2031
- Cyprus Sodium Silicate Import Export Trade Statistics
- Market Opportunity Assessment By Form
- Market Opportunity Assessment By Type
- Market Opportunity Assessment By Grade
- Market Opportunity Assessment By Application
- Market Opportunity Assessment By End Use
- Cyprus Sodium Silicate Top Companies Market Share
- Cyprus Sodium Silicate Competitive Benchmarking By Technical and Operational Parameters
- Cyprus Sodium Silicate Company Profiles
- Cyprus Sodium Silicate Key Strategic Recommendations
Frequently Asked Questions About the Market Study (FAQs):
6Wresearch actively monitors the Cyprus Sodium Silicate Market and publishes its comprehensive annual report, highlighting emerging trends, growth drivers, revenue analysis, and forecast outlook. Our insights help businesses to make data-backed strategic decisions with ongoing market dynamics. Our analysts track relevent industries related to the Cyprus Sodium Silicate Market, allowing our clients with actionable intelligence and reliable forecasts tailored to emerging regional needs.
Yes, we provide customisation as per your requirements. To learn more, feel free to contact us on sales@6wresearch.com
1 Executive Summary |
2 Introduction |
2.1 Key Highlights of the Report |
2.2 Report Description |
2.3 Market Scope & Segmentation |
2.4 Research Methodology |
2.5 Assumptions |
3 Cyprus Sodium Silicate Market Overview |
3.1 Cyprus Country Macro Economic Indicators |
3.2 Cyprus Sodium Silicate Market Revenues & Volume, 2021 & 2031F |
3.3 Cyprus Sodium Silicate Market - Industry Life Cycle |
3.4 Cyprus Sodium Silicate Market - Porter's Five Forces |
3.5 Cyprus Sodium Silicate Market Revenues & Volume Share, By Form, 2021 & 2031F |
3.6 Cyprus Sodium Silicate Market Revenues & Volume Share, By Type, 2021 & 2031F |
3.7 Cyprus Sodium Silicate Market Revenues & Volume Share, By Grade, 2021 & 2031F |
3.8 Cyprus Sodium Silicate Market Revenues & Volume Share, By Application, 2021 & 2031F |
3.9 Cyprus Sodium Silicate Market Revenues & Volume Share, By End Use, 2021 & 2031F |
4 Cyprus Sodium Silicate Market Dynamics |
4.1 Impact Analysis |
4.2 Market Drivers |
4.3 Market Restraints |
5 Cyprus Sodium Silicate Market Trends |
6 Cyprus Sodium Silicate Market Segmentations |
6.1 Cyprus Sodium Silicate Market, By Form |
6.1.1 Overview and Analysis |
6.1.2 Cyprus Sodium Silicate Market Revenues & Volume, By Crystalline, 2021-2031F |
6.1.3 Cyprus Sodium Silicate Market Revenues & Volume, By Anhydrous, 2021-2031F |
6.2 Cyprus Sodium Silicate Market, By Type |
6.2.1 Overview and Analysis |
6.2.2 Cyprus Sodium Silicate Market Revenues & Volume, By Liquid, 2021-2031F |
6.2.3 Cyprus Sodium Silicate Market Revenues & Volume, By Solid, 2021-2031F |
6.3 Cyprus Sodium Silicate Market, By Grade |
6.3.1 Overview and Analysis |
6.3.2 Cyprus Sodium Silicate Market Revenues & Volume, By Neutral, 2021-2031F |
6.3.3 Cyprus Sodium Silicate Market Revenues & Volume, By Alkaline, 2021-2031F |
6.4 Cyprus Sodium Silicate Market, By Application |
6.4.1 Overview and Analysis |
6.4.2 Cyprus Sodium Silicate Market Revenues & Volume, By Paints, 2021-2031F |
6.4.3 Cyprus Sodium Silicate Market Revenues & Volume, By Adhesives, 2021-2031F |
6.4.4 Cyprus Sodium Silicate Market Revenues & Volume, By Refractories, 2021-2031F |
6.4.5 Cyprus Sodium Silicate Market Revenues & Volume, By Tube Winding, 2021-2031F |
6.4.6 Cyprus Sodium Silicate Market Revenues & Volume, By Detergent, 2021-2031F |
6.4.7 Cyprus Sodium Silicate Market Revenues & Volume, By Catalyst, 2021-2031F |
6.5 Cyprus Sodium Silicate Market, By End Use |
6.5.1 Overview and Analysis |
6.5.2 Cyprus Sodium Silicate Market Revenues & Volume, By Pulp & Paper, 2021-2031F |
6.5.3 Cyprus Sodium Silicate Market Revenues & Volume, By Construction, 2021-2031F |
6.5.4 Cyprus Sodium Silicate Market Revenues & Volume, By Automotive, 2021-2031F |
6.5.5 Cyprus Sodium Silicate Market Revenues & Volume, By Others, 2021-2031F |
7 Cyprus Sodium Silicate Market Import-Export Trade Statistics |
7.1 Cyprus Sodium Silicate Market Export to Major Countries |
7.2 Cyprus Sodium Silicate Market Imports from Major Countries |
8 Cyprus Sodium Silicate Market Key Performance Indicators |
9 Cyprus Sodium Silicate Market - Opportunity Assessment |
9.1 Cyprus Sodium Silicate Market Opportunity Assessment, By Form, 2021 & 2031F |
9.2 Cyprus Sodium Silicate Market Opportunity Assessment, By Type, 2021 & 2031F |
9.3 Cyprus Sodium Silicate Market Opportunity Assessment, By Grade, 2021 & 2031F |
9.4 Cyprus Sodium Silicate Market Opportunity Assessment, By Application, 2021 & 2031F |
9.5 Cyprus Sodium Silicate Market Opportunity Assessment, By End Use, 2021 & 2031F |
10 Cyprus Sodium Silicate Market - Competitive Landscape |
10.1 Cyprus Sodium Silicate Market Revenue Share, By Companies, 2024 |
10.2 Cyprus Sodium Silicate Market Competitive Benchmarking, By Operating and Technical Parameters |
11 Company Profiles |
12 Recommendations | 13 Disclaimer |
Export potential assessment - trade Analytics for 2030
Export potential enables firms to identify high-growth global markets with greater confidence by combining advanced trade intelligence with a structured quantitative methodology. The framework analyzes emerging demand trends and country-level import patterns while integrating macroeconomic and trade datasets such as GDP and population forecasts, bilateral import–export flows, tariff structures, elasticity differentials between developed and developing economies, geographic distance, and import demand projections. Using weighted trade values from 2020–2024 as the base period to project country-to-country export potential for 2030, these inputs are operationalized through calculated drivers such as gravity model parameters, tariff impact factors, and projected GDP per-capita growth. Through an analysis of hidden potentials, demand hotspots, and market conditions that are most favorable to success, this method enables firms to focus on target countries, maximize returns, and global expansion with data, backed by accuracy.
By factoring in the projected importer demand gap that is currently unmet and could be potential opportunity, it identifies the potential for the Exporter (Country) among 190 countries, against the general trade analysis, which identifies the biggest importer or exporter.
To discover high-growth global markets and optimize your business strategy:
Click Here
Pricing
- Single User License$ 1,995
- Department License$ 2,400
- Site License$ 3,120
- Global License$ 3,795

Search
Thought Leadership and Analyst Meet


Our Clients
Latest Reports
- Philippines Polyhydroxybutyrate-co-Hydroxyvalerate Market (2026-2032) | Trends, Insights, Challenges, Restraints, Competition, Size, Value, Forecast, Pricing, Share, Outlook, Revenue, Investment Opportunities, Strategy, Drivers, Demand, Growth, segmentation, Analysis, Companies
- Peru Polyhydroxybutyrate-co-Hydroxyvalerate Market (2026-2032) | Growth, Demand, Challenges, Share, Trends, Analysis, Pricing, Investment Opportunities, Drivers, Value, Forecast, Competition, Size, Companies, Insights, Outlook, Restraints, segmentation, Revenue, Strategy
- Pakistan Polyhydroxybutyrate-co-Hydroxyvalerate Market (2026-2032) | Restraints, segmentation, Pricing, Forecast, Share, Strategy, Competition, Trends, Insights, Drivers, Challenges, Growth, Revenue, Outlook, Value, Investment Opportunities, Companies, Size, Analysis, Demand
- Oman Polyhydroxybutyrate-co-Hydroxyvalerate Market (2026-2032) | Drivers, segmentation, Insights, Competition, Pricing, Outlook, Size, Revenue, Challenges, Forecast, Analysis, Growth, Value, Share, Trends, Investment Opportunities, Strategy, Restraints, Companies, Demand
- Nigeria Polyhydroxybutyrate-co-Hydroxyvalerate Market (2026-2032) | Value, Investment Opportunities, Analysis, Revenue, Restraints, Pricing, Outlook, Competition, Demand, Growth, Forecast, Companies, Trends, Challenges, segmentation, Drivers, Insights, Share, Size, Strategy
- Nepal Polyhydroxybutyrate-co-Hydroxyvalerate Market (2026-2032) | Insights, Analysis, Drivers, Share, Revenue, Demand, segmentation, Investment Opportunities, Competition, Forecast, Growth, Pricing, Companies, Strategy, Trends, Restraints, Challenges, Outlook, Size, Value
- Myanmar Polyhydroxybutyrate-co-Hydroxyvalerate Market (2026-2032) | Outlook, Revenue, Strategy, Restraints, Drivers, segmentation, Share, Forecast, Competition, Insights, Growth, Pricing, Size, Demand, Value, Companies, Trends, Challenges, Investment Opportunities, Analysis
- Morocco Polyhydroxybutyrate-co-Hydroxyvalerate Market (2026-2032) | Outlook, Investment Opportunities, Restraints, Strategy, Forecast, Challenges, Drivers, Growth, Companies, segmentation, Trends, Size, Competition, Revenue, Demand, Insights, Share, Analysis, Value, Pricing
- Mexico Polyhydroxybutyrate-co-Hydroxyvalerate Market (2026-2032) | Size, Drivers, Outlook, Share, Strategy, Growth, Pricing, Challenges, Companies, Demand, Value, Investment Opportunities, Restraints, Trends, Forecast, segmentation, Analysis, Insights, Competition, Revenue
- Malaysia Polyhydroxybutyrate-co-Hydroxyvalerate Market (2026-2032) | Share, segmentation, Size, Companies, Analysis, Insights, Forecast, Value, Revenue, Drivers, Restraints, Challenges, Investment Opportunities, Trends, Competition, Strategy, Demand, Growth, Outlook, Pricing
Industry Events and Analyst Meet

HIMTEX 2026

India Refining Summit 2026

India EV Show 2026

EV tech India Expo 2026

Auto Tech Asia 2026
Whitepaper
- Middle East & Africa Commercial Security Market Click here to view more.
- Middle East & Africa Fire Safety Systems & Equipment Market Click here to view more.
- GCC Drone Market Click here to view more.
- Middle East Lighting Fixture Market Click here to view more.
- GCC Physical & Perimeter Security Market Click here to view more.
6WResearch In News
- Doha a strategic location for EV manufacturing hub: IPA Qatar
- Demand for luxury TVs surging in the GCC, says Samsung
- Empowering Growth: The Thriving Journey of Bangladesh’s Cable Industry
- Demand for luxury TVs surging in the GCC, says Samsung
- Video call with a traditional healer? Once unthinkable, it’s now common in South Africa
- Intelligent Buildings To Smooth GCC’s Path To Net Zero