Denmark Bean-To-Bar Chocolate Market (2026-2032) | Size & Revenue, Growth, Outlook, Value, Analysis, Share, Companies, Competitive Landscape, Forecast, Trends, Industry, Segmentation
Market Forecast By Type (Dark Chocolate, Milk Chocolate, White Chocolate, Chocolate Bean, Others), By Application (Supermarkets, Convenience Stores, Independent Retailers, Online Sales, Others) And Competitive Landscape
| Product Code: ETC6954223 | Publication Date: Sep 2024 | Updated Date: Apr 2026 | Product Type: Market Research Report | |
| Publisher: 6Wresearch | Author: Summon Dutta | No. of Pages: 75 | No. of Figures: 35 | No. of Tables: 20 |
Denmark Bean-To-Bar Chocolate Market Size (2020-2030)
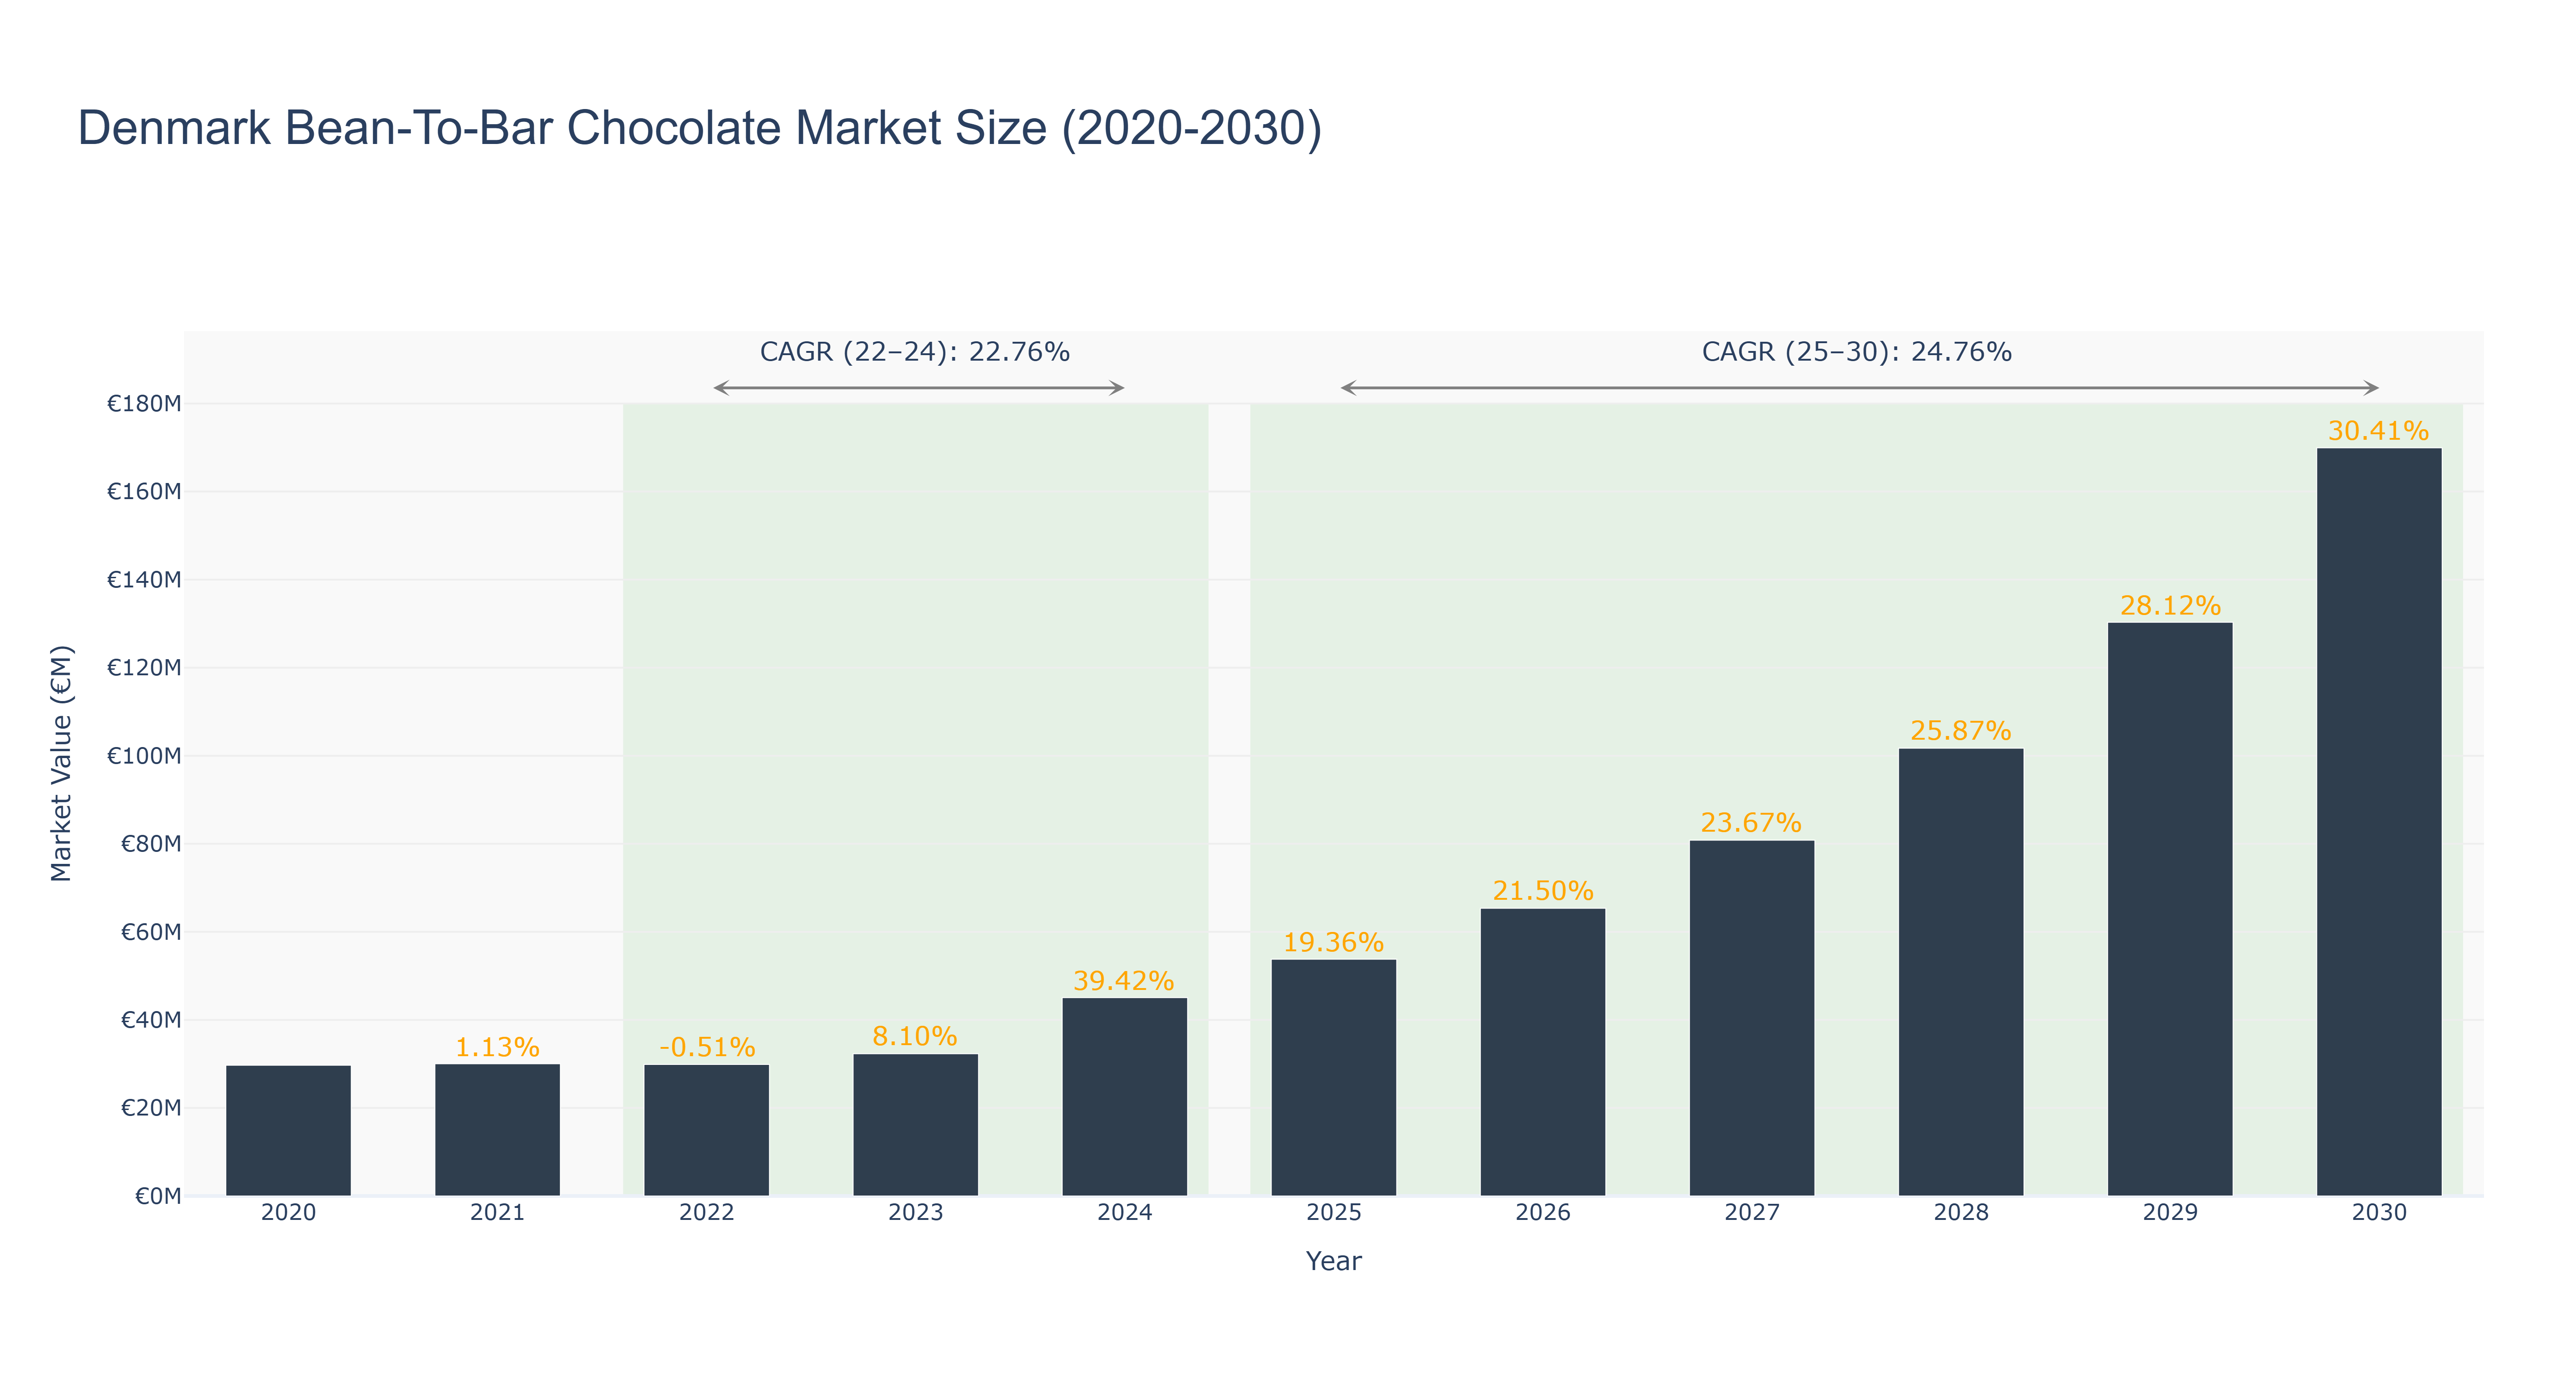
The Denmark Bean-To-Bar Chocolate Market has shown significant fluctuations in recent years, with a peak market size of €32.32 million recorded in 2023, reflecting an impressive growth rate of 8.10% from the previous year. Following a slight decline in 2022, the market rebounded sharply in 2023 and is expected to continue this upward trajectory, reaching €45.06 million in 2024, which corresponds to a robust CAGR of 22.76% for the actual period from 2022 to 2024. Looking ahead, the forecasted period from 2025 to 2030 anticipates further expansion, with the market projected to reach €169.94 million by 2030, demonstrating a CAGR of 24.76%. This growth is driven by increasing consumer preference for premium, artisanal chocolate products and a rising trend towards sustainable sourcing practices. As consumer awareness of health and environmental issues increases, the bean-to-bar segment is well-positioned to capitalize on these macro trends, fostering innovation and product diversification in the market.
Denmark Bean-To-Bar Chocolate Market: Production & Trade Performance (2019-2025)
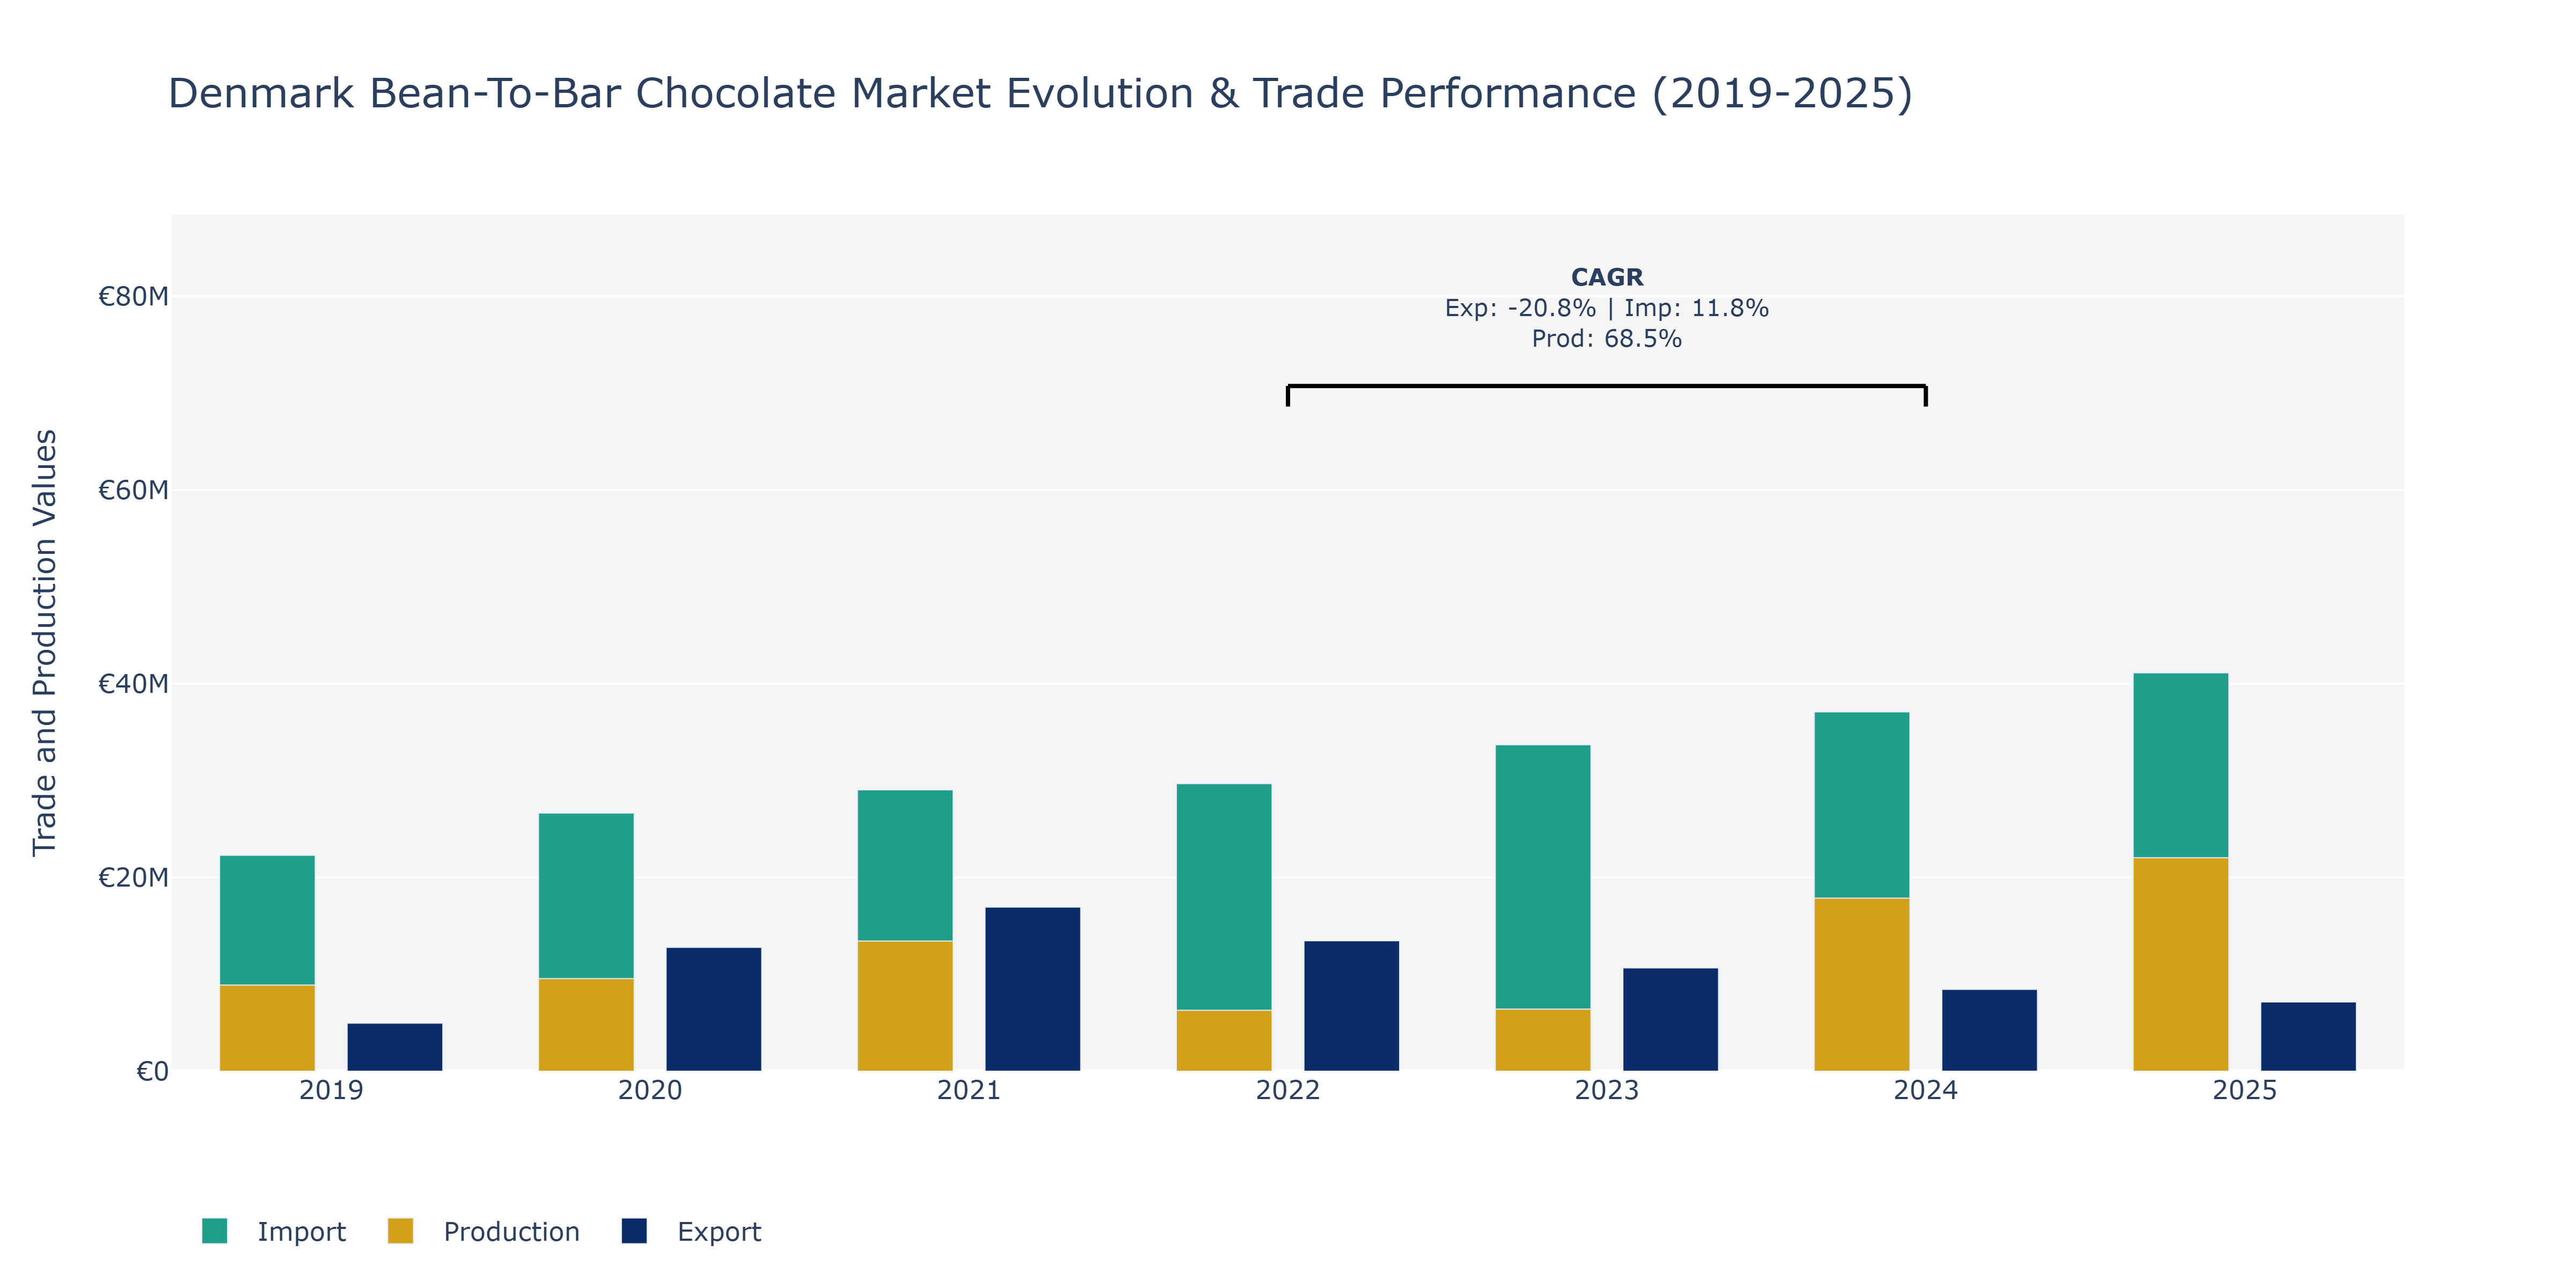
In the Denmark Bean-To-Bar Chocolate Market, exports experienced fluctuations over the years, starting at €4.96 million in 2019, increasing to €12.79 million in 2020, then peaking at €16.94 million in 2021, and slightly declining to €13.46 million in 2022. The decline continued in 2023 and 2024, reaching €8.45 million. Imports, on the other hand, consistently increased, from €22.29 million in 2019 to €41.12 million in 2025. Production saw a remarkable growth trend, with a substantial increase from €8.89 million in 2019 to €22.03 million in 2025. The fluctuations in exports can be attributed to changing consumer preferences, global economic conditions, and competitive pricing strategies. The consistent rise in imports may indicate growing demand for chocolate products in Denmark, possibly due to an increase in disposable income and a preference for diverse chocolate varieties. The significant growth in production reflects the market's response to increased demand, potentially driven by investments in production capacity and technology upgrades to meet consumer expectations for quality and variety.
Key Highlights of the Report:
- Denmark Bean-To-Bar Chocolate Market Outlook
- Market Size of Denmark Bean-To-Bar Chocolate Market, 2025
- Forecast of Denmark Bean-To-Bar Chocolate Market, 2032
- Historical Data and Forecast of Denmark Bean-To-Bar Chocolate Revenues & Volume for the Period 2022 - 2032
- Denmark Bean-To-Bar Chocolate Market Trend Evolution
- Denmark Bean-To-Bar Chocolate Market Drivers and Challenges
- Denmark Bean-To-Bar Chocolate Price Trends
- Denmark Bean-To-Bar Chocolate Porter's Five Forces
- Denmark Bean-To-Bar Chocolate Industry Life Cycle
- Historical Data and Forecast of Denmark Bean-To-Bar Chocolate Market Revenues & Volume By Type for the Period 2022 - 2032
- Historical Data and Forecast of Denmark Bean-To-Bar Chocolate Market Revenues & Volume By Dark Chocolate for the Period 2022 - 2032
- Historical Data and Forecast of Denmark Bean-To-Bar Chocolate Market Revenues & Volume By Milk Chocolate for the Period 2022 - 2032
- Historical Data and Forecast of Denmark Bean-To-Bar Chocolate Market Revenues & Volume By White Chocolate for the Period 2022 - 2032
- Historical Data and Forecast of Denmark Bean-To-Bar Chocolate Market Revenues & Volume By Chocolate Bean for the Period 2022 - 2032
- Historical Data and Forecast of Denmark Bean-To-Bar Chocolate Market Revenues & Volume By Others for the Period 2022 - 2032
- Historical Data and Forecast of Denmark Bean-To-Bar Chocolate Market Revenues & Volume By Application for the Period 2022 - 2032
- Historical Data and Forecast of Denmark Bean-To-Bar Chocolate Market Revenues & Volume By Supermarkets for the Period 2022 - 2032
- Historical Data and Forecast of Denmark Bean-To-Bar Chocolate Market Revenues & Volume By Convenience Stores for the Period 2022 - 2032
- Historical Data and Forecast of Denmark Bean-To-Bar Chocolate Market Revenues & Volume By Independent Retailers for the Period 2022 - 2032
- Historical Data and Forecast of Denmark Bean-To-Bar Chocolate Market Revenues & Volume By Online Sales for the Period 2022 - 2032
- Historical Data and Forecast of Denmark Bean-To-Bar Chocolate Market Revenues & Volume By Others for the Period 2022 - 2032
- Denmark Bean-To-Bar Chocolate Import Export Trade Statistics
- Market Opportunity Assessment By Type
- Market Opportunity Assessment By Application
- Denmark Bean-To-Bar Chocolate Top Companies Market Share
- Denmark Bean-To-Bar Chocolate Competitive Benchmarking By Technical and Operational Parameters
- Denmark Bean-To-Bar Chocolate Company Profiles
- Denmark Bean-To-Bar Chocolate Key Strategic Recommendations
Frequently Asked Questions About the Market Study (FAQs):
6Wresearch actively monitors the Denmark Bean-To-Bar Chocolate Market and publishes its comprehensive annual report, highlighting emerging trends, growth drivers, revenue analysis, and forecast outlook. Our insights help businesses to make data-backed strategic decisions with ongoing market dynamics. Our analysts track relevent industries related to the Denmark Bean-To-Bar Chocolate Market, allowing our clients with actionable intelligence and reliable forecasts tailored to emerging regional needs.
Yes, we provide customisation as per your requirements. To learn more, feel free to contact us on sales@6wresearch.com
1 Executive Summary |
2 Introduction |
2.1 Key Highlights of the Report |
2.2 Report Description |
2.3 Market Scope & Segmentation |
2.4 Research Methodology |
2.5 Assumptions |
3 Denmark Bean-To-Bar Chocolate Market Overview |
3.1 Denmark Country Macro Economic Indicators |
3.2 Denmark Bean-To-Bar Chocolate Market Revenues & Volume, 2022 & 2032F |
3.3 Denmark Bean-To-Bar Chocolate Market - Industry Life Cycle |
3.4 Denmark Bean-To-Bar Chocolate Market - Porter's Five Forces |
3.5 Denmark Bean-To-Bar Chocolate Market Revenues & Volume Share, By Type, 2022 & 2032F |
3.6 Denmark Bean-To-Bar Chocolate Market Revenues & Volume Share, By Application, 2022 & 2032F |
4 Denmark Bean-To-Bar Chocolate Market Dynamics |
4.1 Impact Analysis |
4.2 Market Drivers |
4.2.1 Increasing consumer preference for high-quality and ethically sourced chocolate products |
4.2.2 Growing trend of health-conscious consumers seeking organic and natural ingredients in chocolates |
4.2.3 Rising demand for unique and artisanal chocolate flavors in the market |
4.3 Market Restraints |
4.3.1 Fluctuating prices of raw materials such as cocoa beans impacting production costs |
4.3.2 Intense competition from established chocolate brands in Denmark |
4.3.3 Regulatory challenges related to food safety standards and certifications |
5 Denmark Bean-To-Bar Chocolate Market Trends |
6 Denmark Bean-To-Bar Chocolate Market, By Types |
6.1 Denmark Bean-To-Bar Chocolate Market, By Type |
6.1.1 Overview and Analysis |
6.1.2 Denmark Bean-To-Bar Chocolate Market Revenues & Volume, By Type, 2022 - 2032F |
6.1.3 Denmark Bean-To-Bar Chocolate Market Revenues & Volume, By Dark Chocolate, 2022 - 2032F |
6.1.4 Denmark Bean-To-Bar Chocolate Market Revenues & Volume, By Milk Chocolate, 2022 - 2032F |
6.1.5 Denmark Bean-To-Bar Chocolate Market Revenues & Volume, By White Chocolate, 2022 - 2032F |
6.1.6 Denmark Bean-To-Bar Chocolate Market Revenues & Volume, By Chocolate Bean, 2022 - 2032F |
6.1.7 Denmark Bean-To-Bar Chocolate Market Revenues & Volume, By Others, 2022 - 2032F |
6.2 Denmark Bean-To-Bar Chocolate Market, By Application |
6.2.1 Overview and Analysis |
6.2.2 Denmark Bean-To-Bar Chocolate Market Revenues & Volume, By Supermarkets, 2022 - 2032F |
6.2.3 Denmark Bean-To-Bar Chocolate Market Revenues & Volume, By Convenience Stores, 2022 - 2032F |
6.2.4 Denmark Bean-To-Bar Chocolate Market Revenues & Volume, By Independent Retailers, 2022 - 2032F |
6.2.5 Denmark Bean-To-Bar Chocolate Market Revenues & Volume, By Online Sales, 2022 - 2032F |
6.2.6 Denmark Bean-To-Bar Chocolate Market Revenues & Volume, By Others, 2022 - 2032F |
7 Denmark Bean-To-Bar Chocolate Market Import-Export Trade Statistics |
7.1 Denmark Bean-To-Bar Chocolate Market Export to Major Countries |
7.2 Denmark Bean-To-Bar Chocolate Market Imports from Major Countries |
8 Denmark Bean-To-Bar Chocolate Market Key Performance Indicators |
8.1 Percentage of repeat customers for bean-to-bar chocolate brands |
8.2 Number of new product launches and innovations in the market |
8.3 Average customer rating and feedback on taste, quality, and packaging of bean-to-bar chocolates |
9 Denmark Bean-To-Bar Chocolate Market - Opportunity Assessment |
9.1 Denmark Bean-To-Bar Chocolate Market Opportunity Assessment, By Type, 2022 & 2032F |
9.2 Denmark Bean-To-Bar Chocolate Market Opportunity Assessment, By Application, 2022 & 2032F |
10 Denmark Bean-To-Bar Chocolate Market - Competitive Landscape |
10.1 Denmark Bean-To-Bar Chocolate Market Revenue Share, By Companies, 2025 |
10.2 Denmark Bean-To-Bar Chocolate Market Competitive Benchmarking, By Operating and Technical Parameters |
11 Company Profiles |
12 Recommendations |
13 Disclaimer |
Global Go To Market Strategy - 2030
Export potential enables firms to identify high-growth global markets with greater confidence by combining advanced trade intelligence with a structured quantitative methodology. The framework analyzes emerging demand trends and country-level import patterns while integrating macroeconomic and trade datasets such as GDP and population forecasts, bilateral import–export flows, tariff structures, elasticity differentials between developed and developing economies, geographic distance, and import demand projections. Using weighted trade values from 2020–2024 as the base period to project country-to-country export potential for 2030, these inputs are operationalized through calculated drivers such as gravity model parameters, tariff impact factors, and projected GDP per-capita growth. Through an analysis of hidden potentials, demand hotspots, and market conditions that are most favorable to success, this method enables firms to focus on target countries, maximize returns, and global expansion with data, backed by accuracy.
By factoring in the projected importer demand gap that is currently unmet and could be potential opportunity, it identifies the potential for the Exporter (Country) among 190 countries, against the general trade analysis, which identifies the biggest importer or exporter.
To discover high-growth global markets and optimize your business strategy:
Click Here
Pricing
- Single User License$ 1,995
- Department License$ 2,400
- Site License$ 3,120
- Global License$ 3,795

Leadership Perspectives from Industry Events
Search
Thought Leadership and Analyst Meet


Our Clients
6WResearch In News
- India Export Attractiveness Tracker 2026
- India Air Conditioner Market Set for Strong Rebound in 2026 After Weather-Led Correction and GST-Driven Recovery: 6Wresearch
- ADAS in India: How Automatic Emergency Braking, Blind Spot Detection & Driver Monitoring are Transforming Road Safety
- Doha a strategic location for EV manufacturing hub: IPA Qatar
- Demand for luxury TVs surging in the GCC, says Samsung
- Empowering Growth: The Thriving Journey of Bangladesh’s Cable Industry
Latest Reports
- Nicaragua RPG Gaming Market (2026-2032)
- New Zealand RPG Gaming Market (2026-2032)
- Netherlands RPG Gaming Market (2026-2032)
- Nauru RPG Gaming Market (2026-2032)
- Namibia RPG Gaming Market (2026-2032)
- Mozambique RPG Gaming Market (2026-2032)
- Montenegro RPG Gaming Market (2026-2032)
- Mongolia RPG Gaming Market (2026-2032)
- Monaco RPG Gaming Market (2026-2032)
- Micronesia RPG Gaming Market (2026-2032)
Industry Events and Analyst Meet

EV India Expo 2026

HIMTEX 2026

India Refining Summit 2026

India EV Show 2026

EV tech India Expo 2026
Whitepaper
- Middle East & Africa Commercial Security Market Click here to view more.
- Middle East & Africa Fire Safety Systems & Equipment Market Click here to view more.
- GCC Drone Market Click here to view more.
- Middle East Lighting Fixture Market Click here to view more.
- GCC Physical & Perimeter Security Market Click here to view more.